Abstract
Purpose
Investigate the involvement of vascular endothelial growth factor receptor 1 (VEGFR1) in vasculogenic mimicry (VM) formation in ocular melanoma, as well as whether or not VEGFR1-targeted contrast-enhanced ultrasound (CEUS) can evaluate and quantify VM perfusion and function in the ocular melanoma model.
Methods
The expression of VEGFR1 was examined using immunofluorescence, western blot, and quantitative polymerase chain reaction. VM networks were analyzed with tube formation and periodic acid Schiff staining. Targeted microbubbles (MBs) were constructed and used for targeted CEUS imaging in vivo. Comparisons were made in perfusion parameters of tumors between targeted and non-targeted CEUS imaging.
Results
VEGFR1 was highly expressed, and knockdown of VEGFR1 significantly decreased VM protein expression and disrupted VM formation in MUM-2B melanoma. VEGFR1-targeted MBs specifically bind to MUM-2B cell surfaces. CEUS with VEGFR1-targeted MBs showed significant imaging enhancement throughout the entire perfusion phase compared with CEUS with IgG MBs. VEGFR1-targeted imaging was able to detect a decrease in maximum intensity and mean transit time in VEGFR1 knockdown melanoma compared with control melanoma. The pathological VM patterns were consistent with VEGFR1-targeted CEUS findings.
Conclusions
VEGFR1 was responsible for VM network formation and was required for efficient choroidal melanoma tumor growth. This study shows that VEGFR1-targeted CEUS can track VM levels in animal models of ocular melanoma at morphological levels in vivo. This experiment is noninvasive and reproducible and indicates the possibility of real-time in vivo imaging technology for VM evaluation.
Translational Relevance
Based on our study results, VEGFR1 could prove to be a promising treatment that targets VM formation in choroidal melanoma. Our findings also suggest the potential use of VEGFR1-targeted CEUS for quantitative monitoring of VM processes at the molecular level in the future.
Keywords: choroidal melanoma, ultrasound molecular imaging, vasculogenic mimicry, VEGFR1
Introduction
In contrast to tumor blood vessel growth, choroidal melanoma cells can form vasculogenic mimicry (VM).1,2 VM is described as extracellular matrix–rich and patterned vessel-like networks that provide growing tumors with sufficient blood perfusion.2,3 Studies have revealed the involvement of vascular endothelial growth factor A (VEGFA) and its downstream receptor, VEGF receptor 1 (VEGFR1), in melanoma VM formation.4,5 However, the molecular mechanism of VEGFR1 involved in governing VM has not been studied in choroidal melanoma.
Contrast-enhanced ultrasound (CEUS) is a promising technique for monitoring vascular contrast enhancement patterns in real time. Ultrasound contrast agents are composed of microbubbles (MBs), which strongly amplify the backscatter signal and enhance the echogenicity of the intravascular “blood pool.”6,7 We applied CEUS to detect the microcirculation patterns and to quantify blood circulation in choroidal melanoma in animal models.3 Targeted CEUS, which employs targeting molecules conjugated to the surface of MBs, was later introduced as a molecular imaging method. This technique shows promise for enhancing diagnostic specificity, monitoring cancer progression, and guiding therapeutic choices.8
In this study, we first investigated the critical role of VEGFR1 in the regulation of VM formation in MUM-2B human melanoma in vitro and in vivo. Then, VEGFR1 was conjugated to the surface of MBs to create VEGFR1-targeted MBs that specifically target MUM-2B cells. Finally, we attempted to assess VEGFR1-targeted MBs using a clinical ultrasound system to predict VM levels in vivo in animal models of MUM-2B choroidal melanoma. This study aimed to advance the further use of VEGFR1-targeted CEUS to examine VM in tumors for precise diagnosis and treatment efficacy in the future.
Materials and Methods
All procedures in this study were conducted according to the Association for Research in Vision and Ophthalmology Statement for the Use of Animals in Ophthalmic and Vision Research. The experiment was approved by the Shanghai JiaoTong University Institutional Animal Care and Use Committee.
Cell Culture and Plasmid Transfection
The human choroidal melanoma cell line MUM-2B was kindly provided by Shanghai Ninth People's Hospital (Shanghai, China). Cells were grown in Dulbecco's modified Eagle's medium (DMEM) (Gibco; Thermo Fisher Scientific, Waltham, MA) with 4.5 g/L glucose, 10% Gibco fetal bovine serum, and 1% penicillin–streptomycin. Cells were incubated at 37°C in 5% CO2.
VEGFR1 Knockdown by Lentiviral shRNA
The shRNA oligos for pLKO.1-shVEGFR1 targeting human VEGFR1 were designed online (https://rnaidesigner.thermofisher.com/rnaiexpress/sort.do). The shRNA sequences were as follows: shRNA-1 GCAACAGTCAATGGGCATTTG; shRNA-2 GG-AGTGGACCATCATTCAAAT; shRNA-3 GCTAT-TTGACTCGTGGCTACT; shRNA-4 GCATCAGC-ATTTGGCATTAAG; and non-targeting shRNA TT-CTCCGAACGTGTCACGTAC. pLKO.1-VEGFR1 or non-target control shRNA with packing plasmids pSPA and pMD2G (Addgene; Cambridge, MA) was transfected into HEK293 packing cells using Lipofectamine 3000 (Thermo Fisher Scientific) according to the manufacturer's protocol. Lentiviral supernatants were used to infect MUM-2B melanoma cells. Stable transfectants were selected.
Implantation of MUM-2B Cells into the Suprachoroidal Space in Mice
Male BALB/c-nu mice (6–8 weeks old, 22–25 g; Shanghai Institutes for Biological Sciences, China) were housed five per cage under a 12-hour light/dark cycle at 22 to 24°C, with food and water provided ad libitum. An injection of 3 µL MUM-2B cell suspension containing 2 × 10⁵ cells was administered to the suprachoroidal space of C57BL mice via the method described previously with some modifications.9 A scleral incision was carefully made through the sclera with a 33-gauge needle. When the tip reached the pigmented choroid layer, the needle direction was changed parallel to the choroid, thus avoiding injuring the retina. The needle tip then reached the suprachoroidal space. Instead of injecting hyaluronic acid, the MUM-2B cell suspension was injected into the suprachoroidal space. Briefly, after the mice were anesthetized, their pupils were dilated, and the corneas were topically anesthetized as above. A self-sealing scleral incision was made using the tip of a 33-gauge needle with the bevel pointed up. A scleral tunnel was made through the sclera into the choroid. A small hole was then punctured through the cornea with a 33-gauge beveled needle to lower the intraocular pressure. A 34-gauge blunt needle attached to a 10-µl syringe (Hamilton Company; Reno, NV) was introduced through the scleral tunnel, and 3 µl of melanoma cells was injected suprachoroidally. After injection, tobramycin–dexamethasone ointment (Alcon Laboratories; Fort Worth, TX) was applied to prevent infection.
Western Blot
Cells and tumor tissue were washed with phosphate buffered saline (PBS) and lysed using radioimmunoprecipitation assay buffer with a protease inhibitor (Roche; Basel, Switzerland). The protein content in the lysates was measured using a bicinchoninic acid assay. Cell lysates were boiled with loading buffer at 99°C for 10 minutes. Approximately 50 µg of protein was loaded onto 10% Tris-glycine sodium dodecyl sulfate polyacrylamide gel electrophoresis and transferred onto polyvinylidene difluoride membranes for western blotting. Membranes were incubated at 4°C overnight in primary antibody, including vascular endothelial (VE)-cadherin antibody (Cell Signaling Technology; Danvers, MA), VEGFR1 antibody (Abcam; Cambridge, UK), EphA2 antibody (Cell Signaling Technology), MMP2 antibody (Abcam), and MMP9 antibody (Abcam). Blots were developed using an ECL Plus kit (GE Healthcare; Chicago, IL) and a GE Healthcare molecular imaging system. Glyceraldehyde 3-phosphate dehydrogenase (1:1000) (Cell Signaling Technology) was used as a control. Western blots were then densitometrically quantified using ImageJ software (National Institutes of Health; Bethesda, MD). Normalized protein levels were calculated and compared by fold change.
Tube Formation Assay
The Matrigel-based tube formation assay (Corning Life Sciences; Corning, NY) was performed using the method described previously.10 Briefly, growth factor-reduced Matrigel was thawed on ice. Then, 50 µl of Matrigel was plated on 96-well plates (Corning) that were horizontally level such that the Matrigel could distribute evenly, and the plates were incubated for 30 minutes at room temperature and for 30 minutes at 37°C. Melanoma cells (1 × 10⁴) were resuspended in serum-free DMEM to serve as the tumor cells. The cell suspension was loaded on top of the Matrigel. Each group contained four to six repeated wells. Following incubation at 37°C for 2 to 8 hours, each well was analyzed continuously under a microscope. Tubules in each field were imaged under a microscope (10×), and tubules from three to five random fields in each well were counted and recorded for analysis.
Targeted Microbubble Preparation
CEUS imaging of the choroidal melanoma was performed using the USphere Labeler (1.2-µm, biotin–avidin MBs) (Trust Bio-sonics; Hsinchu, Taiwan), and vibration activation was induced for 40 seconds by a special concussion instrument (Trust Bio-sonics) just before use. The biotinylated MBs were then incubated with green fluorescent protein (GFP) and biotin double-labeled VEGFR1/IgG antibody (1 mg/ml) (Abcam) for 1 hour at 4°C. The MBs were subsequently centrifuged and resuspended in cold fresh PBS buffer to remove excess antibody. Finally, the VEGFR1 MBs, the control IgG MBs, and pure lipid MBs were stored at 4°C temporarily before use.
Estimation of Microbubble Conjugation and Affinity Efficiency in Vitro
The antibody labeling efficiency was determined by observation of the GFP signal in the MB surface with a fluorescence microscope system (Olympus; Tokyo, Japan) at an excitation wavelength of 488 nm. To estimate the affinity of targeted MBs to cells, MUM-2B cells were harvested as 5 × 10⁴/100 µl in each 1.5-ml Eppendorf microcentrifuge tube (Sigma-Aldrich; St. Louis, MO). VEGFR1 MBs and IgG MBs (both labeled with GFP) were adjusted to the same concentration with DMEM at a 50:1 volume ratio. Because of the buoyancy of the MBs, the pipes were inverted several times to cause contact between the cells and the MBs. After 10 minutes of targeting at room temperature, the cells were washed twice with PBS and examined under a microscope system (Olympus). Images were taken from five randomly selected fields of view per well.
CEUS Imaging
In vivo ultrasound imaging was performed by a single experienced doctor (J. Gu) for all animals in each group. Real-time imaging was performed using a LOGIQ E9 high-resolution imaging system (GE Healthcare). A GE 9L probe was used and immobilized to reduce the artifacts in the images; the probe position was kept constant throughout the recording period for each animal. The ultrasound parameters were optimized for mice according to the manufacturer's instructions. Ultrasound gel was applied to the mouse's eyes as a coupling agent. The probe was adjusted such that the tumor was centered on the ultrasound monitor within the focal zone, and the acoustic focus was placed at the center of the tumor.
Mice were anesthetized by continuous inhalation of 2% isoflurane in oxygen. An ultrasound coupling gel was applied. The gray-level intensity of B-mode images and color Doppler imaging (CDI) images were recorded in the region of interest within the tumor. The tumor length and width were measured at the level of the largest transverse cross-section. Then, different MBs were administered by retrobulbar injection at the same concentration with the same volume of 0.1 ml. CEUS real-time imaging began immediately after MB injection with a 34-gauge needle. Images were taken in the contrast mode at a frame rate of six to eight frames per second. Digital image files were analyzed offline using the commercially available software SonoLiver v1.1.15.0 (TomTec Imaging Systems, Munich, Germany).11,12 Images were analyzed in random order by a radiologist with 5 years of experience who was blinded to the group assignments. Maximum intensity (IMAX), rise time (RT), time to peak, mean transit time (mTT), and quality of fit values were exported to Microsoft Excel (Redmond, WA) files for analysis.
Immunofluorescence and Immunohistochemistry
For immunofluorescence staining, animals were killed and transcardially perfused with 0.9% NaCl solution and then 4% paraformaldehyde using an Easy-Load II peristaltic perfusion pump (Masterflex; Gelsenkirchen, Germany). The eyes were frozen in Tissue-Tek O.C.T. Compound (Sakura; Torrance, CA) and then cut using a microtome into 10-µm sections. The slides were stored at –20°C before use. Immunofluorescence staining was carried out on three or four serial 10-µm coronal sections of the eyes. The sections were incubated in the primary antibodies as above at –4°C for 12 hours. On the following day, sections were incubated with Alexa Fluor 488 secondary antibody (1:1000, 1 hour) (Thermo Fisher Scientific) in the blocking solution at room temperature and with DAPI blue stain for 10 minutes at room temperature. The slides were cover-slipped, and intensity was assessed using a confocal microscope (Leica Camera; Wetzlar, Germany). The image analysis was performed on three or four sections per mouse in each group by two independent observers.
The mice were killed and perfused as above. The enucleated eyes were fixed in 4% paraformaldehyde overnight and embedded in paraffin. Serial 4-µm sections were prepared and stained with hematoxylin–eosin and PAS. All tumor microvessels were visualized with standard immunoperoxidase staining techniques. Slides were examined at 100×, 200×, and 400× magnification (Olympus).
Statistical Analysis
Statistical analysis was performed using SPSS software (IBM; Armonk, NY) software. The mean, standard deviation, and standard error of the mean were calculated for all parameters. After the homogeneity of variance was evaluated, Kruskal–Wallis tests followed by Nemenyi tests and Bonferroni corrections were used to assess differences between the groups. A P value of less than 0.05 indicated a statistically significant difference.
Results
VEGFR1- and VM-Related Proteins Were Preferentially Expressed in MUM-2B Melanoma Cells in Vivo and in Vitro
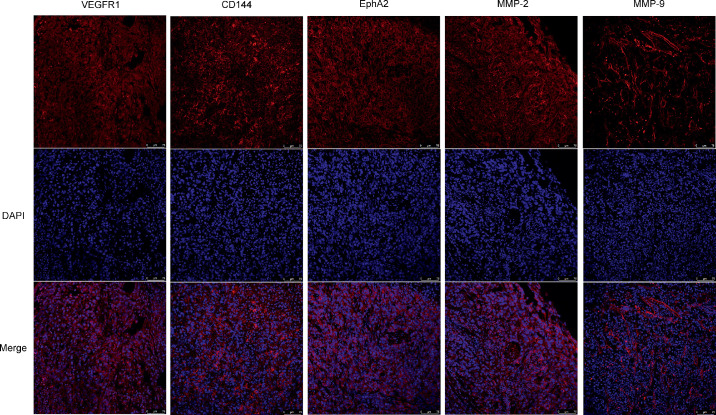
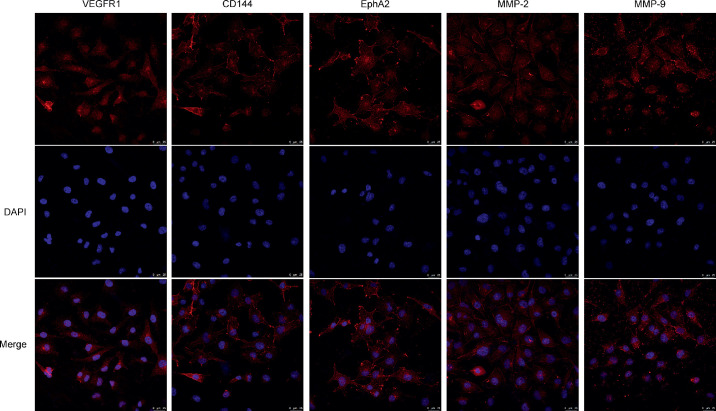
VEGFR1 has been reported to play a role in the melanoma VM structure in tumors.4,5,13 To determine whether VEGFR1 is present in choroidal melanoma, cultured MUM-2B cells and tumor samples from an ocular melanoma animal model were examined. Immunofluorescence showed that VEGFR1 was expressed throughout the majority of the tumor sections in all samples. In addition, MUM-2B cells expressed high levels of VEGFR1. Typical images are shown (Figs. 1, 2, first column). Additionally, many molecules, with their binding partners, are required for the formation and maintenance of VM in tumors.2 These proteins mainly include VE-cadherin, EphA2, and matrix metalloproteinase (MMP-2, MMP-9).14 Immunofluorescence showed strong expression of VE-cadherin, EphA2, MMP-2, and MMP-9 in choroidal melanoma in cells and tissue sections (Figs. 1, 2). Thus, VEGFR1 was highly expressed in MUM-2B melanoma cells, and cells had the potential to participate in VM.
Figure 1.
MUM-2B human melanoma preferentially expressed VEGFR1 and VM-related markers in vivo. Sections of melanoma tissue were collected at 2 weeks after implantation and were stained with VEGFR1, CD144, EphA2, MMP-2, MMP-9 (red), and DAPI (blue). Sections were examined by fluorescence microscopy. Scale bars, 75 µm. (n. 3).
Figure 2.
MUM-2B melanoma preferentially expressed VEGFR1 and VM-related markers in vitro. MUM-2B human melanoma lines were stained with VEGFR1, CD144, EphA2, MMP-2, MMP-9 (red), and DAPI (blue). Sections were examined by fluorescence microscopy. Scale bars, 25 µm. (n. 3).
The VEGFR1 Signaling Pathway Regulated Choroidal Melanoma VM Formation in Vitro and in Vivo
We hypothesized that VEGFR1 might affect VM formation in choroidal melanoma. To elucidate the contribution of VEGFR1 to VM, a stable VEGFR1 knockdown (VEGFR1 KD) was generated in MUM-2B choroidal melanoma cells using lentiviral shRNA. Western blotting revealed a significant knockdown efficiency at the protein level achieved by VEGFR1 shRNA-1 and shRNA-3 in vitro compared with the control harboring non-target shRNA (Fig. 3A). Quantitative polymerase chain reaction revealed that VEGFR1 mRNA expression was suppressed by shRNA-3 compared with the control (Fig. 3E). Furthermore, VM proliferation-related molecules were significantly downregulated only in VEGFR1 KD MUM-2B melanoma cells and not in control cells (Figs. 3A, 3C, 3D). This result verified that VEGFR1 partially controls the VM-forming potential in choroidal melanoma.
Figure 3.
VEGFR1 was knocked down by lentiviral shRNA and downregulated VM-related proteins in melanoma cells. (A) Western blot of MUM-2B human melanoma cells collected at the logarithmic growth phase and subjected to western blot analysis. (n. 3). (B–D) Quantification of VEGFR1, CD144, and EphA2 proteins detected by immunoblot (A). Immunoblot densities were normalized to Gapdh as an internal control and compared with the density of the control. Bars depict the mean total intensity. (n. 3). *P < 0.05. (E) RT-PCR analysis of expression of the VEGFR1 gene in MUM-2B human melanoma cells. The expression of the gene for Gapdh was examined as a control. Bars depict the mean total mRNA. (n. 3). *P < 0.05.
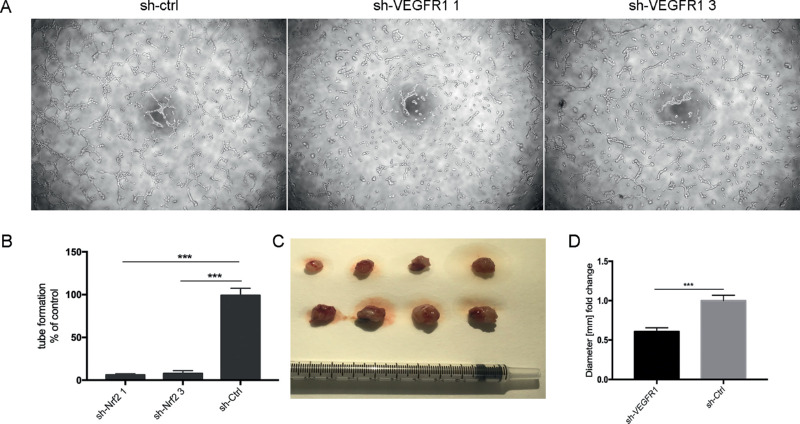
To investigate whether choroidal melanoma cells act as vascular mural-like cells to develop vascular channels, a tube formation assay was performed. Control MUM-2B cells formed a capillary phenotype on Matrigel (Fig. 4). In contrast, VEGFR1 suppression by shRNA attenuated VM networks in MUM-2B melanoma by 80% to 90% (Fig. 4). We next investigated the effects of VEGFR1 KD on melanoma growth in vivo. VEGFR1 KD cells gave rise to two times smaller tumors than control melanoma cells (Figs. 4C, 4D). These findings verified that the vascular event of choroidal melanoma is dependent on VEGFR1 expression. VEGFR1 is required for in vivo tumor growth.
Figure 4.
VEGFR1 knockdown attenuated tumorigenicity in three-dimensional gels of collagen I in vitro. (A) The VM tube formation assay in MUM-2B cells of control (sh-ctrl) and VEGFR1 KD (sh-VEGFR1 1 and sh-VEGFR1 3). Images are representative examples from three separate experiments. (B) Quantification of vascular tube formation density. (n. 3). *P < 0.05. (C) Macroscopic appearance of control and VEGFR1-KD-treated melanoma dissected after 2 weeks of tumor growth. (D) Quantification of tumor volume (A). (n. 4). *P < 0.05.
VEGFR1 MBs Statically and Specifically Bind to MUM-2B Melanoma Cells in Vitro
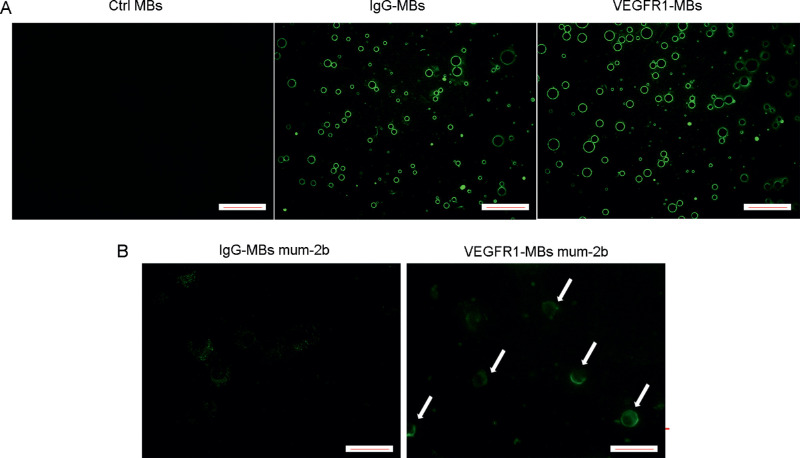
In this study, we designed a novel strategy with targeted MBs to exploit the potential of VEGFR1 as a diagnostic target of VM. First, to examine antibodies of VEGFR1 and IgG that specifically conjugate to MBs, a static binding experiment was performed by incubating IgG or VEGFR1 antibodies with MBs according to the manufacturer's instructions. Many VEGFR1 or IgG antibodies attached to the MBs and showed round and uniform strong fluorescence on the MB surface (Fig. 5A). No significant difference was observed between VEGFR1 MBs and IgG MBs. MBs that were not incubated with antibodies showed no fluorescence (Fig. 5A). Second, to examine the specific binding of VEGFR1 MBs on MUM-2B cells, a static binding experiment was performed by incubating IgG MBs or VEGFR1 MBs with MUM-2B cells. Many VEGFR1 MBs attached to the MUM-2B melanoma cells in vitro and showed strong, round fluorescence on the cell surface, whereas cells incubated with IgG MBs with few non-specific MBs bound to the cells showed weak, dotted green fluorescence (Fig. 5B). Thus, VEGFR1 and IgG MBs were successfully constructed, and VEGFR1 MBs showed static binding specificity to MUM-2B melanoma cells compared with IgG MBs.
Figure 5.
Comparison of VEGFR1 and IgG antibody conjugated to the surface of MBs and static binding specificity to MUM-2B melanoma cells. (A) Biotin and GFP double-labeled IgG antibody and VEGFR1 antibody were conjugated to the surface of MBs. Fluorescent microscopy showed conjugation of antibodies to MBs with a significant green annular fluorescence signal on the MB surface. (B) MUM-2B cells were subjected to a static binding assay with preincubation with IgG MBs or VEGFR1 MBs. VEGFR1 MBs targeting MUM-2B melanoma cells showed a significant green annular fluorescence signal on the cell surface (white arrow). IgG MBs administered in MUM-2B melanoma cells showed non-specific, weak, dotted fluorescence. Images are representative examples from three separate experiments. Scale bars, 50 µm. (n. 3).
Comparison of IgG MBs or VEGFR1 MBs CEUS Imaging in Ocular Melanoma in Vivo
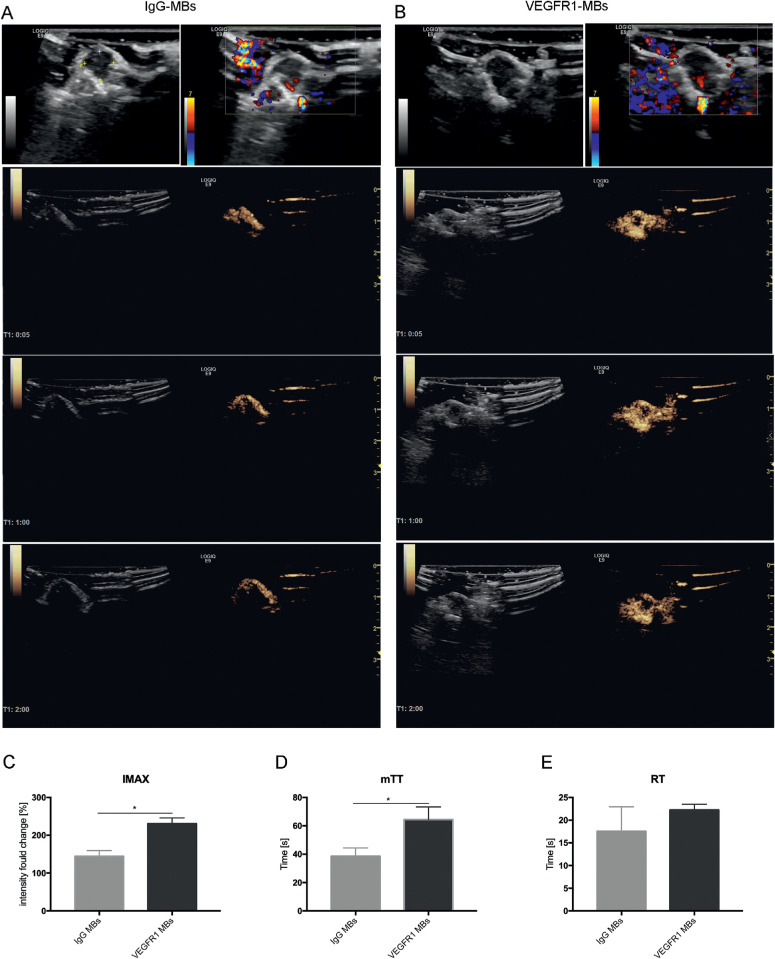
Gray-scale B-mode imaging and CDI imaging were performed for tumor identification and visualization of flow within tumors in a mouse model of MUM-2B ocular melanoma. Tumors were characterized by solid choroidal lesions with non-uniform echo. The boundary was not clear. Within the tumor, relatively low intensity might represent apoptosis or necrosis within the mass, and no high-intensity calcification was presented (Figs. 6A, 6B, row 1). CDI images showed only large vessels in the posterior aspect of the eye but were not able to show any blood perfusion signals within the tumor.
Figure 6.
Typical images of the comparison of IgG MB or VEGFR1 MB CEUS imaging in melanoma in vivo. (A, B) Typical images of CEUS imaging after IgG MB (A) or VEGFR1 MB (B) administration. B-mode images and CDI images (first row) are shown for tumor identification and visualization of flow within the tumor. CEUS images (second to fourth rows) were acquired at 5 seconds, 1 minute, and 2 minutes after injection. Bright yellow areas indicate signals of CEUS imaging. The three rows are the average intensity images from 6-second clips. (C–E) VEGFR1-targeted MB perfusion parameters were derived by digital subtraction from the background frame. IMAX, mTT, and RT were calculated from time–intensity curves for IgG MB imaging (A) and VEGFR1 MB imaging (B). Comparisons were performed with t-tests. (n. 5). *P < 0.05.
Contrast-enhanced ultrasound was performed using IgG MBs or VEGFR1 MBs to image and quantify microcirculation in MUM-2B ocular melanoma. The accumulation of VEGFR1 MB contrast agent in tumor microcirculation was significantly enhanced through the entire imaging phase compared with tumors that were injected with IgG MBs (Figs. 6A, 6B, rows 2–4). Additionally, the VEGFR1 MB contrast agent permitted better imaging of the whole tumor. Typical images were captured at 5 seconds, 1 minute, and 2 minutes after MBs administration. Subsequently, the deconvolved images were stacked to build a time–intensity curve (TIC) offline using SonoLiver software. The postprocessed imaging parameters from the TIC indicated that the IMAX and mTT in VEGFR1 MBs imaging were significantly higher than in the IgG control MBs (Figs. 6C, 6D). However, there was no significant difference in RT between the two groups (Fig. 6E). Therefore, the signal generated in the tumor from VEGFR1-targeted MBs suggests that a detectable level of VM vasculature is present in these models.
Comparison of VEGFR1 MB CEUS Imaging for Control or VEGFR1 KD Ocular Melanoma in Vivo
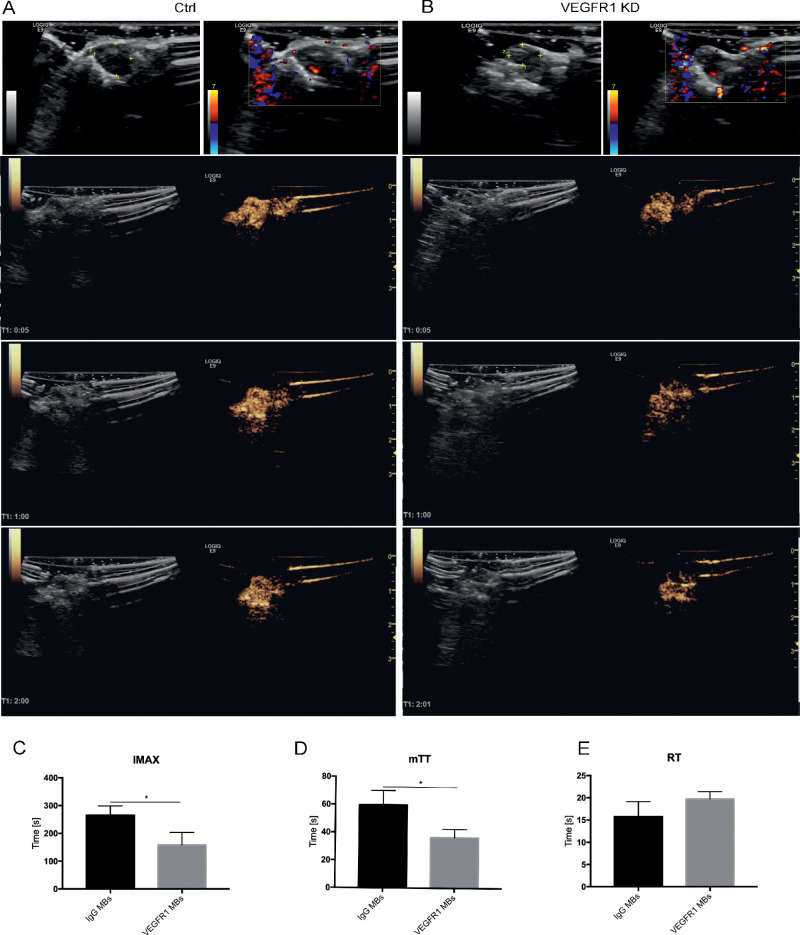
Ultrasound images were taken and compared between two groups of melanoma: control or VEGFR1 KD ocular melanoma. With the gray-scale B-mode imaging, both control and VEGFR1 KD ocular melanoma tumors were characterized by solid choroidal lesions with non-uniform echo. Control melanoma had a relatively lower intensity and larger volume than VEGFR1 KD melanoma (Figs. 7A, 7B, first rows). CDI images showed only large vessels in the posterior aspect of the eye but were not able to show any blood perfusion signals within either type of tumor.
Figure 7.
Typical images of VEGFR1 MB CEUS imaging in comparison to control or VEGFR1-KD melanoma in vivo. (A, B) Typical images of VEGFR1 MB CEUS imaging after MB administration in control melanoma (A) or VEGFR1-KD melanoma (B). B-mode images and CDI images (first column) are shown for tumor identification and visualization of flow within tumors. CEUS images (second to fourth column) were acquired at 5 seconds, 1 minute, and 2 minutes after injection. The three rows are the average or minimum intensity images from 6-second clips. (C–E) VEGFR1-targeted MB perfusion parameters were derived by digital subtraction from the background frame. IMAX, mTT, and RT were calculated from time–intensity curves of IgG MB imaging (A) and VEGFR1 MB imaging (B). Comparisons were performed with t-tests. (n. 5). *P < 0.05.
Contrast-enhanced ultrasound was performed using VEGFR1 MBs to image and quantify the microcirculation in the two groups. The accumulation of VEGFR1 MB contrast agent in control melanoma was significantly enhanced throughout the imaging phases compared with VEGFR1 KD melanoma (Figs. 7A, 7B, rows 2–4). Typical images captured at 5 seconds, 1 minute, and 2 minutes after MB administration are shown. The deconvolved images were then stacked to build a TIC for quantitative analysis. The postprocessed imaging parameters from the TIC indicated that the IMAX and mTT were significantly lower in VEGFR1 KD melanoma than in control melanoma (Figs. 7C, 7D). There was no significant difference in RT between the two groups (Fig. 7E). Therefore, the different enhancement generated in the two groups by VEGFR1 MB imaging suggests that VEGFR1 MBs were efficient in detecting and reflecting the different levels of VEGFR1+ VM vasculature in these models.
Tumor Immunofluorescence Staining after CEUS Imaging
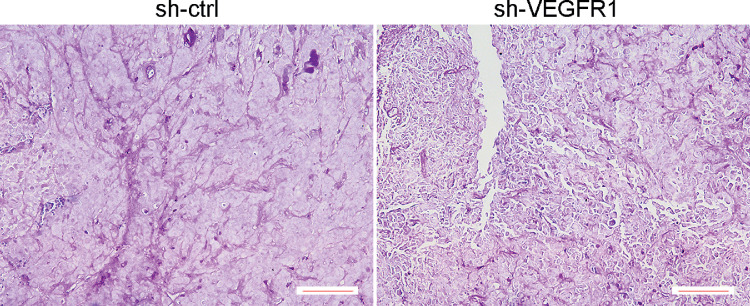
To further validate the molecular ultrasound signals from tumor VM perfusion, the tumors were harvested and subsequently analyzed. Patterned networks of VM expression were detected in tumors that formed from control melanoma and VEGFR1 shRNA-transfected melanoma. VM formation was inhibited in tumors that formed from VEGFR1 shRNA-transfected melanoma compared to in tumors that originated from controls (Fig. 8). PAS staining showed a vascular pattern and extensive blood-perfused channels that spread throughout the majority of the tumor sections in control melanoma. In contrast, VEGFR1 KD tumors contained a minimal level of VM channels. These data were consistent with VEGFR1-targeted CEUS findings (Figs. 6, 7). Therefore, the level of VM structure presented in melanoma could be quantitatively detected in vivo, and tumor VM microcirculation can be reasonably monitored by imaging VEGFR1-targeted CEUS.
Figure 8.
VEGFR1 KD slowed the growth of melanoma and decreased VM loops. Analysis of PAS+ VM loops in control and VEGFR1 KD melanoma at 3 weeks of growth. Control tumors are supplied by abundant mature PAS+ loops that are connected to one another (left) compared with VEGFR1 KD melanoma (right). Scale bars, 50 µm. (n. 3).
Discussions
Our study reveals several novel insights. First, VEGFR1 was found to be responsible for VM network formation in MUM-2B choroidal melanoma. Second, VEGFR1 expression is required for efficient choroidal melanoma tumor growth. Finally, this novel research applied VEGFR1-targeted MBs and contrast-enhanced ultrasound in vivo to evaluate the VM vasculature, which differs from general tumor blood vessels.
VM was first reported in uveal melanoma by Folberg et al. in 1993.15 It is a perusable, matrix-rich, vasculogenic-like network that is formed by various aggressive tumors.16 VM mainly serves as a blood perfusion pattern for rapidly growing tumors and an escape route for metastasis. We also reported abundant VM structures forming hollow PAS-positive regions for blood perfusion in choroidal melanoma tissues.2 Currently, one of the most compelling findings is that, when considered in most conventional therapies, VM is correlated with drug resistance and tumor metastasis.15,16 In addition, inherent or acquired resistance is a major challenge in antiangiogenic therapy. Individuals with cancers that have undergone VM have a poor prognosis.17 Thus, there is clearly a need for new targeting approaches based on robust molecular findings in VM for precise diagnosis and treatment.
In recent years, various angiogenesis-promoting factors have been found to be linked to VM in a variety of cancers. Some of molecules were initially identified as playing critical roles in mediating melanoma VM, such as VE-cadherin (a cell-cell adhesion molecule associated with endothelial cells), EphA2 (an epithelial cell-associated kinase involved in ephrin-A1), and MMPs.16,18 The expression of these VM-related factors is abundant in MUM-2B human choroidal melanoma in vitro and in vivo (Figs. 1, 2). However, the mechanism for the increased expression is not well understood.
In solid tumors, VEGFA/VEGFR1 signaling was specifically upregulated in hypoxia, events known to trigger tumor VM formation. VEGFR1 is necessary for the expression of VE-cadherin.18 Accordingly, studies have found that VEGFR1 is highly expressed in tumor cells with the capacity to form VM.4,5 Consistent with previous reports, in this study, VEGFR1 was shown to be highly expressed in MUM-2B human choroidal melanoma in vitro and in vivo (Figs. 1, 2). Importantly, the present study revealed that VEGFR1 signaling is a novel molecular mechanism responsible for MUM-2B melanoma-dependent VM production. Furthermore, our results showed that VEGFR1 knockdown inhibited tube formation by MUM-2B cells and tumor growth (Figs. 3, 4). Thus, functional VEGFR1 expression is required for both melanoma VM and rapid tumorigenic growth.
The clinical management of choroidal melanoma would benefit greatly from the identification of valid predictors of tumor progression and metastatic potential. Currently, fine needle aspiration biopsy (FNAB) and genomic testing have high diagnostic value in ocular melanoma and can be used to obtain tumor cells for characterizing molecular signatures or gene expression patterns.19,20 FNAB has been routinely recommended for uveal melanoma in some countries for individualized prognostication examinations. However, Correa and Augsburger argued that FNAB alone may be inadequate to obtain a representative volume of tumor tissue for vascular pattern analysis.21 These findings challenge our thinking of how to identify and target tumor microcirculation patterns in choroidal melanoma in vivo.
Microcirculation features provide crucial diagnostic and prognostic estimates for uveal melanoma with respect to tumor angiogenesis. Our team developed CEUS to effectively detect microcirculation patterns and quantify blood circulation volume and velocity in ocular melanoma.2 The quantitative analysis of CEUS provided further information for detecting differences in blood perfusion of two different choroidal melanomas. Currently, targeted CEUS, a molecular imaging method,22,23 is advantageous because it allows visualization and quantification of specific molecular markers expressed in diseased tissues, thereby facilitating noninvasive assessment of tumor development and proliferation. Targeted CEUS has been studied and applied in many types of tumors to detect the “premetastatic niche” of microcirculation and the microenvironment with different probes.24–26 However, targeted CEUS has not been studied for choroidal melanoma or targeting VM in aggressive tumors.
Previous studies and the results of this study indicate the eminent role of VEGFR1 in VM vasculature formation in MUM-2B choroidal melanoma. Additionally, as is known in the CEUS imaging process, MBs are restricted purely to the intravasculature. Therefore, specific targets for molecular imaging of angiogenesis or VM networks must be ideally expressed on the luminal surface of the MUM-2B melanoma cells according to the principles of choosing targets, as described previously.27 VEGFR1-targeted MBs were created by the conjugation of VEGFR1 antibodies to their surface. VEGFR1 and IgG MBs were easily constructed within 1 hour according to the manufacturer's instructions, and VEGFR1 MBs showed static binding specificity to MUM-2B melanoma cells in vivo (Fig. 5). These results qualify the use of VEGFR1 MBs for detecting ocular melanoma in vivo.
Targeted CEUS imaging with VEGFR1 MBs and IgG MBs was subsequently performed in an ocular melanoma animal model. First, we found that imaging with VEGFR1 MBs could accurately and clearly display lesion shape and could be used to effectively observe tumor-bearing vessels with higher temporal resolution than IgG MBs (Fig. 6). CEUS with VEGFR1 MBs quantitatively showed higher IMAX and mTT values than IgG MBs. This result suggests that CEUS imaging with VEGFR1 MBs strongly enhanced the sensitivity and wholeness of evaluations of microcirculation in ocular melanoma. Second, for more specific targeting, CEUS imaging with VEGFR1 MBs was applied in different melanomas with high or low expression of VEGFR1. CEUS with VEGFR1 MBs quantitatively showed lower IMAX and mTT values in VEGFR1 knockdown melanoma than in control melanoma (Fig. 7). This result suggests that the VEGFR1 KD melanoma had a smaller volume of blood than the control melanoma. Thus, CEUS imaging with VEGFR1 MBs strongly enhanced the specificity and accuracy of identifying microcirculation in ocular melanoma in the model. On the basis of contrast-mode detection methods, VM quantification could serve as a repeatable, non-invasive, well-tolerated, and real-time in vivo imaging technology for VM evaluation and follow-up. Depicting and quantifying the characteristics of the tumor VM may open up new ways to address the challenging and critical tasks of predicting and assessing therapeutic response.
This study showed that the microcirculation of ocular melanoma was mainly composed of VM channels (Fig. 8). A large number of patterned solid and hollow VM channels were observed in PAS-stained paraffin slides of MUM-2B ocular melanomas. Some of these channels permitted blood cells to pass through. However, the mean vessel density count, which is dependent on endothelial cells stained for CD31, is not fully representative of effective microcirculation. A new quantitative method is required for the VM vasculature. In this study, importantly, VEGFR1 KD melanoma presented smaller and slower blood perfusion in VEGFR1-targeted CEUS imaging and showed fewer VEGFR1+ VM loops in tissue histology. These findings suggest that VEGFR1-targeted CEUS could be a reliable method for detecting VM levels in an animal model of ocular melanoma in vivo.
Several limitations should be considered when interpreting our results. First, the sample sizes are relatively small. Second, the entire study was based on one melanoma cell line and an animal choroidal melanoma model. But, the growth pattern and development of choroidal melanoma may differ among different human choroidal melanoma cell lines. Further, CEUS data obtained from patients in the future will help greatly in determining the clinical applicability of our findings. Third, this study focused only on the molecular target of VEGFR1. Because CD144 (VE-cadherin)–EphA2 is an important VM-related signaling pathway, CD144 or EphA2 might also be targeted in VM formation, tumor growth, and CEUS imaging. Further studies are needed.
In summary, in this study, we successfully developed a mouse model of MUM-2B human ocular melanoma. MUM-2b human melanoma cells could form VM patterns for blood supply. VEGFR1 was found to be responsible for VM network formation and was required for efficient choroidal melanoma tumor growth in MUM-2B choroidal melanoma. Our findings suggest that targeted CEUS and TIC curve analyses have the potential to assist in quantitative monitoring of VM processes at the molecular level and more precise treatment efficacy in the future. More experiments are needed for other specific targets for molecular ultrasound imaging in VM microcirculation in tumors. Moreover, before clinical translation, the clinical-grade, molecularly targeted MBs have to be tested for safety, toxicity, side effects, and binding specificity for the intended clinical application. Further studies in various tumors are needed.
Acknowledgments
This work was supported by the National Science Fund for Distinguished Young Scholars (81425006), National Science Fund (81730026), Science and Technology Commission of Shanghai Municipality (17411953000), and Shen Kang Hospital Development Center of Shanghai (SHDC12016105)
HL and MG contributed equally to this work.
Disclosure: H. Liu, None; M. Gao, None; J. Gu, None; X. Wan, None; H. Wang, None; Q. Gu, None; Y. Zhou, None; X. Sun, None
References
- 1. Damato B. Ocular treatment of choroidal melanoma in relation to the prevention of metastatic death - a personal view. Prog Retin Eye Res. 2018; 66: 187–199. [DOI] [PubMed] [Google Scholar]
- 2. Hendrix MJ, Seftor EA, Hess AR, Seftor RE. Vasculogenic mimicry and tumour-cell plasticity: lessons from melanoma. Nat Rev Cancer. 2003; 3: 411–421. [DOI] [PubMed] [Google Scholar]
- 3. Gao M, Tang J, Liu K, Yang M, Liu H. Quantitative evaluation of vascular microcirculation using contrast-enhanced ultrasound imaging in rabbit models of choroidal melanoma. Invest Ophthalmol Vis Sci. 2018; 59: 1251–1262. [DOI] [PubMed] [Google Scholar]
- 4. Vartanian A, Stepanova E, Grigorieva I, Solomko E, Baryshnikov A, Lichinitser M. VEGFR1 and PKCα signaling control melanoma vasculogenic mimicry in a VEGFR2 kinase-independent manner. Melanoma Res. 2011; 21: 91–98. [DOI] [PubMed] [Google Scholar]
- 5. Frank NY, Schatton T, Kim S, et al.. VEGFR-1 expressed by malignant melanoma-initiating cells is required for tumor growth. Cancer Res. 2011; 71: 1474–1485. [DOI] [PMC free article] [PubMed] [Google Scholar]
- 6. Dietrich CF. Comments and illustrations regarding the guidelines and good clinical practice recommendations for contrast-enhanced ultrasound (CEUS)–update 2008. Ultraschall Med. 2008; 29: 188–202. [DOI] [PubMed] [Google Scholar]
- 7. Piscaglia F, Nolsøe C, Dietrich CF et al. . The EFSUMB Guidelines and Recommendations on the Clinical Practice of Contrast Enhanced Ultrasound (CEUS): update 2011 on non-hepatic applications. Ultraschall Med. 2012; 33: 33–59. [DOI] [PubMed] [Google Scholar]
- 8. Moestue SA, Gribbestad IS, Hansen R. Intravascular targets for molecular contrast-enhanced ultrasound imaging. Int J Mol Sci. 2012; 13: 6679–6697. [DOI] [PMC free article] [PubMed] [Google Scholar]
- 9. Matsumoto H, Miller JW, Vavvas DG. Retinal detachment model in rodents by subretinal injection of sodium hyaluronate. Journal of Visualized Experiments. 2013; 79: 1–5. [DOI] [PMC free article] [PubMed] [Google Scholar]
- 10. Francescone RA, Faibish M, Shao R. A Matrigel-based tube formation assay to assess the vasculogenic activity of tumor cells. J Vis Exp. 2011; 7: 1–4. [DOI] [PMC free article] [PubMed] [Google Scholar]
- 11. Pineda R, Theodossiadis PG, Gonzalez VH et al. . Establishment of a rabbit model of extrascleral extension of ocular melanoma. Retina. 1998; 18: 368–372. [DOI] [PubMed] [Google Scholar]
- 12. Mueller AJ, Folberg R, Freeman WR et al. . Evaluation of the human choroidal melanoma rabbit model for studying microcirculation patterns with confocal ICG and histology. Exp Eye Res. 1999; 68: 671–678. [DOI] [PubMed] [Google Scholar]
- 13. Francescone R, Scully S, Bentley B et al. . Glioblastoma-derived tumor cells induce vasculogenic mimicry through Flk-1 protein activation. J Biol Chem. 2012; 287: 24821–24831. [DOI] [PMC free article] [PubMed] [Google Scholar]
- 14. Qiao L, Liang N, Zhang J et al. . Advanced research on vasculogenic mimicry in cancer. J Cell Mol Med. 2015; 19: 315–326. [DOI] [PMC free article] [PubMed] [Google Scholar]
- 15. Folberg R, Rummelt V, Parys-Van Ginderdeuren R et al. . The prognostic value of tumor blood vessel morphology in primary uveal melanoma. Ophthalmology. 1993; 100: 1389–1398. [DOI] [PubMed] [Google Scholar]
- 16. Hendrix MJ, Seftor EA, Seftor RE, Chao JT, Chien DS, Chu YW. Tumor cell vascular mimicry: novel targeting opportunity in melanoma. Pharmacol Ther. 2016; 159: 83–92. [DOI] [PMC free article] [PubMed] [Google Scholar]
- 17. Cao Z, Bao M, Miele L, Sarkar FH, Wang Z, Zhou Q. Tumour vasculogenic mimicry is associated with poor prognosis of human cancer patients: a systemic review and meta-analysis. Eur J Cancer. 2013; 49: 3914–3923. [DOI] [PubMed] [Google Scholar]
- 18. Delgado-Bellido D, Serrano-Saenz S, Fernández-Cortés M, Oliver FJ. Vasculogenic mimicry signaling revisited: focus on non-vascular VE-cadherin. Mol Cancer. 2017; 16: 65. [DOI] [PMC free article] [PubMed] [Google Scholar]
- 19. McCannel TA, Chang MY, Burgess BL. Multiyear follow-up of fine-needle aspiration biopsy in choroidal melanoma. Ophthalmology. 2012; 119: 606–610. [DOI] [PubMed] [Google Scholar]
- 20. Roche MI, Berg JS. Incidental findings with genomic testing: implications for genetic counseling practice. Curr Genet Med Rep. 2015; 3: 166–176. [DOI] [PMC free article] [PubMed] [Google Scholar]
- 21. Correa ZM, Augsburger JJ. Sufficiency of FNAB aspirates of posterior uveal melanoma for cytologic versus GEP classification in 159 patients, and relative prognostic significance of these classifications. Graefes Arch Clin Exp Ophthalmol. 2014; 252: 131–135. [DOI] [PMC free article] [PubMed] [Google Scholar]
- 22. Zhou Z, Lu ZR.. Molecular imaging of the tumor microenvironment. Adv Drug Deliv Rev. 2017; 113: 24–48. [DOI] [PubMed] [Google Scholar]
- 23. Lu ZR, Minko T. Molecular imaging for precision medicine. Adv Drug Deliv Rev. 2017; 113: 1–2. [DOI] [PubMed] [Google Scholar]
- 24. Anderson CR, Hu XW, Zhang H et al.. Ultrasound molecular imaging of tumor angiogenesis with an integrin targeted microbubble contrast agent. Investig. Radiol. 2011; 46: 215–224. [DOI] [PMC free article] [PubMed] [Google Scholar]
- 25. Anderson CR, Rychak JJ, Backer M, Backer J, Ley K, Klibanov AL. scVEGF microbubble ultrasound contrast agents: a novel probe for ultrasound molecular imaging of tumor angiogenesis. Invest Radiol. 2010; 45: 79–85. [DOI] [PMC free article] [PubMed] [Google Scholar]
- 26. Baetke SC, Rix A, Tranquart F, et al. Squamous cell carcinoma xenografts: use of VEGFR2-targeted microbubbles for combined functional and molecular US to monitor antiangiogenic therapy effects. Radiology. 2016; 278: 430–440. [DOI] [PMC free article] [PubMed] [Google Scholar]
- 27. Leong-Poi H. Molecular imaging using contrast-enhanced ultrasound: evaluation of angiogenesis and cell therapy. Cardiovasc Res. 2009; 84: 190–200. [DOI] [PubMed] [Google Scholar]


