Abstract
Recently, electromyometrial imaging (EMMI) was developed to non-invasively image uterine contractions in three dimensions. EMMI collects body surface electromyography (EMG) measurements and uses patient-specific body-uterus geometry generated from magnetic resonance images to reconstruct uterine electrical activity. Currently, EMMI uses the zero-order Tikhonov method with mean composite residual and smoothing operator (CRESO) to stabilize the underlying ill-posed inverse computation. However, this method is empirical and implements a global regularization parameter over all uterine sites, which is sub-optimal for EMMI given the severe eccentricity of body-uterus geometry. To address this limitation, we developed a spatial-dependent (SP) regularization method that considers both body-uterus eccentricity and EMG noise. We used electrical signals simulated with spherical and realistic geometry models to compare the reconstruction accuracy of the SP method to those of the CRESO and the L-Curve methods. The SP method reconstructed electrograms and potential maps more accurately than the other methods, especially in cases of high eccentricity and noise contamination. Thus, the SP method should facilitate clinical use of EMMI and can be used to improve the accuracy of other electrical imaging modalities, such as Electrocardiographic Imaging.
Keywords: Inverse problem, Regularization, Electromyometrial imaging
Graphical abstract
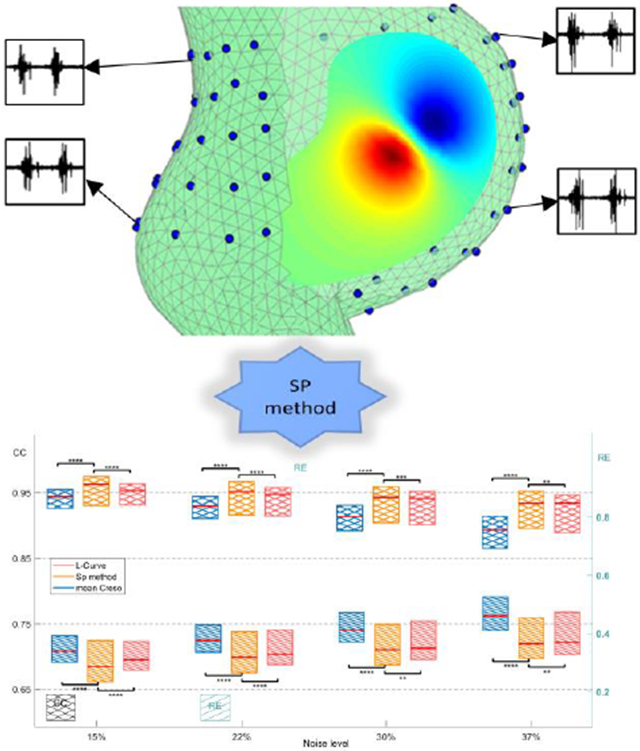
The spatial-dependent regularization (SP) technique was designed to improve the accuracy of Electromyometrial Imaging (EMMI). The top panel shows the eccentricity of body-uterus geometry and four representative body surface electrograms. The bottom panel shows boxplots of correlation coefficients and relative errors for the electrograms reconstructed with SP and two conventional methods, the L-Curve and mean CRESO methods.
1. Introduction
Proper timing and force of uterine contractions, which are driven by uterine smooth muscle (myometrial) activity, are necessary for successful term delivery of an infant. Several methods have been developed to clinically monitor uterine contractions, such as tocodynamometers, which measure body surface contour displacements caused by uterine contractions, and intrauterine pressure catheters. However, the latter method is invasive and poses maternal and neonatal risks [19], and neither method can assess uterine contractility at high spatial and temporal resolution [10]. In a non-clinical method, electromyography (EMG), 4 to 64 electrodes are placed on a small region (around 4 cm by 4 cm) of the body surface and used to monitor myometrial electrical activity [13, 28]. EMG signals are the spatial integral of action potentials from all of the myometrial cells [8, 36]. Although EMG-measured electrical signals can distinguish between term and preterm labor [12, 22, 31, 32], EMG cannot provide sufficient spatial resolution and coverage to reflect the detailed uterine electrophysiological patterns during contractions. Thus, we cannot answer basic questions such as where uterine contractions initiate, whether they always propagate in the same manner and speed, how contractions in different uterine regions correlate with one another, and what differentiates productive preterm contractions (leading to preterm labor and delivery) from non-productive preterm contractions.
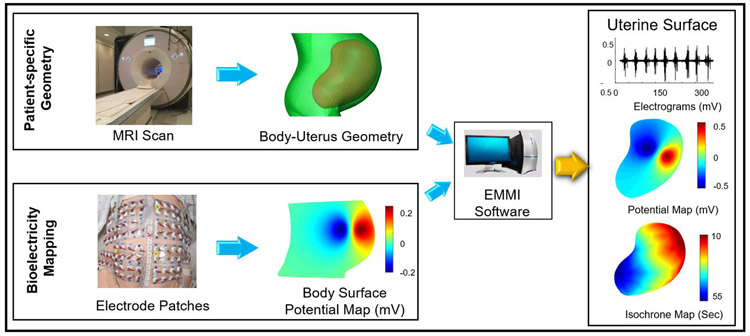
To address the limited spatial resolution and coverage of EMG, we recently developed electromyometrial imaging (EMMI) [28]. In EMMI, a subject wearing magnetic resonance imaging (MRI) markers first undergoes MRI to derive a body-uterus geometry (Figure 1). Then, when the subject is in labor, up to 256 electrodes are placed on the body surface in the same positions as the MRI markers and used to measure EMG and generate body surface potential maps. Next, EMMI software solves an inverse problem (the Cauchy problem, see section 2.1 for details) to combine the subject-specific body-uterus geometry with the measured body surface EMG signals and thus reconstruct uterine surface electrical potentials. EMMI is based on a similar method used to monitor heart activity, electrocardiographic imaging (ECGI) [5, 7, 27, 35].
Fig. 1. Schematic of EMMI system.
Top left, a patient-specific body-uterus geometry is obtained and segmented from an MRI scan while the patient is wearing up to 256 MRI-compatible markers. Lower left, body surface potentials are recorded from up to 256 pin-type unipolar electrode patches placed in positions corresponding to the MRI-compatible markers. Middle, EMMI software combines the two data sets to reconstruct uterine surface (top right) electrograms (electrical waveforms over time at each uterine site) and (middle right) potential maps (electrical activity across the uterus at a single time point). (Lower right) Activation times can be derived from the electrograms to construct isochrone maps. EMMI software is an in-house developed MATLAB package able to solve the inverse problem.
Because the inverse reconstruction procedure underlying both EMMI and ECGI is ill-posed, a small amount of noise in the measured body surface electrical signals could cause large errors in the reconstructed electrical signals on the uterine or heart surface. To stabilize the inverse computation underlying ECGI, several regularization methods have been proposed [9, 20, 21, 25]. The most widely used is the zero-order Tikhonov (ZOT) regularization method, with composite residual and smoothing operator (CRESO) determining a global regularization parameter, λ, which is applied to all sites on the heart [5, 7, 35]. This method is also used in EMMI [37]. However, because the same λ is applied to all heart/uterine sites, under-regularization could occur for some sites, and over-regularization could occur for other sites, impairing reconstruction accuracy. For example, Oster et al. [26] used a spherical geometry model to show that, in ECGI, optimal λ will differ depending on the distance between a site on the heart surface and the nearest body surface site. This under- and over-regularization is likely a more severe problem for EMMI than for ECGI because the uterus is farther from the center of the body along the anterior-posterior axis than is the heart.
One approach to solving this problem is to use λ optimized for each uterine site. However, no methods have been developed to compute site-dependent λ. Here, we developed and tested a spatial-dependent (SP) method to compute site-specific λSP for EMMI. We first developed the SP method by using COMSOL Multiphysics to build a detailed numerical simulation of the body-uterus geometry and electrical activities. Next, we compared the reconstruction accuracy of the SP, mean CRESO, and L-Curve regularization methods on both spherical and realistic body-uterus geometries. We show that the SP method produces more accurate EMMI reconstructions than the CRESO or L-Curve methods.
2. Materials and Methods
This section is organized as three subsections. Section 2.1 describes the biophysical model underlying EMMI, conventional regularization methods, and the SP regularization method for solving the biophysical model. Section 2.2 describes the geometry and physics setups for the numerical simulation. Section 2.3 describes the quantitative parameters used to compare the accuracy of each method, and the statistical test implemented to assess the significance of the differences.
2.1. The Inverse Problem
2.1.1. Zero-order Tikhonov regularization method
EMMI reconstructs uterine surface potential maps (USPMs) during uterine contractions by combining the body surface potential maps (BSPMs) and subject-specific body-uterus geometry segmented from MR images. Assuming that the body-uterus volume conductor is homogenous, isotropic, contains no primary electrical sources, and has no inductive effects (quasi-static condition), the basic mathematical formulation underlying this inverse problem can be described by Laplace's equation in three-dimensional space (equation 1), and two types of boundary conditions on the body surface (equations 2, 3).
| (1) |
| (2) |
| (3) |
ΓB represents the body surface, ϕB(x) is the electrical potential on the body surface at location x, and n denotes the normal to the boundary of ΓB. σΩUB is the conductivity of the volume between the uterine surface and the body surface, ΩUB, and is assumed to be homogeneous [7, 27, 35]. Because the conductivity of air is zero, the right side of equation (3) can be simplified to zero.
According to Green's theorem, (equations 1, 2, and 3) can be discretized by the boundary element method [2, 5, 15, 30]. As shown in equation (4), BSPM, ϕB, and USPM, ϕU, are associated by transfer matrix A, which encodes the patient-specific body-uterus geometry.
| (4) |
Because transfer matrix A is numerically ill-conditioned, the inverse problem cannot be solved by directly inverting matrix A. A well-established technique for such cases is the zero-order Tikhonov (ZOT) regularization method [1], which solves a least-square problem with an L2 norm regularization term, shown as equation (5), where λ is a positive scalar regularization parameter.
| (5) |
In the ZOT regularization method, a singular value decomposition (SVD, equation 6) is implemented.
| (6) |
where U is an M × M matrix with columns that are singular vectors spanning the data space ϕB, and X is an N × N matrix with columns that are singular vectors spanning the model space ϕU. M and N represent the numbers of body and uterine surface sites, respectively. Σ is a diagonal matrix of singular values σi, where σ1 ≥ σ2 ≥ ⋯ ≥ 0 and i = 1, 2, ⋯ , σZ, Z = min(M, N).
The inverse solution of the ZOT method is represented by SVD components [1] shown as equation (7).
| (7) |
where λ is the ZOT regularization parameter, Z is the number of non-zero singular values, and i indicates the ith singular value. U.,i represents the ith singular vector of matrix U, which is correlated with σi. Similarly, X.,i represents the ith singular vector of matrix X. We define di as a decomposition of the body surface potential ϕB onto singular vectors of U, shown in equation (8).
| (8) |
Substituting equation (8) into equation (7),
| (9) |
2.1.2. Conventional methods to determine the regularization parameter, λ
In equation (9), ϕU can be regarded as the linear weighted summation of the singular vectors X.,i, i = 1, 2, … , Z, where the linear coefficients are determined by di and σi. The two values are derived from SVD components and body surface measurements. The CRESO and L-Curve methods are widely used empirical method to determine the λ for ZOT regularization in ECGI [5, 7, 35]. The L-Curve method [18] locates the "corner" of the L-shaped curve and indicates the relationship between the norm of ϕU and the norm of residual AϕU – ϕB in a log-log plot with λ as a variable. The CRESO method [11] aims to determine the positive λ value that results in the maximum of function C(λ) shown in equation (10). Substituting the ZOT solution of ϕU, equation (9), into equation (10), the numerical expression can be derived as equation (11).
| (10) |
| (11) |
2.1.3. Spatial dependent (SP) method to determine λSP
In general, λSP is determined by body-uterus geometry G and the body surface potential maps ϕB (equation 12). Based on the SVD (equation 9), the inverse solution of the SP method was formulated as equation 13, where λk is the SP regularization parameter associated with the kth uterine site, and Z is the number of non-zero singular values.
| (12) |
| (13) |
k = 1, 2, … , N, where N is the number of uterine sites; gk is the index of the singular vector, and gk ∈ (1, Z = min(M, N)); G represents the body-uterus geometry, which is denoted by XYZ coordinates and the triangular connectivity of each coordinate; ϕB represents the body surface potential map.
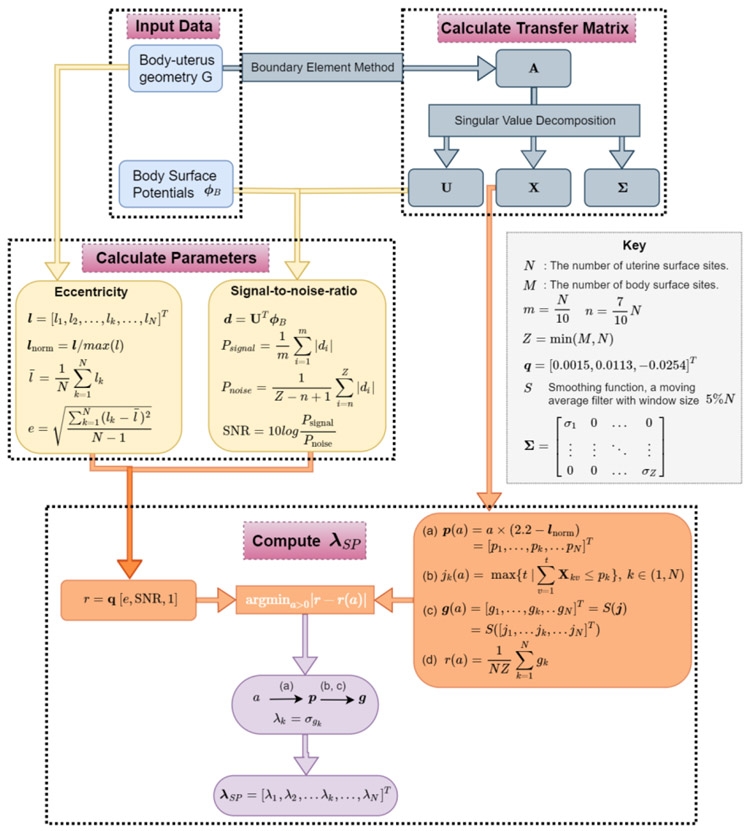
The function f represents the computation process as described in Figure 2. After acquiring the body-uterus geometry and body surface potentials, λSP is generated in three steps. Step 1 is to calculate the transfer matrix A (equation (4)) and its singular value decompositions (U, X, Σ, equation (6)) from the body-uterus geometry G. Step 2 is to calculate the two parameters eccentricity and signal-to-noise ratio (SNR). l represents the distances from uterine sites to their nearest body surface sites. lnorm represents the normalized vector by the maximum l value, and represents the average of l vectors. e represents the eccentricity of the body-uterus geometry, which is defined by the standard deviation of l vectors. The SNR for each ϕB is defined by the ratio between the mean absolute value of the first 10% and the last 30% of d, based on the discrete picard condition for the inverse problem [17] (See details in supplementary mater). Step 3 is to calculate λSP by using e, SNR, lnorm, X, and Σ derived from the first two steps. The level threshold function p(a) is a function of variable a and the normalized nearest distance vector lnorm. For each a, the jk(a) is defined as the maximum index of singular basis satisfying in equation (b). Then in equation (c), g(a) is computed by smoothing j by using a moving average filter with window size equal to 5% of the uterine sites. g(a) is the optimized index of singular vector basis for λSP, shown as equation (11). The under-curve ratio r(a) is defined as the ratio between the area under the curve of g(a) over the total area (= NZ) of cumulative X. r is determined by e and SNR with the estimation model r = q [e, SNR, 1]. The optimized a can be computed by minimizing the difference between r(a) and r, and then the optimized p and g are derived. Finally, the λSP for each uterine site is computed. After λSP is derived, the inverse solution can be calculated according to equation (13). Please see the supplemental materials for details regarding derivation of the level threshold function p(a) and estimation model r.
Fig.2. Flowchart of the derivation of λSP.
Body-uterus geometry (G) and body surface potentials (ϕB) are shown in the blue boxes at the top left. Transfer matrix A and its singular value decompositions are shown in the grey boxes at the top right. The eccentricity (e) and signal-to-noise-ratio (SNR) are defined and shown in the yellow boxes. M, N, m, n, and Z are defined in the key. The procedure to calculate λSP by minimizing a cost function is shown in the orange boxes. The level threshold function p(a) as a function of unknown variable a is described in equation (a). jk(a) represents the maximum index t of singular basis corresponding to variable a, where in equation (b). g(a) is derived by applying a moving average filter to j, and this process is denoted by S(j) in equation (c). The under-curve ratio r(a) is defined as the ratio between the area under the curve of g(a) and the total area (= NZ) of cumulative X in equation (d). r = q [e, SNR, 1]. By minimizing the difference between r(a) and r, an optimized a can be computed, which can be used compute p, g, λk, and λSP.
2.2. Bio-electricity Simulation
2.2.1. Geometries setup
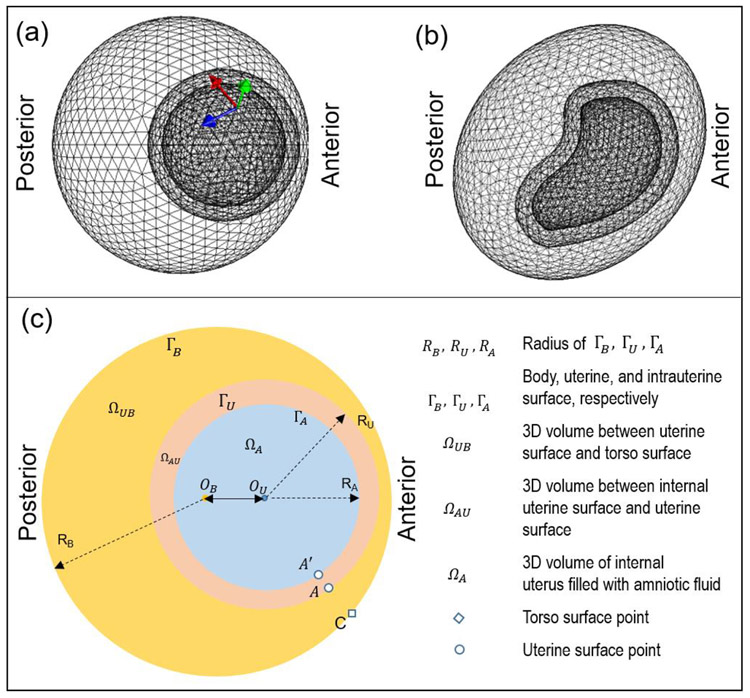
We modeled a three-layer spherical geometry (Figure 3a), in which the inner-most, middle, and outer layers represented the intrauterine space, myometrium, and body surface, respectively. The radius of each layer was based on the average size of a pregnant woman at nine months' gestation [38] (Table 1). To validate the SP method, we used a non-spherical uterus geometry, RPI-9 (Figure 3b) developed by the Rensselaer Polytechnic Institute as a model of a pregnant woman at nine months' gestation [38]. To simplify the bio-electric simulation and generate a closed-shape body surface geometry, an ellipsoid with similar size as the abdominal and lower-back surface of the nine-months pregnant female was set as the body surface (Figure 3b). In both geometries, the intrauterine surface was derived by shrinking the uterine surface by mm along the normal direction. We defined 900 uterine sites and represented the uterine surface with a mesh containing 1796 triangles. We defined 1400 body surface sites and represented the body surface with a mesh containing 2800 triangles (see details in Table 1). Anterior uterine sites (large index) are closer to the body surface, and posterior uterine sites (small index) are farther from the body surface.
Fig. 3. Geometry and physics settings of bioelectric simulation.
a, three-layer spherical geometry. Arrows represent the three orthogonal dipole directions: normal direction (green arrow), and two horizontal directions (red and blue). b, three-layer RPI geometry. c, schematic of bio-electricity simulation setting with three volume conductors, ΩUB, ΩAU, and ΩA. OB and OU represent the centers of the body surface and uterine surface, respectively. RB, RU, and RA represent the radius of the three spherical geometries. A dipole was placed on the intrauterine surface, ΓA. The body surface point C is nearest to uterine point A. All images are right lateral views.
Table 1.
Bio-electricity Simulation Parameters [41]
| Parameter | Value | ||
|---|---|---|---|
| Geometry Setting | Radius | RA | 13 cm |
| RU | 16 cm | ||
| RB | 27 cm | ||
| dis(OU, OB) | 9 cm | ||
| Mesh | Number of uterine surface sites, N | 900 | |
| Number of uterine surface triangles | 1796 | ||
| Number of body surface sites, M | 1400 | ||
| Number of body surface triangles | 2800 | ||
| Number of tetrahedrons in COMSOL | 73890 | ||
| Conductivity Setting | Conductivity | σΩA | 0.5 S/m |
| σΩAU | 1.74 S/m | ||
| σΩUB | 0.2 S/m | ||
2.2.2. Physics setup
The volumes and surfaces of body-uterus geometry are shown in a two-dimensional schematic (Figure 3c). ΩUB represents the volume conductor between the body surface and the uterine surface with conductivity σΩUB. ΩAU represents the volume conductor of the myometrium with conductivity σΩAU. ΩA represents the volume conductor of the amniotic fluid with conductivity σΩA. ΓB and ΓU represent body and uterine surfaces, respectively. Table 1 lists the conductivity values for each volume space. Similar to the electrical activity preceding cardiac contractions [3, 27], the electrical activity preceding uterine contractions can be represented by current dipoles. The current dipole was placed at the intrauterine surface ΓA to simulate local myometrial contractions. The current dipole directions (constant magnitude, Table 2) were set along normal direction of the intrauterine surface as well as the other two tangent directions at each intrauterine site (arrows in Figure 3a). Because we defined 900 uterine sites, 2700 frames of BSPMs and USPMs were generated. At each uterine site and body surface site, we generated a time series of potential values with length 2700. Each time series was defined as the simulated electrogram at the respective site. To simulate complex uterine contractions, multiple current dipoles with random tangent directions were placed at random locations on the intrauterine surface ΓA. The magnitudes of the dipoles changed as a sine wave with frequency 0.5 Hz (Table 2), which is the mean frequency of uterine contractions during active labor [13]. In total, 100 BSPMs and USPMs were generated with a duration of 5 second for the complex uterine contractions. To model measurement noise, white Gaussian noise was added to the simulated BSPMs. Simulated USPMs were considered the ground truth for the reconstructed USPMs. COMSOL multiphysics finite element modeling software (COMSOL Multiphysics, version 5.3a) was used to implement this simulation. Table 2 lists the detailed information for physics setups.
Table 2.
Bio-electricity Simulation Equations
| Current conservation | ∇ · J = Qj,ν | |
| J = σE + Je, ΩA,ΩUB,ΩAU | ||
| E = −∇V | ||
| Electrical insulation | n · J = 0, ΓB | |
| Single current dipole | Magnitude | p = 10−5 A · m |
| Direction | Normal, horizontals (2) | |
| Position | Each site on intrauterine surface | |
| Multiple current dipoles | Magnitude | p = 10−5sin(2πft) A · m |
| Frequency | f = 0.5 Hz | |
| Sampling rate | Fs = 10 Hz | |
| Direction | Random horizontal | |
| Position | Radom site on intrauterine surface |
2.3. Statistical analysis
To quantitatively evaluate the accuracy of inverse reconstructions, uterine electrograms and potential maps were reconstructed with CRESO, L-Curve, or SP methods and then compared with the ground truth to generate correlation coefficients (CC) and relative error (RE), which are defined as follows:
| (14) |
| (15) |
For electrograms, n denotes the number of time frames within the electrograms. and are the ith time frame of true and reconstructed uterine potentials, respectively. and are the average true and reconstructed, respectively, uterine potentials over all time frames. For potential maps, n is the number of uterine surface sites. and are the true and reconstructed, respectively, uterine potentials at the ith uterine site. and are the average true and reconstructed, respectively, uterine potentials over all uterine sites. A CC value close to 1 indicates high morphology similarity, and a RE value close to 0 indicates low magnitude error.
We used the CRESO, L-Curve, and SP methods to reconstruct USPMs form the simulated BSPMs with spherical and RPI geometries, and then compared the reconstruction accuracies (CCs and REs) of the three methods. Statistical significance of differences (P-value) was determined with one-tailed Wilcoxon rank-sum tests in R studio [33].
3. Results
3.1. Spatial dependence of optimal regularization parameter
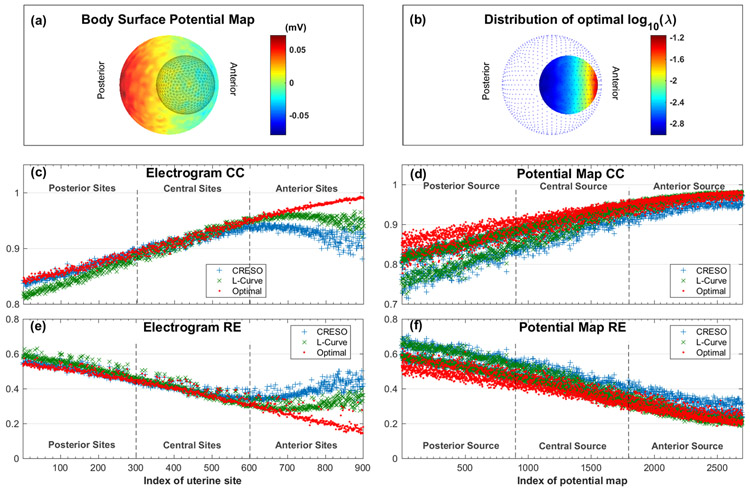
To confirm that the optimal regularization parameter is spatially dependent, we used pairs of body surface potential maps (BSPMs) and uterine surface potential maps (USPMs) simulated from a three-layer spherical geometry and a single current dipole (See supplementary material for the definition of the optimal regularization parameter). The BSPMs were contaminated with white Gaussian noise with average peak-to-peak magnitude of 44 microvolts (15% of the signal). Figure 4a shows one representative BSPM, represented as a heat map in which warm colors denote positive potentials and cool colors denote negative potentials. We then used the optimal λ, CRESO, and L-Curve methods to reconstruct USPMs from the noise-contaminated BSPMs. Optimal λ values were large at anterior uterine sites and small at posterior uterine sites (Figure 4b).
Fig. 4. Reconstruction accuracy of electrograms and potential maps for spherical geometry.
a, a representative body surface potential map, where warm colors indicate positive potential and cool colors indicate negative potential. Black mesh inside the color map is the uterine surface geometry. b, Distribution of the optimal site-specific λ. Blue dots are discrete points on the simulated body surface. a and b both show right lateral views. c, reconstructed electrogram correlation coefficient (CC). d, reconstructed potential map CC. e, reconstructed electrogram relative error (RE). f, reconstructed potential map RE. In c, d, e, and f, red indicates optimal λ, blue indicates mean CRESO λ, and green indicates L-Curve λ. Uterine sites with index of 1~300 are located at the posterior, and sites with index of 601~900 are located at the anterior. Potential maps with index of 1~900 are correlated with posterior current dipole source, and index 1801~2700 are correlated with anterior current dipole source. The average peak-to-peak white Gaussian noise is 44 microvolts, which is 15% of the signal.
Figure 4c,e show the electrogram morphology accuracy (CC) and magnitude error (RE) of each uterine electrogram (sample size = 900) reconstructed with the three regularization parameters. The optimally reconstructed electrograms had higher CC and lower RE than those constructed with the CRESO or L-curve methods. This was especially true for the electrograms at the anterior uterine surface (uterine sites with index > 600). To quantitively evaluate the superiority of the optimal λ, a one-tail Wilcoxon rank-sum test was conducted with the null hypothesis that the electrogram accuracy (CC or RE) calculated with the CRESO or L-Curve methods were equal to that calculated with optimal λ. The null hypothesis was rejected (P < 10−5) for all four comparisons (electrogram CC, optimal vs. CRESO; electrogram RE, optimal vs. CRESO; electrogram CC, optimal vs. L-Curve; electrogram RE, optimal vs. L-Curve).
Figure 4d,f show the CC and RE of each USPM (sample size = 2700) reconstructed with the three regularization parameters. The optimally reconstructed potential maps had higher CC and lower RE than those reconstructed with the CRESO or L-Curve methods, especially those associated with posterior sources (potential maps with index < 900). Moreover, one-tail Wilcoxon rank-sum tests confirmed that the CC and RE values of potential maps were all significantly different (P < 10−5) between optimal λ and the CRESO and L-Curve methods.
3.2. Comparison of reconstruction accuracies in multiple spherical geometries and various noise contaminations
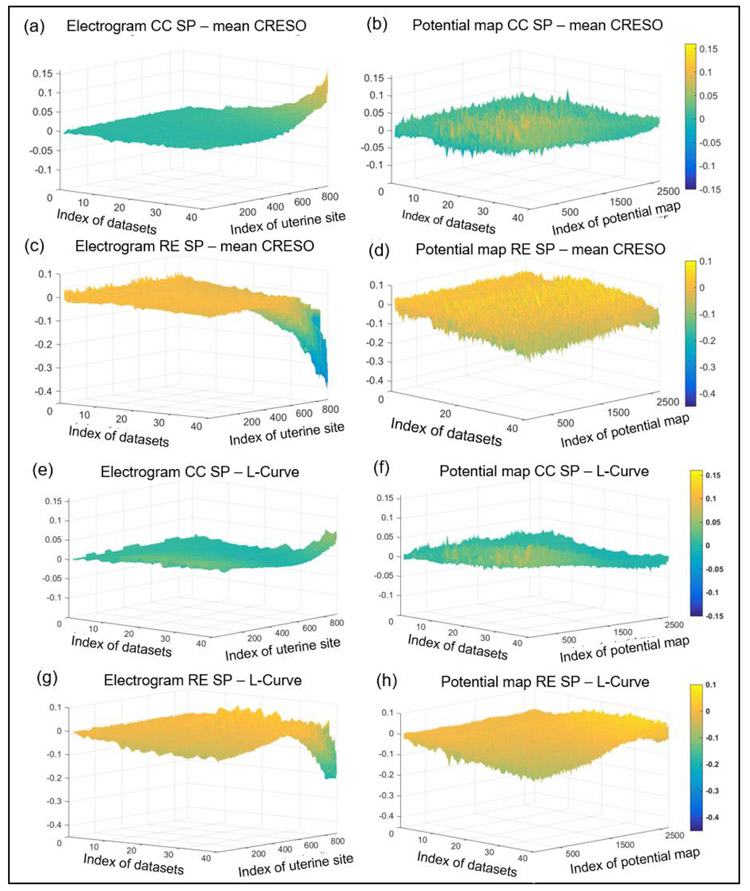
We calculated λSP values according to the procedures shown in Figure 2 and evaluated the performance of the SP, mean CRESO, and L-Curve methods on reconstructing electrograms and potential maps with simulated BSPMs from spherical geometries. We considered 40 eccentricity (0.29 mm to 48.73 mm) and noise contamination settings (SNR 21 dB to 9 dB) (See data file S2 for details). To compare the performance of the three methods, we first calculated the CC and RE values between the reconstructed electrograms and potential maps and the simulated electrograms and potential maps. Then, we calculated the difference of reconstruction accuracies between mean CRESO and SP methods (Figure 5a - d), and between the L-Curve and SP methods (Figure 5e - h) for each dataset. These differences were rendered to a surface plot in Figure 5. The datasets were sorted by geometry eccentricity and noise level, and a larger index corresponded to large eccentricity and high noise level (See data file S2). The reconstructed electrogram accuracies of the three methods were similar at low eccentricity and low noise level. However, at large eccentricity and high noise levels, the SP method was superior to the mean CRESO and L-Curve methods, especially at anterior uterine sites (index >600). The largest differences of electrogram CC and RE between the SP and mean CRESO methods were 0.15 and 0.4, respectively (Figure 5a,c). The largest differences of electrogram CC and RE between the SP and L-Curve methods were 0.07 and 0.2, respectively (Figure 5e,h). The potential maps reconstructed with the SP method were slightly more accurate than those generated with the other two methods (Figure 5b,d,f,h).
Fig. 5. Reconstruction accuracy of electrograms and potential maps using different regularization methods for multiple spherical geometry settings and noise levels.
a – d, CC and RE values of electrograms and potential maps generated by the mean CRESO method subtracted from the CC and RE values of electrograms and potential maps generated by the SP method. e - h, CC and RE values of electrograms and potential maps generated by the L-Curve method subtracted from the CC and RE values of electrograms and potential maps generated by the SP method. In all graphs, warm colors represent positive differences and cold colors represent negative differences. X-axis, index of datasets; Y-axis, index of uterine site or potential map; Z-axis, difference in values. The datasets were sorted by geometry eccentricity and noise level, and a large index means large eccentricity and high noise level (See data file S2).
3.3. Comparison of reconstruction accuracy in RPI geometry
3.3.1. Single current dipole
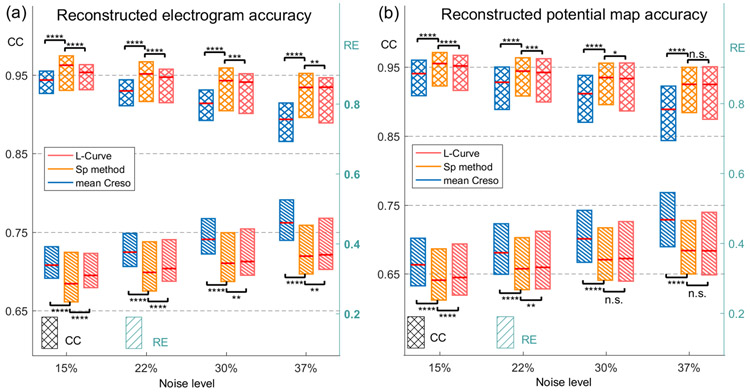
We simulated BSPMs with the three-layer RPI geometry (Figure 3b) and single current dipoles. Four levels of white Gaussian noise were added to BSPMs, with average peak-to-peak magnitudes 15%, 22%, 30%, and 37% of the signal. We calculated λSP values according to the procedures shown in Figure 2, used them to reconstruct uterine potentials, and compared the accuracy of the SP method to that of the mean CRESO and L-Curve methods. The median, first quartile, and third quartile of CC and RE values of reconstructions with the three methods under different levels of noise contamination are shown in Figure 6.
Fig. 6. Comparison of reconstruction accuracy of three regularization methods under RPI Geometry with single current dipole.
a. reconstructed electrogram accuracy of λSP, mean CRESO λ, and L-Curve λ. b, reconstructed potential map accuracy of λSP, mean CRESO λ, and L-Curve λ. Cross boxes indicate CC values and striped boxes indicate RE values. Blue, orange, and pink represent mean CRESO method, SP method, and L-Curve method, respectively. n.s., not significant, * P < 0.05, ** P < 10−2, *** P < 10−3, **** P < 10−4, compared to SP method.
To assess the performance of the three methods, a one-tail Wilcoxon rank-sum test was applied between SP and mean CRESO methods, and between SP and L-Curve methods. The electrograms (sample size = 900)were reconstructed significantly more accurately (P < 10−4) with λSP than with the mean CRESO method at all four noise levels. Moreover, at 15% and 37% noise, the median CCs of SP-reconstructed electrograms were 2% and 4.5%, respectively, higher than those of CRESO reconstructions, and the median REs of SP-reconstructed electrograms were 15.7% and 20.8%, respectively, lower than those of CRESO reconstructions. Electrograms generated with the SP method were significantly (P < 10−2) more accurate than those generated with the L-Curve method.
Potential maps (sample size = 2700) were also reconstructed significantly more accurately (P < 10−4) with λSP than with the mean CRESO method at all four noise levels. The median CCs of SP-reconstructed potential maps were 1.5% and 4.1% higher, respectively, than those of CRESO reconstructions, and the median REs of SP-reconstructed potential maps were 13% and 18.9%, respectively, lower than those of CRESO reconstructions. The accuracy of potential maps reconstructed with the SP method were significantly higher (P < 10−2) than those reconstructed with the L-Curve method when the noise level was less than 30%. The exact P-values are listed in Table 3.
Table 3.
P-values of one-tail Wilcoxon rank-sum test
| Noise level | 15% | 22% | 30% | 37% | ||
|---|---|---|---|---|---|---|
| Figure 6 | Electrogram CC | SP - CRESO | 1.2 * 10−34 | 6.7 * 10−35 | 2.7 * 10−44 | 2.3 * 10−65 |
| SP – L-Curve | 1.4 * 10−13 | 4.5 * 10−7 | 3.3 * 10−4 | 0.0052 | ||
| Electrogram RE | SP - CRESO | 6.6 * 10−32 | 1.4 * 10−33 | 2.5 * 10−44 | 5.4 * 10−69 | |
| SP – L-Curve | 5.1 * 10−11 | 7.6 * 10−6 | 0.0012 | 0.0078 | ||
| Potential map CC | SP - CRESO | 2.0 * 10−58 | 4.1 * 10−58 | 1.5 * 10−81 | 1.3 * 10−140 | |
| SP – L-Curve | 1.7 * 10−12 | 6.8 * 10−5 | 0.0122 | 0.051 | ||
| Potential map RE | SP - CRESO | 6.7 * 10−60 | 9.7 * 10−60 | 2.5 * 10−88 | 3.9 * 10−165 | |
| SP – L-Curve | 1.1 * 10−10 | 0.0014 | 0.069 | 0.147 | ||
| Figure 8 | Electrogram CC | SP - CRESO | 4.9 * 10−35 | 6.4 * 10−38 | 9.1 * 10−47 | 2.1 * 10−56 |
| Electrogram RE | SP - CRESO | 6.4 * 10−18 | 2.9 * 10−21 | 1.2 * 27 | 9.3 * 10−35 | |
| Potential map CC | SP - CRESO | 0.97 | 0.87 | 0.57 | 0.47 | |
| SP – L-Curve | 0.0048 | 0.35 | 0.8 | 0.9 | ||
| Potential map RE | SP - CRESO | 0.99 | 0.97 | 0.92 | 0.86 | |
| SP – L-Curve | 0.46 | 0.17 | 0.008 | 0.003 |
3.3.2. Multiple current dipoles
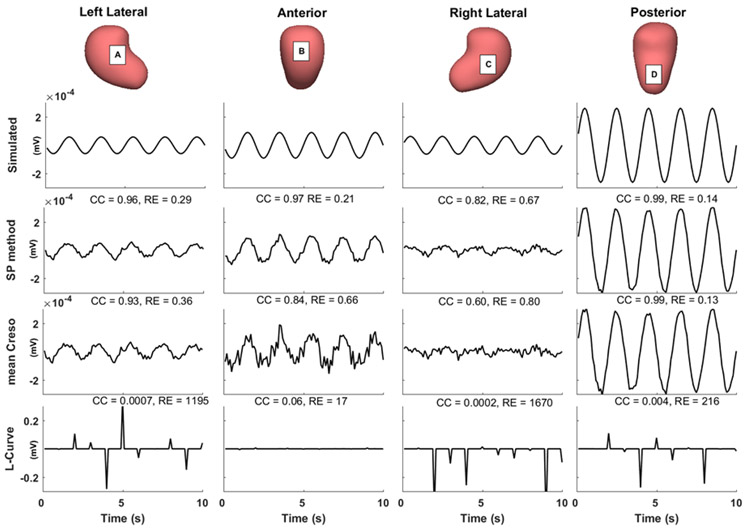
Next, we simulated BSPMs with the three-layer RPI geometry and three current dipoles (Table 2). Four levels of white Gaussian noise were added to the simulated BSPMs, with average peak-to-peak magnitudes 15%, 22%, 30%, and 37% of the signal. We calculated λSP values, used them to reconstruct uterine potentials, and compared the reconstruction accuracy of the SP method to that of the mean CRESO and L-Curve methods. Figure 7 shows representative simulated electrograms and electrograms reconstructed with the three regularization methods. The L-Curve method failed to reconstruct accurate uterine electrograms at any of the sites (CC < 0.1, RE < 10). At left lateral, anterior, and right lateral sites (A, B, and C), the SP-reconstructed electrograms were more accurate than those reconstructed with the mean CRESO method, both qualitatively and quantitatively (CC and RE).
Fig.7. Comparison of reconstructed uterine surface electrograms using three regularization methods.
Simulated and reconstructed electrograms (0 to 10 s) from the indicated sites A to D. CC and RE values are labeled on the top of each electrogram panel. The average noise level of the BSPMs used is 15%.
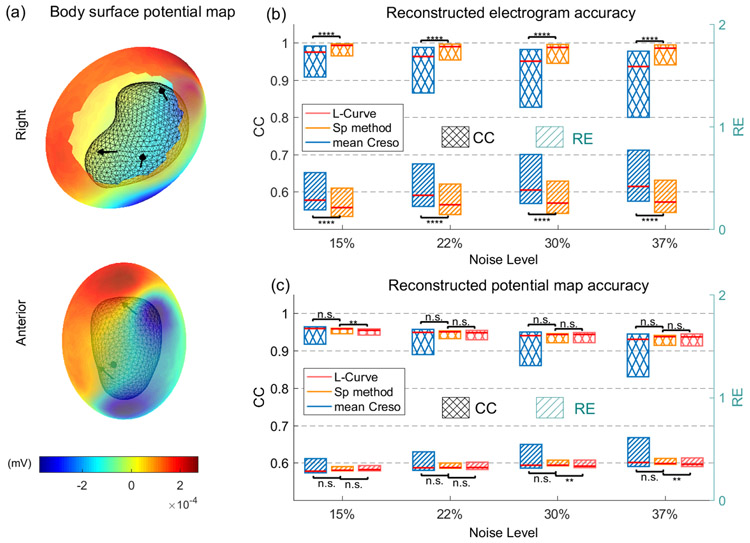
A representative BSPM was rendered in a heat map (Figure 8a) in which warm colors represent positive potentials and cool colors represent negative potentials. We then evaluated the reconstruction accuracy of all 900 electrograms and 100 potential maps. Figure 8b, c show median, first quartile, and third quartile reconstruction accuracies of the three regularization methods under the four levels of noise contamination. The boxplots of CC and RE values of electrograms reconstructed with the L-Curve method are not shown because the maximum CC was less than 0.5 and the minimum RE was larger than 2.2, even at the lowest level of noise. Electrograms reconstructed with λSP were significantly more accurate (P < 10−10 by one-tail Wilcoxon rank-sum test) than those reconstructed with mean CRESO, especially at higher noise levels. Moreover, at 15% and 37% noise, the median CCs of SP-reconstructed electrograms were 1.8% and 5.3%, respectively, higher than those of CRESO reconstructions, and the median REs of SP-reconstructed electrograms were 25.7% and 36.5%, respectively, lower than those of CRESO reconstructions. The CC and RE of the SP-reconstructed potential maps did not significantly differ from those of the mean CRESO and L-Curve reconstructions. The exact P-values are listed in Table 3.
Fig.8. Evaluation of reconstruction accuracy of three regularization methods under RPI Geometry with multiple current dipoles.
a, a body surface potential map with RPI geometry setting shown in right and anterior views. Black mesh represents RPI uterine surface. Black arrows represent dipole locations and directions. b, Reconstructed electrogram accuracy of λSP, mean CRESO λ, and L-Curve λ. The electrogram accuracy of L-Curve λ was too small to show. c, Reconstructed potential map accuracy of λSP, mean CRESO λ, and L-Curve λ. Cross-hatched boxes indicate CC values, and striped boxes indicate RE values. Blue, orange, and pink represent mean CRESO method, SP method, and L-Curve method, respectively, n.s., not significant, * P < 0.05, ** P < 10−2, *** P < 10−3, **** P < 10−4, compared to SP method.
3.3.3. Reconstruction with a clinically relevant number of body surface sites
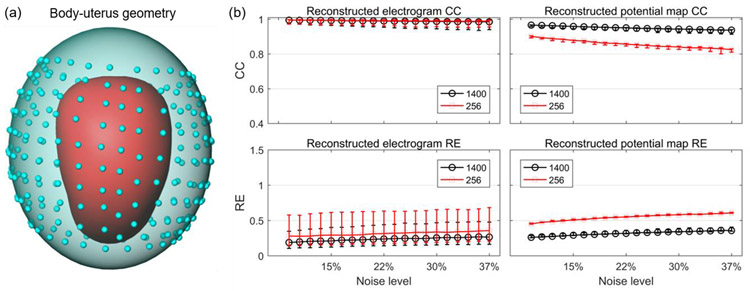
Finally, we tested whether the SP method would accurately reconstruct electrograms and potential maps in a more clinically relevant situation in which 256 electrodes would be placed on the body surface. We simulated the three-layer RPI geometry with 256 body surface sites (blue dots in Figure 9) and generated a new body-uterus geometry. Importantly, we did not include sites in the superior and inferior regions of the geometry, as it would not be possible to place electrodes on these regions in clinical practice. We added 20 different levels of Gaussian noise with average peak-to-peak magnitudes 9% ~ 37% of the signal to the simulated BSPMs in section 3.3.2. Next, we extracted the body surface electrograms at the 256 sites from the noise-contaminated BSPMs. We combined these electrograms with the new body-surface geometry and used the SP method to reconstruct the uterine surface electrograms and potential maps.
Figure 9. Reconstruction accuracy of SP method with 1400 vs. 256 body-surface sites.
a, RPI body-uterus geometry. The blue dots represent the 256 body surface sites. b, reconstruction accuracies with 1400 (black) vs. 256 (red) body surface sites. The median, first quartile, and third quartile of CC and RE values are shown by error bars.
We compared the reconstruction accuracies of electrograms generated with 1400 body surface sites to those generated with 256 body surface sites. Figure 9b shows the median, first quartile, and third quartile of CC and RE values at 20 noise levels. The CCs of electrograms reconstructed with 256 body surface sites were similar to those reconstructed with 1400 body surfaces sites. The median RE values were also similar between the two reconstructions, but the third quartile of REs was higher in electrograms reconstructed with 256 body surface sites than those reconstructed with 1400 body surface sites. We also compared the accuracy of potential maps and found that the median CC values were 7% to 10% lower in reconstructions with 256 body surface sites than in those with 1400 body surface sites. However, the CCs at different noise levels were still all more than 0.8. The REs of potential maps reconstructed from 256 body surface sites were about 0.2 higher than those reconstructed from 1400 body surface sites, but the REs were all still lower than 0.7. Thus, we conclude that SP can be used to accurately reconstruct electrograms and potential maps from 256 body surface sites. Thus, this method should enable accurate generation of uterine surface activation sequences[34, 37].
4. Discussion
This study demonstrates that the optimal regularization parameter for EMMI is spatially dependent. Moreover, in simulations with spherical geometries with different eccentricities and various levels of noise contamination, the SP method resulted in more accurate reconstructions than the conventional L-Curve and CRESO methods, especially for highly eccentric body-uterus geometries and severe noise contamination. We also tested the SP method on a realistic geometry and current dipole models and found that the SP-reconstructed electrograms were more accurate (higher CC and lower RE values) than those reconstructed with the L-Curve or CRESO methods. We conclude that the SP method, which captures the unique spatial information of each uterine site, significantly improves the accuracy for reconstructing uterine electrograms. The SP method would be advantageous in clinical applications, as a hospital environment contains multiple electrical noise sources, and body-uterus geometry is severely eccentric in pregnant women. Moreover, because uterine electrograms are the foundation of constructing activation sequences, the SP method should enhance the clinical application of EMMI.
We argue that our simulation method is appropriate for three main reasons. First, the electrical signals measured on the body surface or uterine surface are the integral of the underlying action potentials across the myometrial cell membranes [8, 36]. A detailed electrical source model, such as the bidomain model, can simulate body surface potentials based on ion channel dynamics and spatial microstructure [23, 39, 40]. However, several studies have shown that a simplified electrical source model, such as the current dipole we used here, is sufficient to simulate electrostatic fields and assess the accuracy of electrophysiological imaging [4, 6, 16, 24, 26]. Second, because the body-uterine volume conductor has no significant inductive effect, the biophysical model is quasi-static. This suggests that the inverse computation can be conducted for each potential map independently. Therefore, the waveform of the electrical source does not affect the inverse computation. Finally, for simplicity, we used several bipolar current sources at 5 Hz. This value simulates the electrical activity of uterine contractions, which occur in the range of 0.34 to 1.0 Hz [14, 29].
Although we developed the SP method for EMMI, it can be readily applied to improve the accuracy of other electrical imaging modalities such as ECGI [7, 35]. For example, Oster and Rudy showed that accurate ECG imaging of cardiac arrhythmia requires a spatial-dependent regularization parameter [26].
We recognize that this study has several limitations. First, we used the boundary element method (BEM) to discretize the Laplacian equation underlying EMMI. Our results demonstrated that the SP method significantly improved the inversion accuracy of a BEM-derived transfer matrix. However, the BEM is less able to handle anisotropic properties and imbrication volumes than volume-based numerical methods such as the finite element method (FEM) [20] and the method of fundamental solution (MFS) [35, 37]. Thus, future work will be necessary to test the SP method with FEM and MFS. Second, we used generic sinusoidal waves to assess the performance of the SP method. More complicated and realistic electrophysiological waves should be incorporated for further evaluation. Third, we used the level threshold function, which is empirical and linear and may be sub-optimal for EMMI reconstruction of complicated uterine contraction patterns. Future work will focus on refining the level threshold function to better reflect complex uterine contractions and validate the method with human data.
6. Conclusions
EMMI is the first modality enabling noninvasive, high-resolution mapping of uterine activation in three dimensions. Clinically, EMMI may prove useful for managing patients with preterm contractions. Here, we demonstrated that the solution of the inverse problem underlying EMMI can be significantly improved by optimizing the regularization parameter (λ) for each uterine site by using a spatial-dependent (SP) method. We employed two simulation models to show that the SP method is superior to other available regularization methods in reconstructing both electrograms and potential maps. The SP method can be readily integrated into the EMMI inverse computation and significantly improve EMMI reconstructions of electrograms and potential maps. Thus, the SP method holds great promise in facilitating clinical use of EMMI.
Supplementary Material
5. Acknowledgments
We thank Dr. Deborah Frank for editing the manuscript and Zichao Wen for discussion of the mathematical representations. Funding: This work was supported by the March of Dimes (March of Dimes Prematurity Research Center, PI Macones) and, in part, by grants from NIH/National Institute of Child Health and Human Development (RO1HD094381; PIs Wang/Cahill); the NIH/National Institute of Aging (RO1AG053548; PIs Benzinger/Wang); and the BrightFocus Foundation (A2017330S; PI Wang).
Biographies

Hui Wang, BS, is a PhD student in physics at Washington University in St. Louis. She is developing the Electromyometrial Imaging system.

Yong Wang, PhD, is an assistant professor in the Departments of Obstetrics and Gynecology, Radiology, and Biomedical Engineering at Washington University in St. Louis. He works on electrophysiological imaging and diffusion magnetic resonance imaging.
Footnotes
Publisher's Disclaimer: This Author Accepted Manuscript is a PDF file of a an unedited peer-reviewed manuscript that has been accepted for publication but has not been copyedited or corrected. The official version of record that is published in the journal is kept up to date and so may therefore differ from this version.
Conflict of interest: No conflict of interest.
Supplementary material
Data file S1. CC value of optimal p and l.
Data file S2. Information on test data set of Figure 5.
Materials and methods
7 References
- 1.Aster RC, Borchers B, Thurber CH (2013) Parameter Estimation and Inverse Problems. Academic Press [Google Scholar]
- 2.Barr RC, Ramsey M, Spach MS (1977) Relating epicardial to body surface potential distributions by means of transfer coefficients based on geometry measurements. IEEE Trans Biomed Eng 1–11 [DOI] [PubMed] [Google Scholar]
- 3.Behar J, Andreotti F, Zaunseder S, et al. (2014) An ECG simulator for generating maternal-foetal activity mixtures on abdominal ECG recordings. Physiol Meas 35:1537–1550. 10.1088/0967-3334/35/8/1537 [DOI] [PubMed] [Google Scholar]
- 4.Behar J, Andreotti F, Zaunseder S, et al. (2014) An ECG simulator for generating maternal-foetal activity mixtures on abdominal ECG recordings. Physiol Meas 35:1537. [DOI] [PubMed] [Google Scholar]
- 5.Burnes JE, Taccardi B, MacLeod RS, Rudy Y (2000) Noninvasive ECG imaging of electrophysiologically abnormal substrates in infarcted hearts: a model study. Circulation 101:533–540 [DOI] [PubMed] [Google Scholar]
- 6.Cluitmans M, Brooks DH, MacLeod R, et al. (2018) Validation and opportunities of electrocardiographic imaging: From technical achievements to clinical applications. Front. Physiol 9 [DOI] [PMC free article] [PubMed] [Google Scholar]
- 7.Cluitmans MJM, Bonizzi P, Karel JMH, et al. (2017) In Vivo Validation of Electrocardiographic Imaging. JACC Clin Electrophysiol 3:232–242 [DOI] [PubMed] [Google Scholar]
- 8.Devedeux D, Marque C, Mansour S, et al. (1993) Uterine electromyography: a critical review. Am J Obstet Gynecol 169:1636–1653 [DOI] [PubMed] [Google Scholar]
- 9.Engl HW, Hanke M, Neubauer A (1996) Regularization of inverse problems. Springer Science & Business Media [Google Scholar]
- 10.Euliano TY, Nguyen MT, Darmanjian S, et al. (2013) Monitoring uterine activity during labor: a comparison of 3 methods. Am J Obstet Gynecol 208:66. e1–66. e6 [DOI] [PMC free article] [PubMed] [Google Scholar]
- 11.Franzone PC, Guerri L, Taccardi B, Viganotti C (1985) Finite element approximation of regularized solutions of the inverse potential problem of electrocardiography and applications to experimental data. Calcolo 22:91–186 [Google Scholar]
- 12.Garcia-Casado J, Ye-Lin Y, Prats-Boluda G, et al. (2018) Electrohysterography in the diagnosis of preterm birth: a review. Physiol Meas 39:02TR01. [DOI] [PubMed] [Google Scholar]
- 13.Garfield RE, Maner WL (2007) Physiology and electrical activity of uterine contractions. Semin Cell Dev Biol 18:289–295. 10.1016/J.SEMCDB.2007.05.004 [DOI] [PMC free article] [PubMed] [Google Scholar]
- 14.Garfield RE, Maner WL (2007) Physiology and Electrical Activity of Uterine Contractions. 18:289–295 [DOI] [PMC free article] [PubMed] [Google Scholar]
- 15.Gulrajani RM (1998) The forward and inverse problems of electrocardiography. IEEE Eng Med Biol Mag 17:84–101 [DOI] [PubMed] [Google Scholar]
- 16.Gulrajani RM (1998) The forward and inverse problems of electrocardiography. IEEE Eng Med Biol Mag 17:84–101 [DOI] [PubMed] [Google Scholar]
- 17.Hansen PC (1990) The discrete Picard condition for discrete ill-posed problems. BIT Numer Math 30:658–672 [Google Scholar]
- 18.Hansen PC, O’Leary DP (1993) The Use of the L-Curve in the Regularization of Discrete Ill-Posed Problems. SIAM J Sci Comput 14:1487–1503. 10.1137/0914086 [DOI] [Google Scholar]
- 19.Harper LM, Shanks AL, Tuuli MG, et al. (2013) The risks and benefits of internal monitors in laboring patients. Am J Obstet Gynecol 209:38. e1–38. e6 [DOI] [PMC free article] [PubMed] [Google Scholar]
- 20.Khoruv DS, Marks GF (1995) Adaptive regularization of the inverse problem in electrocardiography. In: Engineering in Medicine and Biology Society, 1995., IEEE 17th Annual Conference IEEE, pp 211–212 [Google Scholar]
- 21.Levin E, Meltzer AY (2017) Estimation of the regularization parameter in linear discrete ill-posed problems using the Picard parameter. SIAM J Sci Comput 39:A2741–A2762 [Google Scholar]
- 22.Lucovnik M, Maner WL, Chambliss LR, et al. (2011) Noninvasive uterine electromyography for prediction of preterm delivery. YMOB 204:228.e1–228.e10. 10.1016/j.ajog.2010.09.024 [DOI] [PMC free article] [PubMed] [Google Scholar]
- 23.Luo C, Rudy Y (1991) A model of the ventricular cardiac action potential. Depolarization, repolarization, and their interaction. Circ Res 68:1501–1526 [DOI] [PubMed] [Google Scholar]
- 24.MacLeod R, Buist M (2010) The forward problem of electrocardiography In: Comprehensive Electrocardiology. Springer, pp 247–298 [Google Scholar]
- 25.MacLeod RS, Brooks DH (1998) Recent progress in inverse problems in electrocardiology. IEEE Eng Med Biol Mag 17:73–83 [DOI] [PubMed] [Google Scholar]
- 26.Oster HS, Rudy Y (1997) Regional regularization of the electrocardiographic inverse problem: A model study using spherical geometry. IEEE Trans Biomed Eng 44:188–199 [DOI] [PubMed] [Google Scholar]
- 27.Oster HS, Taccardi B, Lux RL, et al. (1997) Noninvasive electrocardiographic imaging. Circulation 96:1012–1024 [DOI] [PubMed] [Google Scholar]
- 28.Rabotti C, Mischi M (2015) Propagation of electrical activity in uterine muscle during pregnancy: A review. Acta Physiol 213:406–416. 10.1111/apha.12424 [DOI] [PubMed] [Google Scholar]
- 29.Rabotti C, Mischi M, van Laar JOEH, et al. (2009) Inter-electrode delay estimators for electrohysterographic propagation analysis. Physiol Meas 30:745–761. 10.1088/0967-3334/30/8/002 [DOI] [PubMed] [Google Scholar]
- 30.Ramanathan C, Jia P, Ghanem R, et al. (2003) Noninvasive electrocardiographic imaging (ECGI): application of the generalized minimal residual (GMRes) method. Ann Biomed Eng 31:981–994 [DOI] [PMC free article] [PubMed] [Google Scholar]
- 31.Romero R, Dey SK, Fisher SJ (2014) Preterm labor: one syndrome, many causes. Science (80-) 345:760–765 [DOI] [PMC free article] [PubMed] [Google Scholar]
- 32.Sikora J, Matonia A, Czabanski R, et al. (2011) Recognition of premature threatening labour symptoms from bioelectrical uterine activity signals. Arch Perinat Med 17:97–103 [Google Scholar]
- 33.Team Rs (2016) RStudio: Integrated Development Environment for R. RStudio, Inc [Google Scholar]
- 34.Wang H, Wu W, Talcott M, et al. (2020) Accuracy of electromyometrial imaging of uterine contractions in clinical environment. Comput Biol Med 116:103543 10.1016/j.compbiomed.2019.103543 [DOI] [PMC free article] [PubMed] [Google Scholar]
- 35.Wang Y, Rudy Y (2006) Application of the method of fundamental solutions to potential-based inverse electrocardiography. Ann Biomed Eng 34:1272–1288 [DOI] [PMC free article] [PubMed] [Google Scholar]
- 36.Wray S (1993) Uterine contraction and physiological mechanisms of modulation [DOI] [PubMed]
- 37.Wu W, Wang H, Zhao P, et al. (2019) Noninvasive high-resolution electromyometrial imaging of uterine contractions in a translational sheep model. Sci Transl Med 11:eaau1428 10.1126/scitranslmed.aau1428 [DOI] [PubMed] [Google Scholar]
- 38.Xu XG, Taranenko V, Zhang J, Shi C (2007) A boundary-representation method for designing whole-body radiation dosimetry models: pregnant females at the ends of three gestational periods—RPI-P3, -P6 and -P9. Phys Med Biol 52:7023–7044. 10.1088/0031-9155/52/23/017 [DOI] [PubMed] [Google Scholar]
- 39.Yochum M, Laforêt J, Marque C (2016) An electro-mechanical multiscale model of uterine pregnancy contraction. Comput Biol Med 77:182–194 [DOI] [PubMed] [Google Scholar]
- 40.Zhang M, Tidwell V, La Rosa PS, et al. (2016) Modeling magnetomyograms of uterine contractions during pregnancy using a multiscale forward electromagnetic approach. PLoS One 11:e0152421. [DOI] [PMC free article] [PubMed] [Google Scholar]
- 41.Zhang M, Tidwell V, La Rosa PS, et al. (2016) Modeling Magnetomyograms of Uterine Contractions during Pregnancy Using a Multiscale Forward Electromagnetic Approach. PLoS One 11:e0152421 10.1371/journal.pone.0152421 [DOI] [PMC free article] [PubMed] [Google Scholar]
Associated Data
This section collects any data citations, data availability statements, or supplementary materials included in this article.


