

Summary:
Liver Receptor Homolog-1 (LRH-1; NR5A2) is a nuclear receptor that regulates a diverse array of biological processes. In contrast to dimeric nuclear receptors, LRH-1 is an obligate monomer and contains a subtype specific helix at the C-terminus of the DNA-binding domain (DBD), termed FTZ-F1. Although detailed structural information is available for individual domains of LRH-1, it is unknown how these domains exist in the intact nuclear receptor. Here, we developed an integrated structural model of human full-length LRH-1 using a combination of HDX-MS, XL-MS, Rosetta computational docking and SAXS. The model predicts the DBD FTZ-F1 helix directly interacts with ligand binding domain helix 2. We confirmed several other predicted inter-domain interactions via structural and functional analyses. Comparison between the LRH-1/Dax-1 co-crystal structure and the integrated model predicted and confirmed Dax-1 co-repressor to modulate LRH-1 inter-domain dynamics. Together, these data support individual LRH-1 domains interacting to influence receptor structure and function.
Keywords: Integrated structural modeling, hydrogen-deuterium exchange mass spectrometry, small angle X-ray scattering, benzophenone artificial amino acid, disulfide crosslink mass spectrometry, BS3, Dax1 Dax-1 Nr0b1, β-catenin CTNNB1, nuclear receptor lipidomics
Graphical Abstract

eTOC Blurb:
LRH-1 is a monomeric nuclear receptor composed of a DNA-binding domain and a phospholipid-binding transcriptional activation domain. Seacrist et al. report an integrated structural model of full-length human LRH-1 bound to DNA, phospholipid and transcriptional co-activator peptide, providing a comprehensive view of how LRH-1 regulates transcription.
Introduction:
Nuclear receptors are ligand-dependent transcription factors that control an array of genetic programs (Evans and Mangelsdorf, 2014). Transcriptional regulation is accomplished through a conserved domain architecture beginning with an unstructured N-terminal domain (NTD) that transitions into a conserved DNA-binding domain (DBD), flanked by a variable hinge linker domain, and ending with a conserved twelve α-helical bundle ligand-binding domain (LBD) (Rastinejad et al., 2013). Although studies of individual domains in isolation have been highly successful at determining modes of DNA binding, hydrophobic ligand binding, and co-regulator binding, far less is known about how these modular domains act together in intact nuclear receptors. To date, high-resolution crystal structures of full-length or multi-domain nuclear receptors have been reported for 4/48 human nuclear receptors (Chandra et al., 2008, 2013, 2017a; Lou et al., 2014). These crystallographic models have provided insight into inter-domain interactions and the communication they facilitate. Because of the technical difficulties in studying more complete versions of nuclear receptors, several studies have taken alternative approaches to examine intact architectures (Rochel et al., 2011; Orlov et al., 2012; Maletta et al., 2014; Huang et al., 2018). Most recently, an integrated structural model of the estrogen receptor was reported using a combination of hydroxyl radical foot-printing, computational modeling, and SAXS (Huang et al., 2018). Remarkably, these studies have not revealed common quaternary structures between different nuclear receptors, given conserved domain architectures. Although these studies have shown inter-domain interactions present in dimeric nuclear receptors, it is unknown if these types of interactions are present in monomeric nuclear receptors.
Liver Receptor Homolog-1 (LRH-1, NR5A2) is one of two members of the NR5A receptor subclass, sharing a high degree of sequence identity (DBD: 95%, LBD: 76%) with steroidogenic factor-1 (SF-1, NR5A1) (Sablin et al., 2003). Both LRH-1 and SF-1 contribute to regulating steroidogenesis, but recent evidence has shown LRH-1 plays a far more ubiquitous role also contributing to the regulation of bile acid, glucose, and cholesterol homeostasis (Oosterveer et al., 2012; Stein et al., 2014; Miranda et al., 2018), embryogenesis (Fayard, Auwerx and Schoonjans, 2004), ovulation (Bianco et al., 2019), pregnancy (Zhang et al., 2013; Meinsohn et al., 2019), pancreatic and breast cancer (Lai et al., 2013; Pang et al., 2017; Cobo et al., 2018), inflammatory bowel disease (Bayrer et al., 2018), Type I and II diabetes (Lee et al., 2011; Cobo-Vuilleumier et al., 2018), and nonalcoholic fatty liver disease (Stein et al., 2017). In contrast to classical dimeric nuclear receptors, NR5A receptors are obligate monomers that recognize a 9-bp motif containing a 5’-extension past the classical AGGYCR nucleotide sequence (Fayard, Auwerx and Schoonjans, 2004; Solomon et al., 2005; Tanya H Little et al., 2006). The unique ability of monomeric nuclear receptors to bind extended motifs, which includes but is not limited to NR5A receptors, is facilitated through a C-terminal extension (CTE) distal to the core DBD. Additionally, NR5A receptors contain a unique FTZ-F1 helix distal to the CTE that is anchored to the core of the DBD via a triad of π-π stacking interactions. Previous studies on LRH-1 and SF-1 have shown interfering with the structural integrity of the FTZ-F1 helix ablates receptor activation, suggesting this helix is required for NR5A receptor function (Solomon et al., 2005; Little et al., 2006). Crystallographic studies of the LRH-1 LBD in isolation have also provided detailed structural information on the overall fold of the domain and the ability of the ligand-binding pocket to bind phospholipids (Sablin et al., 2003; Krylova et al., 2005; Ortlund et al., 2005; Wang et al., 2005). In particular, these initial studies noted the unusually long and rigid nature of LBD helix 2, in addition to directly packing against LBD helix 3 (Sablin et al., 2003). Together, the DBD FTZ-F1 helix and LBD helix 2 constitute structural elements unique to NR5A receptors.
Here, we developed and validated an integrated structural model of full-length LRH-1 (LRH-1FL) in complex with the CYP7A1 promoter and PGC1α LXXLL motif containing co-activator peptide. These studies provide the a molecular model of an intact monomeric nuclear receptor and confirm inter-domain communication contributes to NR5A receptor subclass function. When viewed in light of previous crystallographic models of LRH-1 in complex with intact co-regulators, our integrated structural model of full-length LRH-1 provides additional biological context for the modulatory effects of these transcriptional co-regulators.
Results:
Low-resolution structural restraints on LRH-1FL acquired by solution-based biophysical techniques:
Previous studies have shown a shortened isoform of full-length LRH-1 has higher affinity for both DNA (Weikum et al., 2016) and co-activator (Mays et al., 2017) ligands in comparison to isolated domains. To complement these studies, we performed DNA binding experiments on full-length LRH-1 (isoform 1: 1–541 aa), denoted LRH-1FL, in the presence and absence of the PGC1α co-activator peptide. In our experience LRH-1FL is unstable without DNA and measurements could not be made to determine direct binding affinities. Thus, we tested DNA binding affinity with a competition assay, which revealed LRH-1 exhibits lower affinity for the CYP7A1 oligonucleotide in the presence of PGC1α, suggesting long-range communication occurs upon binding the co-activator peptide to alter DNA affinity (Figure S1A–B, Table S1). Together, these data prompted us to investigate how these in vitro functional changes occur in LRH-1FL.
To probe changes in protein structure and dynamics between LRH-1FL and individual domains, we used HDX-MS (Vadas et al., 2017). Comparison between LRH-1FL and domains in isolation revealed several regions with significant HDX differences meeting the following threshold criteria: 1) statistically significant change (P<0.01) in deuterium uptake, 2) >5% change in deuterium uptake at any timepoint, and 3) >0.4 Da difference in exchange (Spreadsheet S1). Using these criteria, decreases in deuterium uptake were observed in LRH-1FL compared to the isolated DBD in β-sheet 1 and 2 spanning residues 87PVCGDKVSGYHYGLL101, and in the proximal CTE region spanning residues 147LSVGMKLEA155 (Figure 1A–C, Table S2). Decreased deuterium uptake was also observed in LRH-1FL compared to the isolated LBD in helix 2 spanning residues 320AKIMAYL326, and helix 3 spanning residues 342FGMLC346 (although this peptide did not meet one of our threshold criteria, >0.4 Da difference) (Figure 1D,F). Interestingly, increased HDX was observed in LRH-1FL in helix 12 spanning residues 532LIEMLHAKRA541, with a 15% increase observed between residues 532LIEML536 (Figure 1E,F). To determine if the observed HDX changes could be attributed to differential lipid occupancy or species, we performed mass spectrometry on lipids associated with LRH-1FL and LBD. LRH-1FL was associated with ~30% less total lipid content compared to the LBD with no differences observed between relative quantities of total phosphatidylethanolamine (PE) or phosphatidylglycerol (PG) (Figure S2A). Interestingly, subtle differences were observed in acyl-chain length in both PE and PG species associated with LRH-1FL and LBD, where shorter acyl chain containing lipids were enriched in LRH-1FL, while longer acyl chain containing lipids were de-enriched in LRH-1FL. (Figure S2D,E). Previous studies on the LRH-1 LBD in isolation have shown apo- LRH-1 displays increased deuterium exchange in both helix 2 and 12, in contrast to decreases in helix 2 and increases in helix 12 observed in LRH-1FL(Musille et al., 2012a). The same study also showed LRH-1 bound to the short-acyl chain phospholipid DLPC (dilauroylphosphatidylcholine) displays increased HDX in helix 6 and 10, affects not observed in our LRH-1FL-LBD comparative experiment. Together, these data suggest the changes observed in helix 2 of LRH-1FL is unique is to dynamics within the intact receptor. We also attempted to determine if PGC1α binding alters deuterium uptake to find additional restraints. We found expected decreases in deuterium uptake in and around helix 12 (Figure S1C–F, Table S3, Spreadsheet S1), however no HDX changes were detected in DBD peptides under these conditions. Together, these data suggest structural and dynamical differences exist between LRH-1 domains in isolation and in the intact receptor.
Figure 1: HDX-MS reveals regions with differential solvent accessibility dependent on intact receptor.
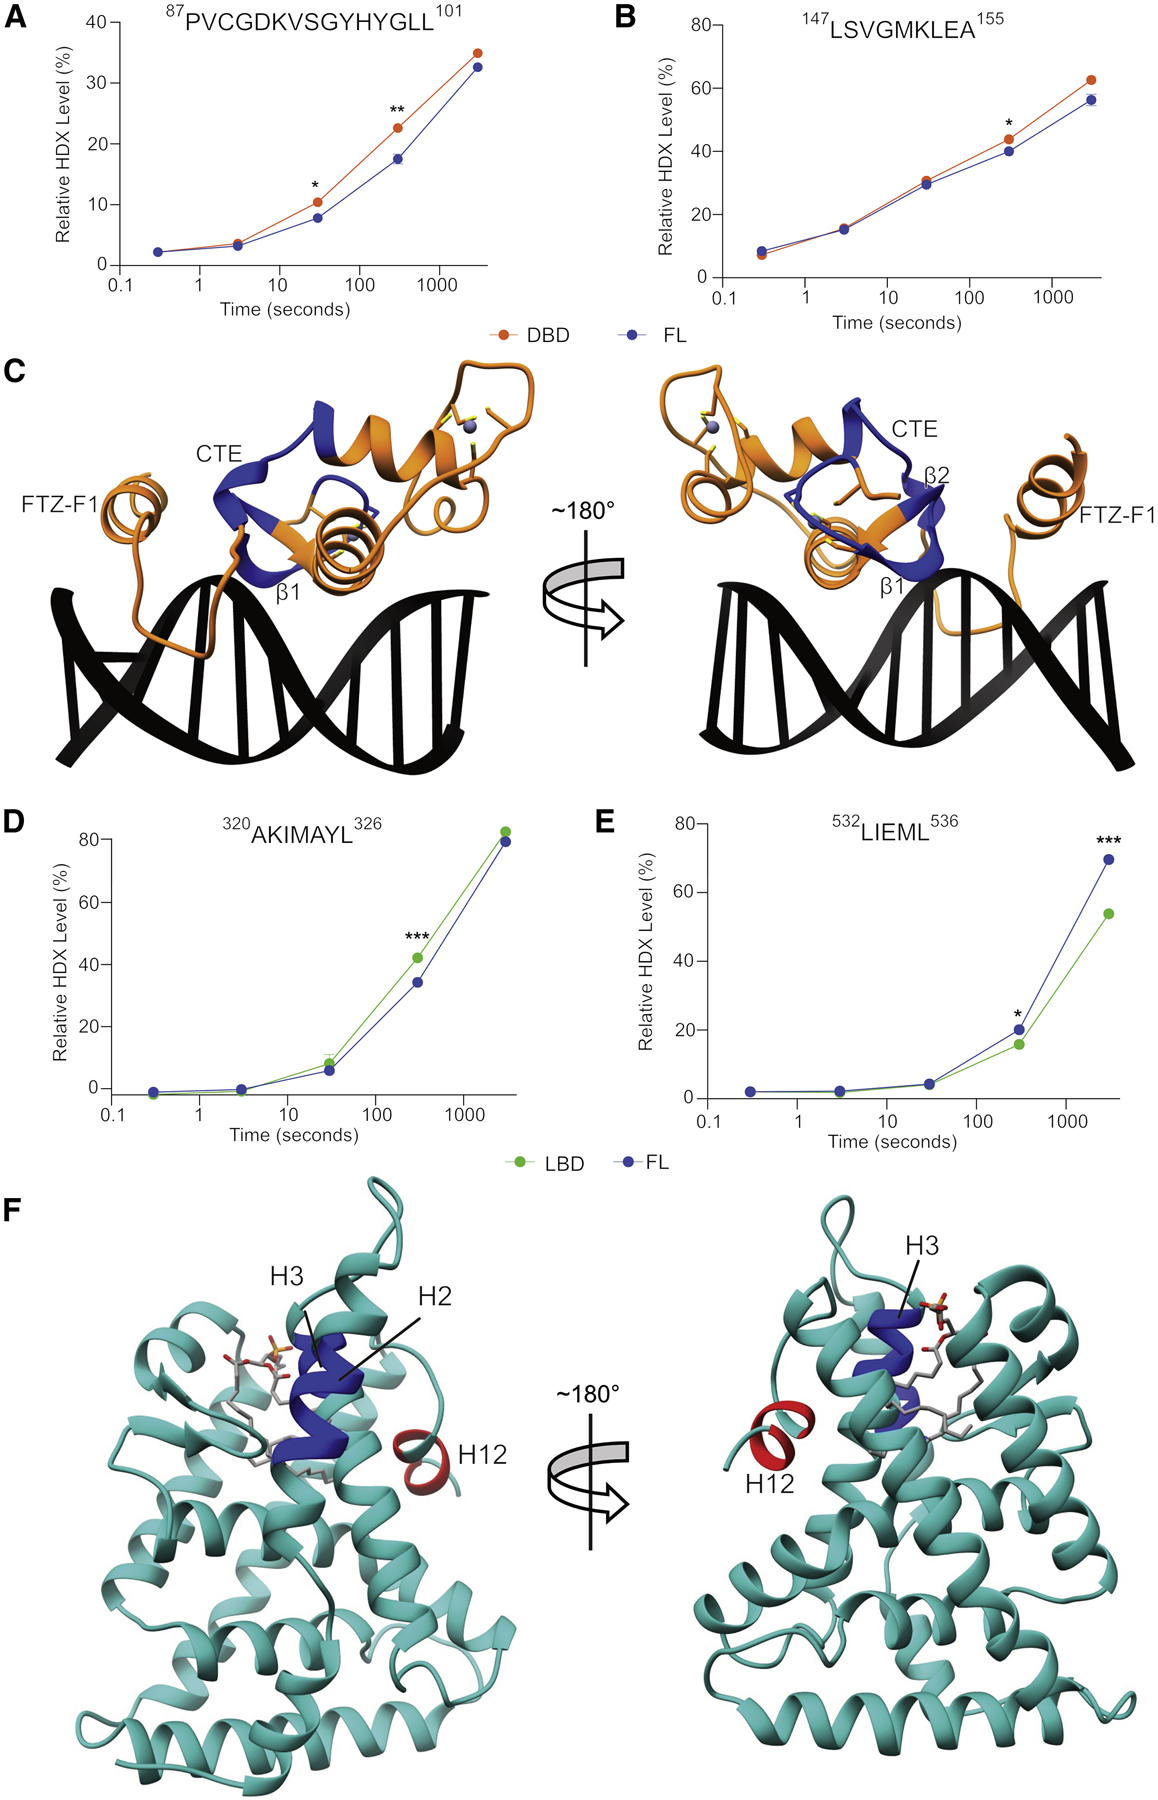
HDX profiles for peptides shown to have differential solvent exchange between LRH-1FL and the DBD (A, B) or the LBD (D,E). Regions with altered solvent accessibility mapped onto crystal structures of the DBD (C) (PDB: 2A66) and LBD (F) (PDB: 1YOK with modeled H2/3 linker). Decreases in HDX are depicted as blue and increases are depicted as red. Data represent mean ± SD from three independent experiments. *P<0.01, **P<0.001, ***P<0.0001.
To provide low-resolution distance information on LRH-1FL, XL-MS experiments were performed using the bis(sulfosuccinimidyl)suberate (BS3) crosslinker in the presence of PGC1α. Analysis of crosslinked samples via SDS-PAGE revealed a band running at approximately the same size as the control un-treated sample, with an additional faint band at higher molecular weight (~150 kDa) (Figure 2A). The major monomeric band was excised, in-gel trypsin digested, and analyzed via liquid chromatography/tandem MS (LC-MS/MS). Crosslinks were bioinformatically identified and verified to be absent in a sample lacking BS3 via integrated MS-1 parent ion chromatogram comparison. This analysis identified ten high-confidence BS3 crosslinks (Figure 2B).
Figure 2: XL-MS of LRH-1 reveals inter-domain and inter-protein crosslinks.
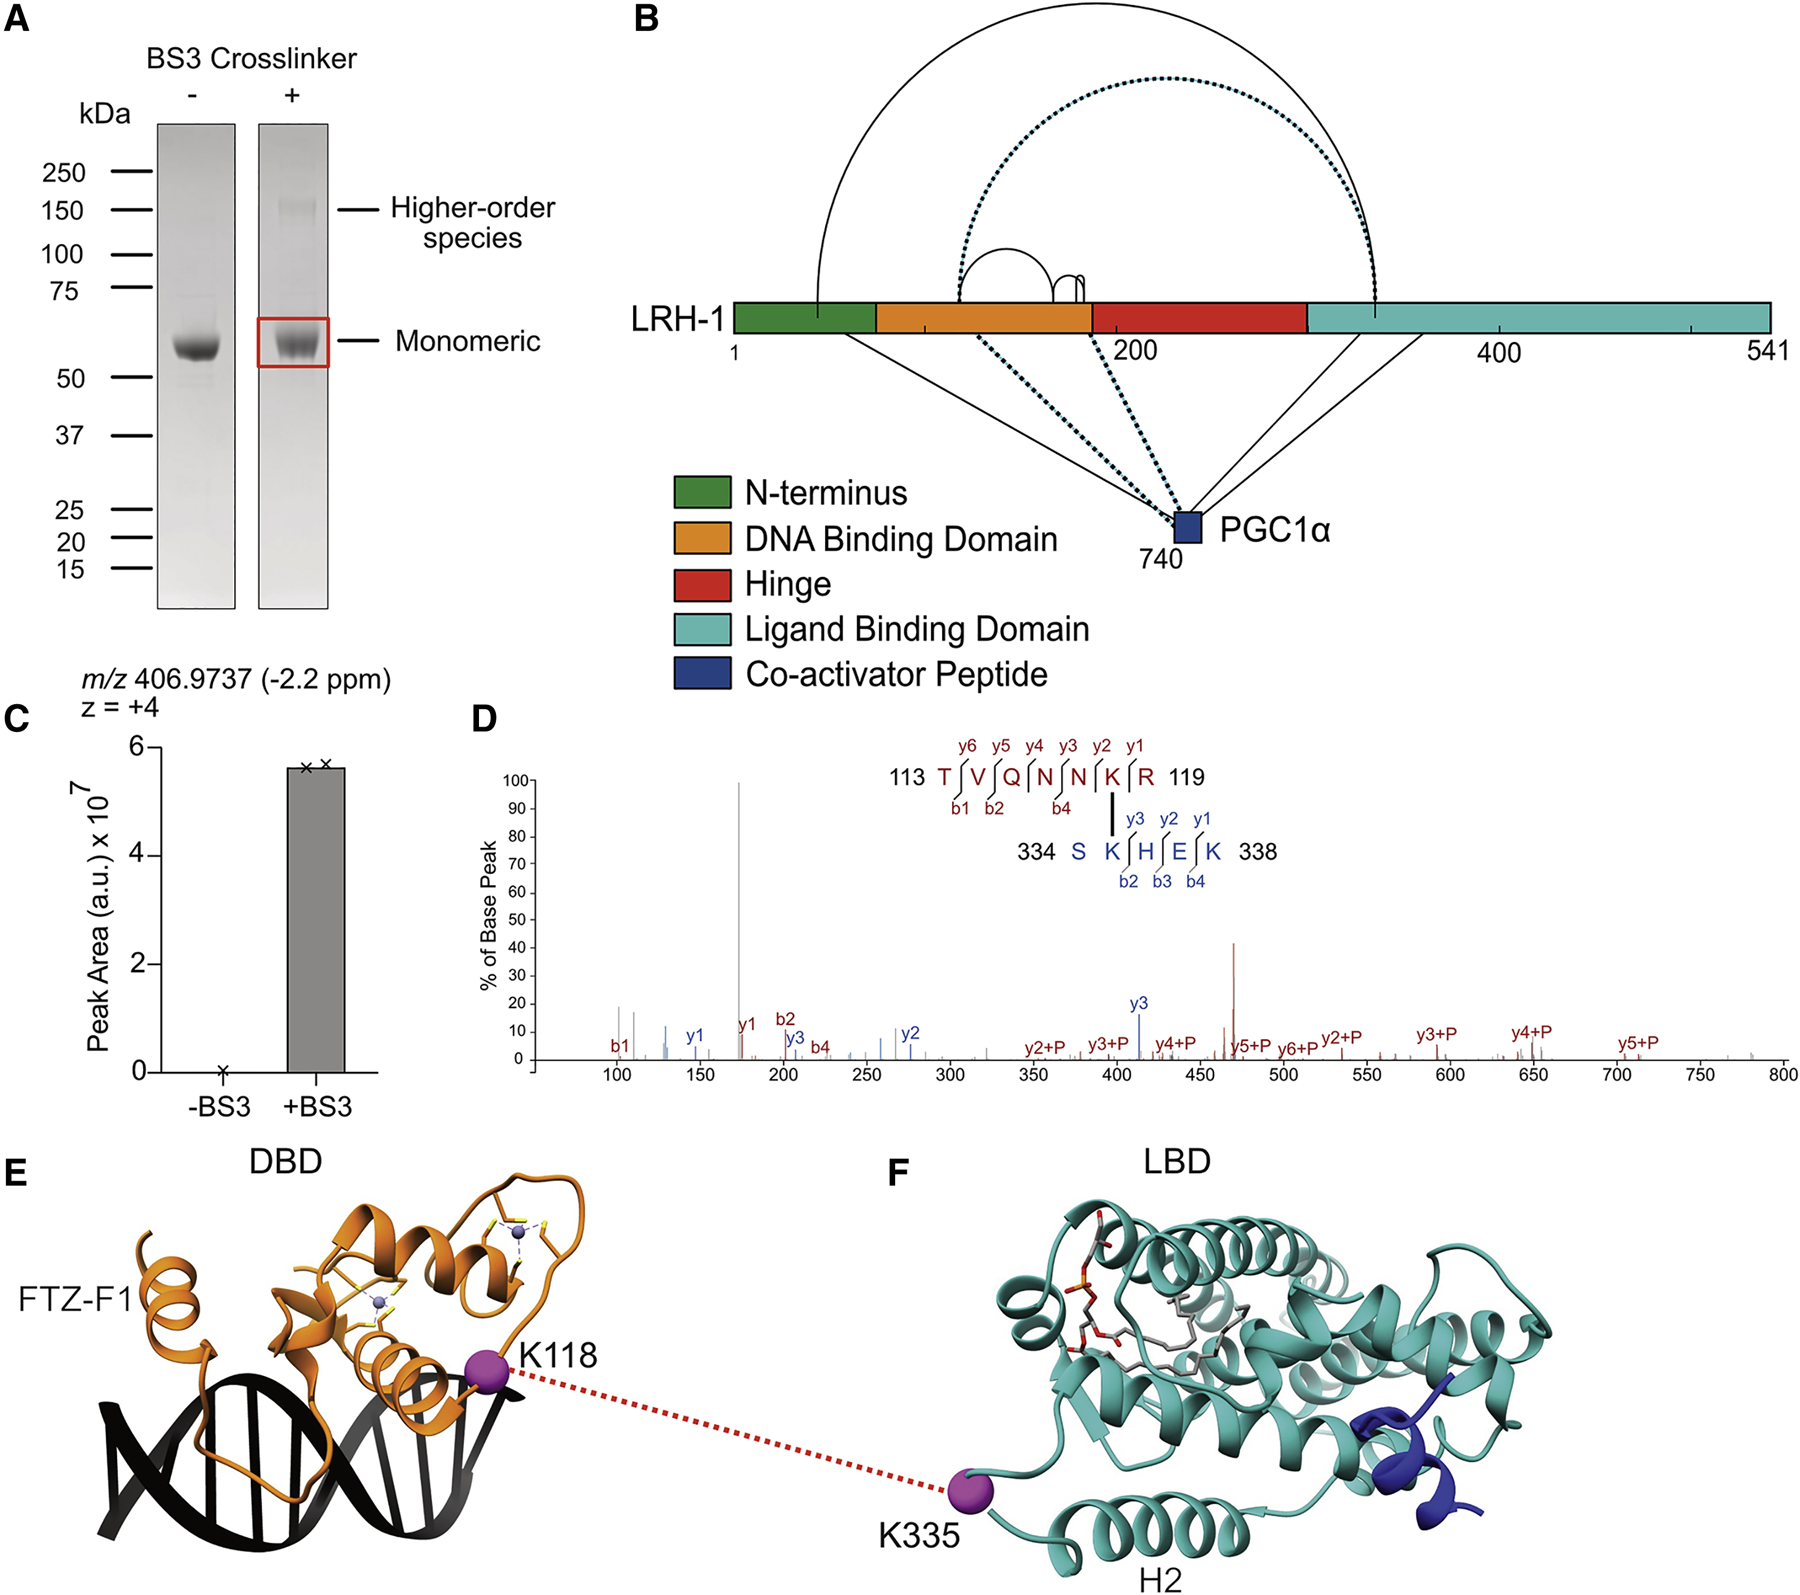
(A) SDS-PAGE of LRH-1FL +/− BS3 treatment. (B) Map of validated BS3 crosslinked residues shown schematically on the LRH-1 primary sequence. Dotted lines represent crosslinks used in computational docking of the DBD and LBD. (C) Integrated MS-1 parent ion peaks observed in extracted ion chromatogram. (D) MS-2 fragmentation spectrum with assigned product ions of K118-K335 inter-domain crosslink. LRH-1 DBD (E) (PDB: 2A66) shown adjacent to LRH-1 LBD (F) (PDB: 1YOK with modeled H2/3 linker) with bona fide inter-domain crosslink site shown as purple sphere connected with red dotted line.
Five crosslinks were identified within LRH-1FL, in addition to five crosslinks between LRH-1FL and PGC1α. Of those ten crosslinks, one crosslink was identified between the LRH-1 DBD and LBD (K118-K335) (Figure 2D–F), and two inter-protein crosslinks were identified between the LRH-1 DBD and PGC1α (Figure S3A–F). Those crosslinks were most informative for determining the arrangement of the DBD and LBD in docking (see below) because they bridged sites in the available crystal structures of the DBD and LBD+PGC1α. In addition, three intra-domain crosslinks were observed within the DBD, and two intra-protein crosslinks were identified between the LRH-1 LBD and PGC1α. Those crosslinks were not considered in docking because they connected residues within the known domain structures. Finally, residue K44 in the flexible NTD was observed to crosslink with sites in the LBD (K335) and PGC1α (K747). These two crosslinks at K44 as well as all other BS3 crosslinks were used to score and select a model of LRH-1FL after adding the flexible NTD and hinge domain to the LRH-1 docking model. To further confirm residues in the LRH-1 NTD and DBD, and in PGC1α were crosslinked with K335, we repeated the XL-MS experiments in the presence and absence of the PGC1α peptide. As expected, the abundance of both the K44-K335 and K118-K335 crosslinks increased in the absence of PGC1a showing the co-activator peptide competed with the intradomain crosslinks in LRH-1 (Figure S3G,H). Together, the HDX-MS and XL-MS analysis of LRH-1FL revealed inter-domain communication occurs within LRH-1 and physical interactions between the DBD and LBD are detectable.
To complement solution-based distance restraints, we also acquired SEC-SAXS data on LRH-1FL in the presence of excess DNA and peptide ligands. Initial model-free analysis revealed the radius of gyration Rg = 38.19 ± 0.46 Å and maximum dimension Dmax ≅ 130 Å (Figure 3D). SAXS provides low-resolution three-dimensional information on the shape of particles in solution, including the contributions of the NTD and hinge region to the LRH-1 structure.
Figure 3: Integrated structural modeling of the LRH-1 DBD-LBD complex.
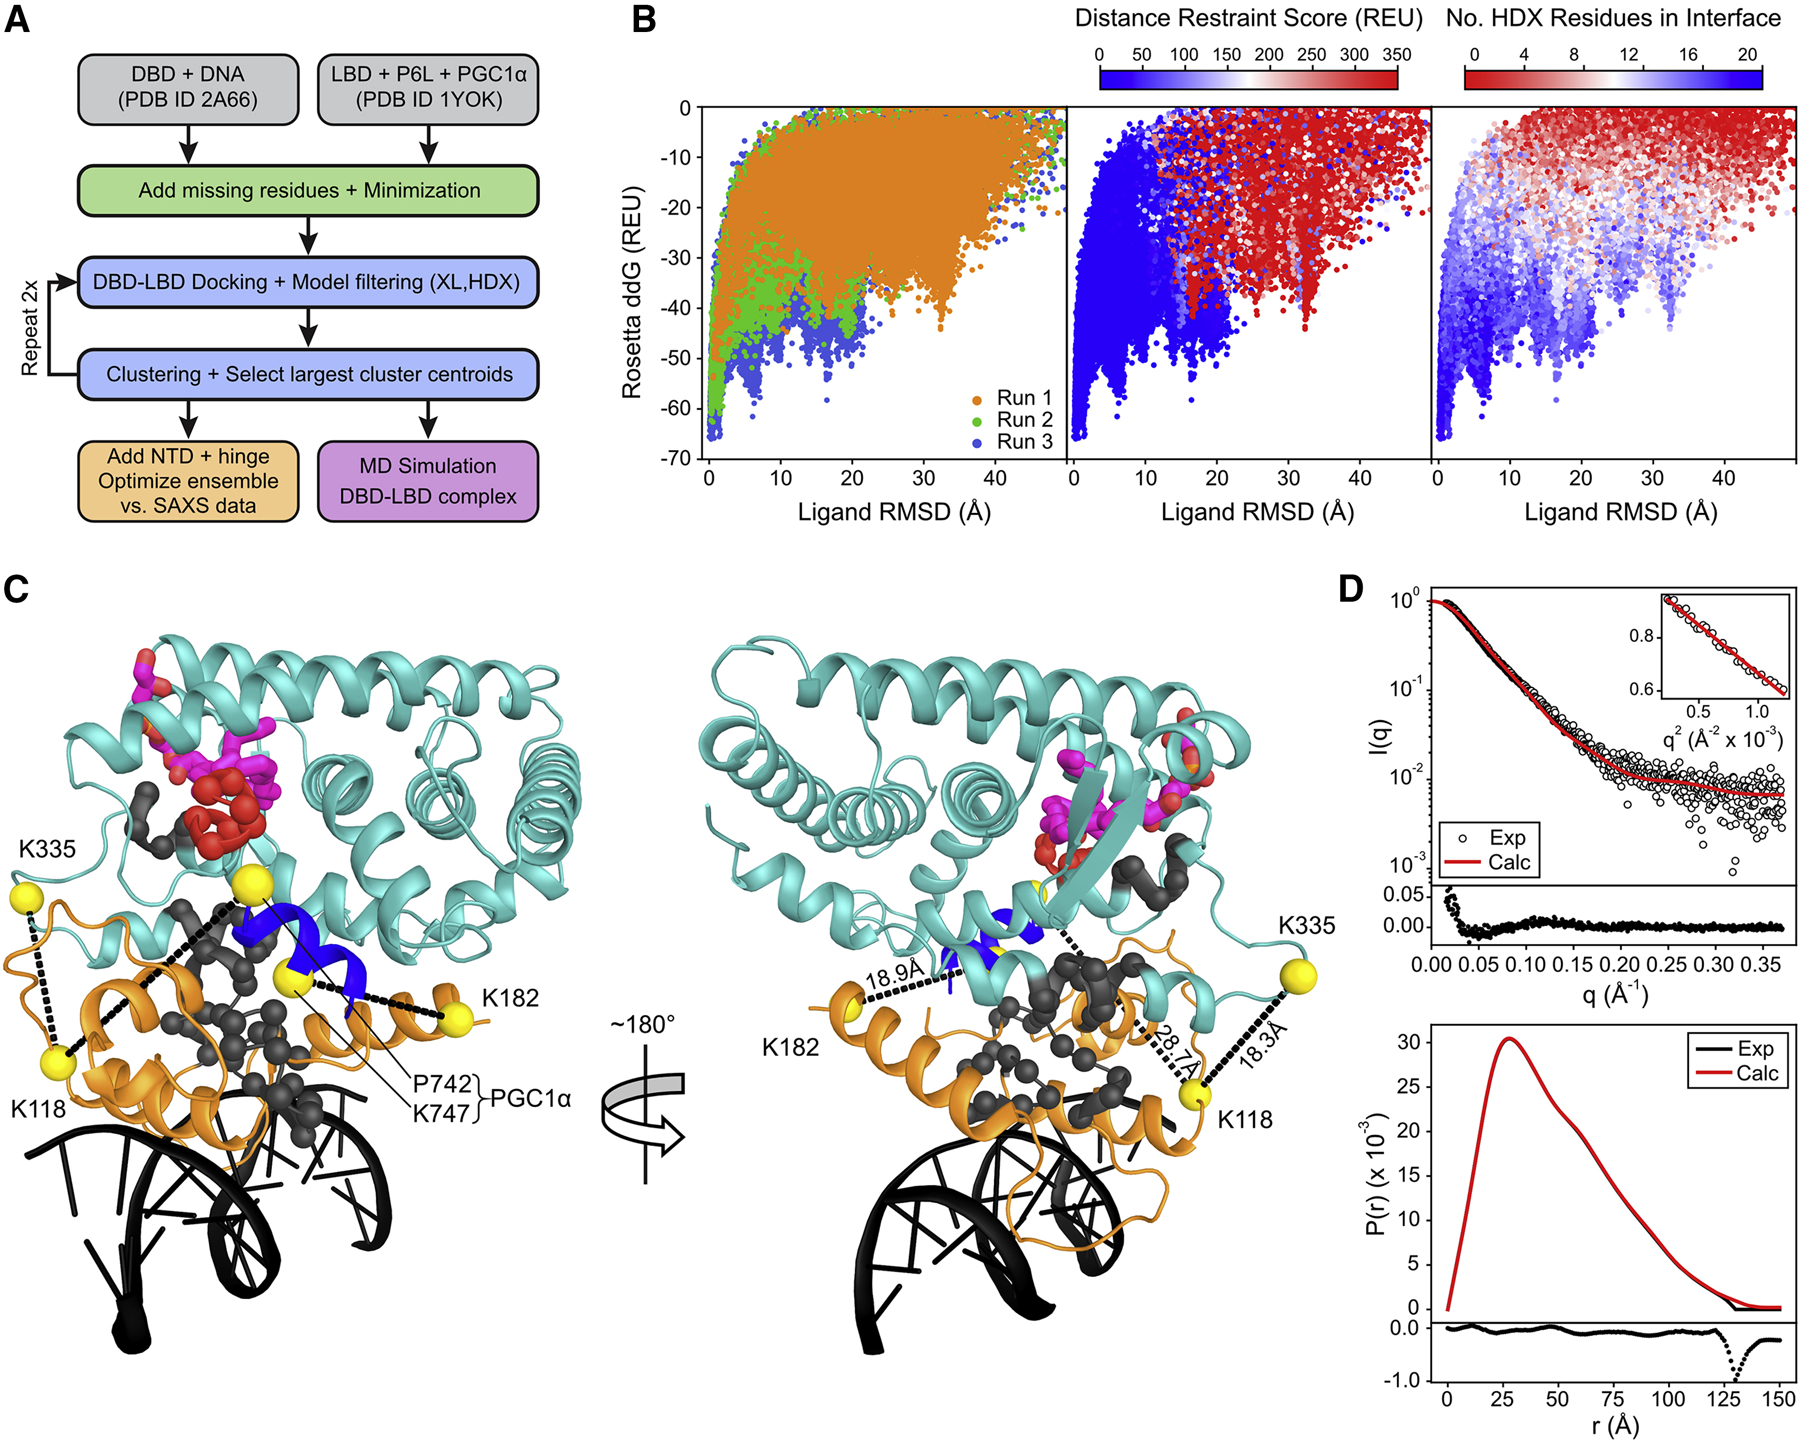
(A) Overview of the modeling workflow. (B) Rosetta ddG score-vs.-ligand RMSD plots. The Rosetta energy, crosslink restraint score, and number of HDX residues in DBD-LBD interface regions gradually improved over three rounds of docking. (C) Cartoon representation of the lowest-scoring DBD-LBD docking model. DNA, DBD, LBD, and PGC1α peptide are colored black, orange, cyan, and blue, respectively, and the phospholipid ligand is depicted as magenta sticks. Crosslink sites are shown as yellow spheres and restrained crosslink distances are indicated with dashed lines. HDX peptide regions in the DBD and in helix 2 of the LBD are colored gray, whereas the location of the HDX peptide in LBD helix 12 is colored red. (D) Comparison of experimental and model-predicted SAXS data. Upper graph: Experimental and theoretical scattering intensity, log10I(q), versus scattering vector q (χ2 = 2.6). The residuals of the fit are shown below the scattering curve. The inset shows the Guinier plot with a linear fit, yielding a radius of gyration Rg = 38.19 ± 0.46 Å. Lower graph: Experimental and theoretical pair distribution function with residuals of the fit shown below the graph. Theoretical SAXS data were calculated as average over the selected ensemble often LRH-1FL models.
Integration of low-resolution structural restraints results in putative LRH-1FL topology:
To investigate the domain arrangement and mode of interaction between the DBD and LBD of LRH-1, we applied molecular modeling with Rosetta incorporating experimental data from HDX-MS, XL-MS, and SAXS. LRH-1 was modeled in complex with the CYP7A1 promoter DNA, bound to a PGC1α co-activator peptide, and co-purifying phospholipid ligand. Experimental restraints were used at different stages of the computational protocol for model filtering and selection (see Figure 3A and Figure S4 for a scheme of the modeling workflow). After initial energy minimization of the DBD (PDB: 2A66) (Solomon et al., 2005) and LBD (PDB: 1YOK) (Krylova et al., 2005) crystal structures and addition of missing residues (see Method Details), the DBD-LBD binding mode was probed by three consecutive rounds of protein-protein docking; each with a centroid phase with rigid-body docking and an all-atom phase where the protein backbone and sidechains were flexible and the inter-domain interface was relaxed.
The HDX data provided a potential surface contact map, as decreased deuterium exchange in DBD regions 87PVCGDKVSGYHYGLL101 and 147LSVGMKLEA155, and LBD region 320AKIMAYL326 in LRH-1FL compared to individual domains is consistent with more protection from solvent exchange. Therefore, we hypothesized these regions to contribute in a putative DBD-LBD interface. Conversely, increased deuterium exchange in residues 532LIEMLHA538 in LBD helix 12 suggested this region was more dynamic in LRH-1FL, consistent with this region not residing within the DBD-LBD interface or having minimal contact with the DBD. To use this information in modeling, we calculated the number of residues shared between a docking model’s interface and each HDX peptide region and restrained this value to be greater than zero for the first three regions (87PVCGDKVSGYHYGL101, 147LSVGMKLEA155, 320AKIMAYL326) or close to zero for 532LIEMLHA538. HDX restraints contributed information to decide whether a model should proceed from the centroid docking stage to the all-atom docking stage, and to filter all models after docking. Region 342FGMLC346 in LBD helix 3 was not included as a docking restraint, because it failed to meet one of our threshold criteria (i.e. >0.4 Da change), but 342FGMLC346 was considered in our post-analysis of the final docking model.
XL-MS provided low-resolution information regarding global domain arrangement. Crosslinks connecting the DBD and LBD (K118-K335) or PGC1α (K118-E740, K182-K747) were translated to upper bound distance restraints between Cα atoms and used to calculate a restraint violation score. The crosslink restraint score was used to rank models after docking. In addition, models were evaluated by their Rosetta all-atom, interface, and ddG energy. Models passing all experimental and energy-based filters were clustered to select new input models for subsequent docking rounds. This procedure was repeated twice with more fine-grained sampling and more restrictive distance restraint cutoffs, leading to a gradual improvement of all experimental restraint and Rosetta scores (Figure 3B). The lowest-scoring model from the third round of docking satisfying all HDX and XL Cα distance restraints is shown in Figure 3C. In this model, LBD helices 1 and 2 engage the DBD via core surface residues and the FTZ-F1 helix. Helix 12 is oriented towards the DBD but is solvent-exposed, and the co-regulator and phospholipid binding pockets in the LBD are accessible from the sides. Additional control calculations with only XL restraints (Figure S7A) (i.e. BS3 crosslinks and an extra benzophenone crosslink acquired in later validation experiments; see below) arrived at a model (Figure S7B) that was indistinguishable from that generated with all XL and HDX restraints (Figure 3C) (Cα-RMSD = 0.7 Å) demonstrating the robustness of our structure prediction protocol.
In comparing our LRH-1 docking model against the XL-MS data, we considered that pairs of crosslinked lysine Nζ atoms (or the PGC1α N-terminus) can approach each other close enough for crosslinking due to protein dynamics in the bound state, which we assessed by conducting all-atom MD simulations (see below and Figure S5, and Table S5). The structural ensemble obtained from the aggregate 3.2 μs MD data contained several configurations in which Nζ atoms of lysine pairs K118-K335 and K182-K747 were connected by a solvent-accessible surface (SAS) path shorter than the length of the fully extended BS3 linker (11.4 Å) (Figures S5C–D,H, and 3rd row in Table S5), confirming agreement between the model and two experimental crosslinks. The K118-E740 crosslink was assessed by computationally extending the PGC1α N-terminus of selected MD models by two additional residues (E740 and E741), which were absent in the LBD crystal structure but present in our experimental construct. The minimal Nζ-N SAS distance between K118 and the PGC1α N-terminus was observed to be as low as 13.9 Å (Figure S5E), which is only slightly longer than the BS3 linker length (11.4 Å), suggesting in the LRH-1 model these sites are poised for chemical modification with BS3 and this crosslink is consistent with the DBD-LBD model domain arrangement. We hypothesize increased structural dynamics, which was not captured in MD but may be present under experimental conditions, may bring the crosslink sites at K118 and E740 even closer together within the reach of the BS3 linker arm. Also of note, XL-MS studies examining proteins of known structure (Kahraman et al., 2013) (Merkley et al., 2014) have observed a considerable fraction of high-confidence crosslinks exceed the theoretically maximum or practically recommended Cα-Cα distance, (~15% are above 24 Å corresponding to the length of two extended lysine sidechains and BS3 linker, and ~10% are above a recommended threshold of 30 Å), indicating care is advised in employing these distance restraints as hard cutoffs.
The LRH-1 model was additionally validated by comparison to SAXS data. To this end, the NTD (M1 – L82) and inter-domain hinge (L185 – P298) were added to the LRH-1 model as these unstructured regions were anticipated to contribute significantly to the SAXS intensity, but were not feasible to be included in docking protocols. Instead, 45,000 NTD and hinge conformations were modeled into the final LRH-1 docking model (Figure 3C) and 49 additional low-scoring models (with very similar domain arrangements) by means of sampling from a dihedral angle distribution characteristic for disordered proteins. Using a genetic algorithm, an ensemble of ten LRH-1FL models was selected by optimizing the fit to the experimental SAXS profile. The final ensemble (Figure S6) was in excellent agreement with the SAXS data, exhibiting a χ2 = 2.6 (Figure 3D) and providing additional confidence to the docking model. Nine of ten BS3 crosslinks were satisfied by all models in the ensemble, whereas the K44-K335 crosslink was satisfied by only two of ten models (Cα-Cα distance ≤30 Å). This, however, is expected given the highly flexible nature of the NTD. Both models, the LRH-1 DBD-LBD docking model and the ensemble of ten LRH-1FL models, are available from PDB-Dev (PDBDEV_00000035).
Computational analysis of the DBD-LBD model of interaction:
The observed domain arrangement between the DBD and LBD warranted a residue contact analysis of the DBD-LBD interface. We first conducted a residue-level breakdown of the Rosetta energy and measured the occurrence of DBD-LBD residue contacts with large contributions to interaction energy (≤−1.0 REU) among the 5,000 lowest-scoring LRH-1 models from the largest cluster after the final round of docking (indicated by red circle in Figure S7C). The resulting DBD-LBD contact map is displayed in Figure 4A. Residue pairs with high occurrence indicate contacts repeatedly sampled by the computational algorithm and represent predicted energetically favorable interactions leading to low-energy docking conformations. We found the most frequent interactions clustered at three sites (Figure 4B): Site 1 is formed between the DBD FTZ-F1 helix and LBD helix 2/helix 1–2 loop. Site 2 comprises contacts between the DBD CTE and middle region of DBD helix 2. Site 3 includes residues in the core DBD, and LBD helix 3 and helix 11–12 loop.
Figure 4: Predicted inter-domain contacts in the LRH-1 models.
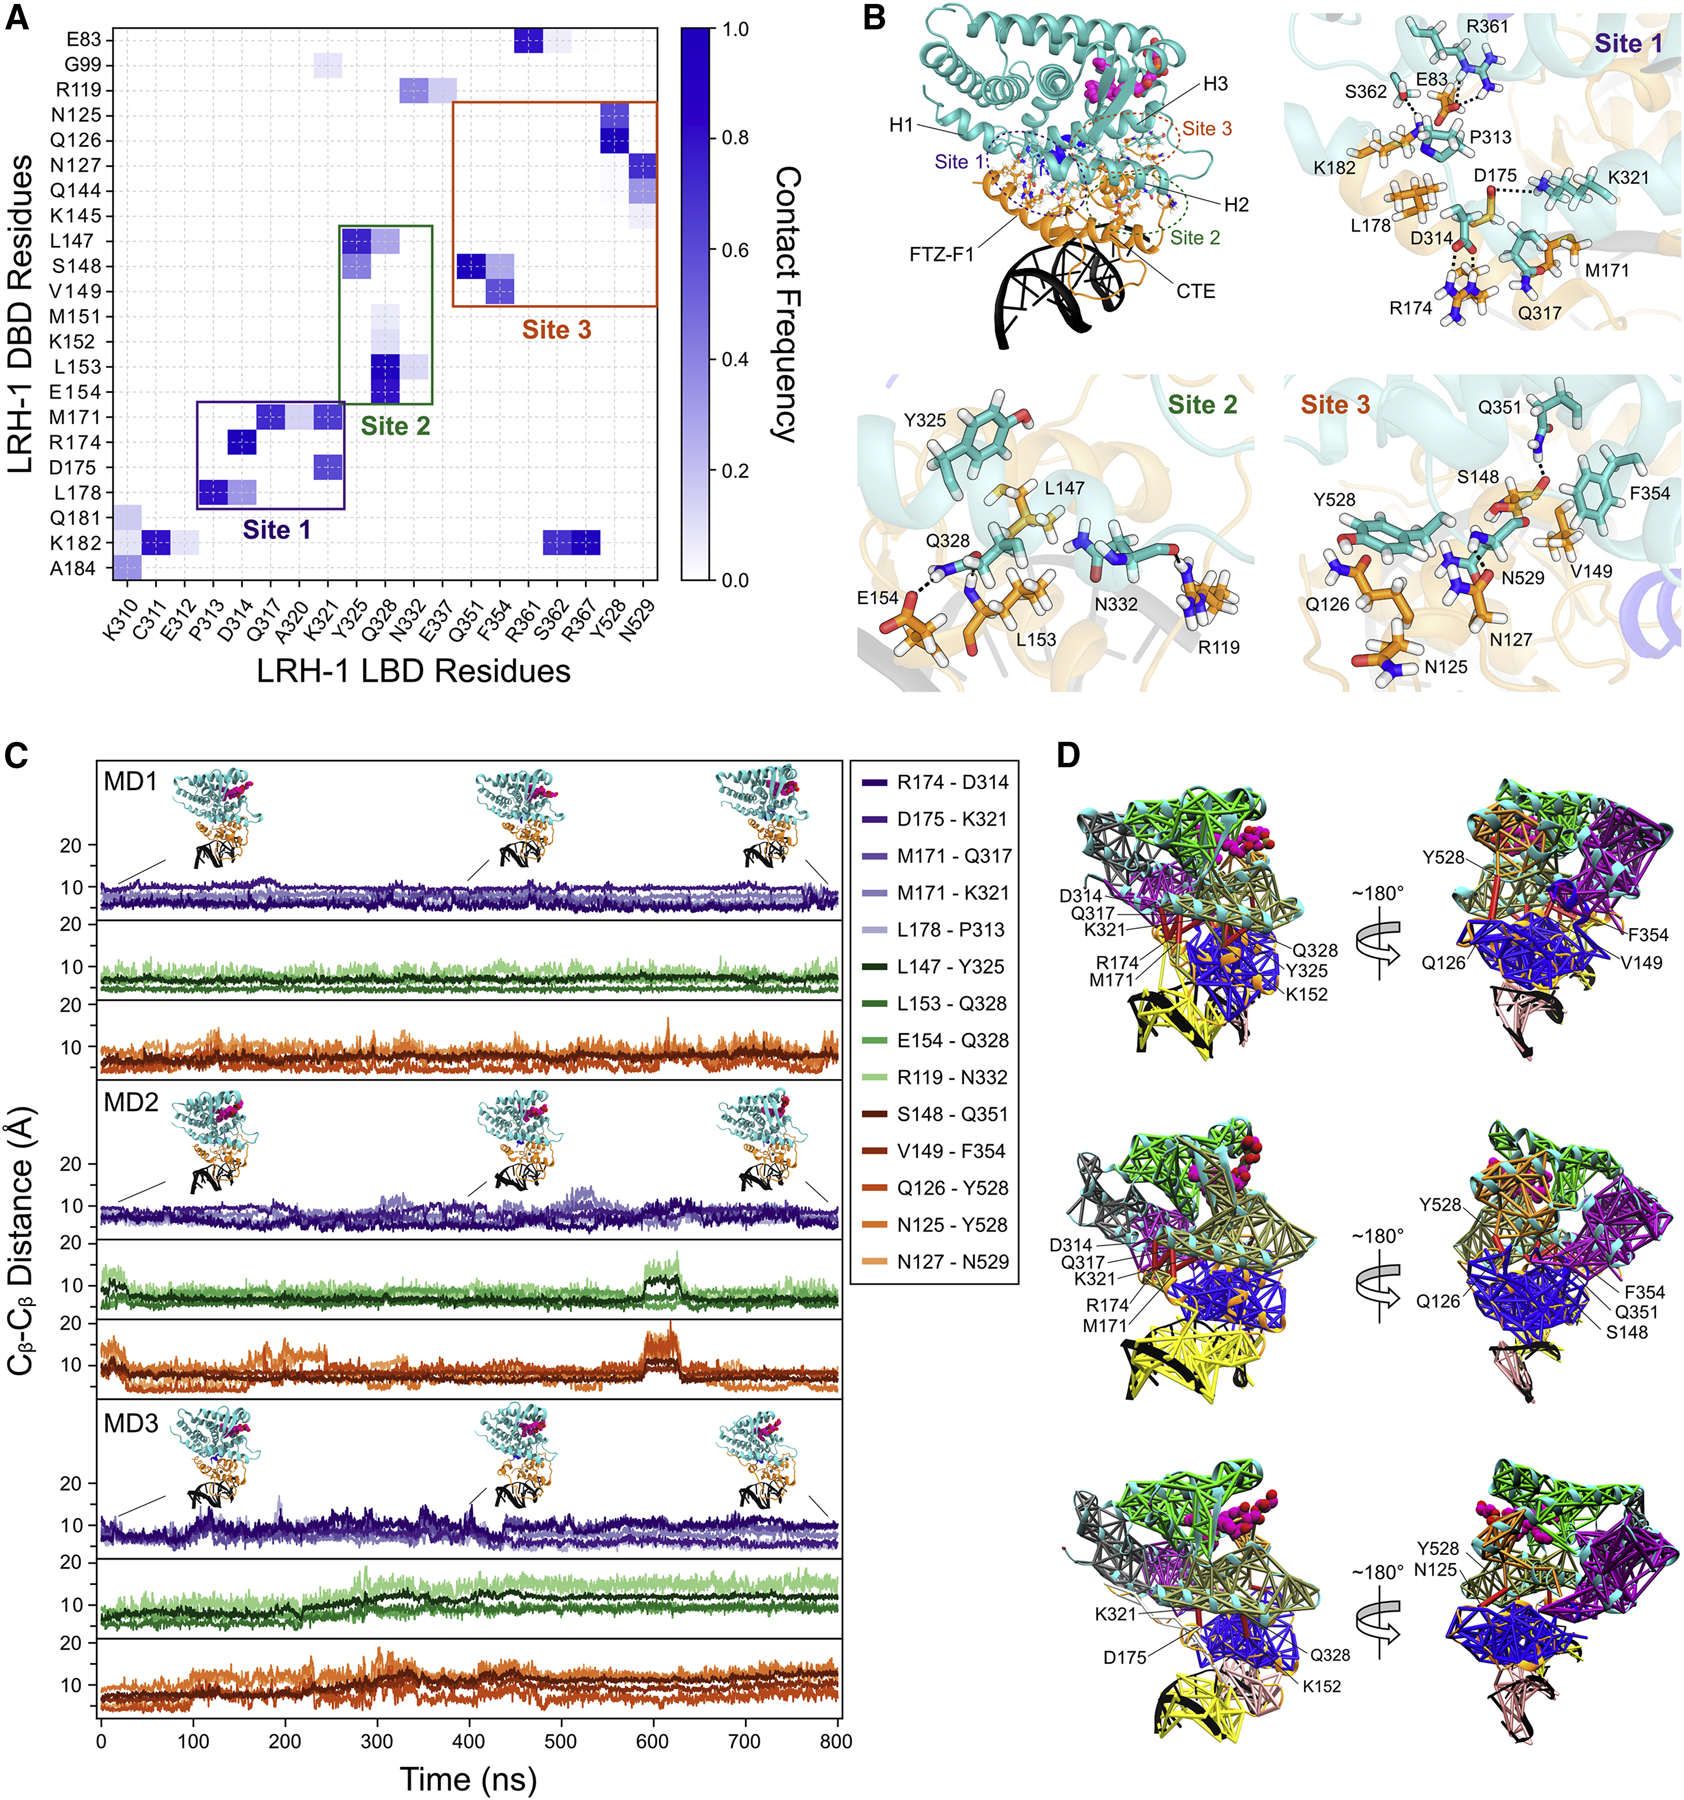
(A) DBD-LBD contact map suggests interactions cluster at three sites in LRH-1. An energy cutoff of −1 REU between two residues was used to define a contact. (B) Three-dimensional representation of DBD-LBD interaction sites. Site 1 is formed between the DBD FTZ-F1 helix and the C-terminal end of LBD helix 2 and helix 1–2 loop. Site 2 involves contacts between the DBD CTE loop and the middle region of DBD helix 2. Site 3 includes residues in the DBD core and LBD helix 3 and helix 11–12 loop. The sidechains of residues corresponding to the 20 most frequent contacts identified in the map in (A) are depicted as sticks and labeled. DBD and LBD residues are colored orange and cyan, respectively, and non-carbon atoms are colored according to their chemical identity (O: red, N: blue, H: white). (C) Cβ atom distances of DBD-LBD residue pairs from (B) during three separate MD simulations (MD1–3) of the LRH-1 docking model. Residue distances from sites 1, 2, and 3 are colored with different shades of purple, green, and orange, respectively, and plotted side-by-side for visualization. Representative snapshots of LRH-1 at different time steps during the MD trajectory are shown above the distance plot. (D) Dynamical network analysis of LRH-1 MD simulations. Subnetworks are shown with different colors with corresponding edges plotted onto the last snapshot from the MD simulations in (C). Critical edges connecting networks in the DBD with networks in the LBD as well as edges connecting nodes within the same network across the DBD-LBD interface are colored red and labeled by their corresponding node residues.
We then conducted MD simulations of the LRH-1 DBD-LBD docking model in explicit water in order to assess the stability of the predicted contacts and investigate their dynamics. Overall, the DBD-LBD interface remained stable and the Cβ (Figure 4C) and sidechain (Figure S8) distances of residue contacts at sites 1–3 remained close to their starting values in the docking model. In one of four separate simulation runs, site 1 and 2 contacts changed significantly more where their Cβ distances were above 10 Å for most of the simulation (Figure S8B). However, the LBD and DBD remained bound in the same relative orientation, with site 3 contacts at the core of the interface remaining close to or below a 10 Å Cβ distance.
We further investigated the role of the DBD-LBD interface residues in protein dynamics by conducting dynamical network analysis (Sethi et al., 2009; Eargle and Luthey-Schulten, 2012). Dynamical networks describe the location and extent of concerted motions in a biomolecular system and can be used to identify communication pathways between molecular components. The network consists of a set of nodes and a set of edges connecting pairs of nodes. We assigned a node to every protein residue (centered at Cα) and two nodes to every DNA nucleotide (centered at base atoms N1/N9 and sugar phosphate P atom). An edge was defined between two nodes if their corresponding residues were within a distance cutoff of 4.5 Å for at least 75% of the trajectory, and the edge weight was determined from the pairwise correlation of the two residues’ coordinates. Furthermore, we identified smaller subnetworks denoted as communities, which partition the original network and correspond to residues that move in a concerted fashion. The majority of communication between communities is carried by so-called “critical nodes” which lie at the interface of communities and connect them through most of the paths in the network. Thus, those nodes form “critical edges”.
Figure 4D shows dynamical networks calculated from the last 700 ns of each MD trajectory and mapped onto the LRH-1 model after the final MD step. Communities are shown with different colors, and critical edges which connect communities in the DBD with communities in the LBD are drawn in red. Interestingly, critical edges were found between those residues identified before in our energy-breakdown analysis: M171, R174, D314, Q317, and K321 at site 1, K152, Y325, and Q328 at site 2, and Q126, S148, V149, Q351, F354, and Y528 at site 3. This finding suggests these residues carry the majority of coupled motions between the DBD and LBD. Moreover, in two simulations (MD1 + MD2), the community formed by residues in LBD helices 1, 2, and 3 extended further into the DBD and included the FTZ-F1 helix showing its motion in MD was strongly coupled to the motion of the LBD but detached from that of the rest of the DBD. These findings hint to a potential role of DBD-LBD contact sites in regulating binding affinity and long-range communication between LRH-1 domains.
Site 1: Putative DBD FTZ-F1 helix and LBD helix 2 interaction influence LRH-1FL structure and function:
To validate the structure of LRH-1FL predicted by the integrated model, we utilized site-directed mutagenesis coupled to in vitro and cellular functional analyses, and further structural analyses. Given the predicted R174-D314 salt bridge within Site 1 between the DBD FTZ-F1 helix and LBD helix 2, was 1) present in 93.4% of the Rosetta ensemble of models, 2) had a favorable Rosetta energy of −6.1 ± 0.7 REU, and 3) was predicted to form a critical edge between community networks in MD analysis, we focused our attention on validating this inter-domain interaction (Figure 5). In addition, R174 and D314 are conserved or of similar charge in all eight of the NR5A species analyzed, suggesting these residues are important for LRH-1 structure and function (Figure 5A,B).
Figure 5: R174/D314 inter-domain salt bridge influences LRH-1 structure and function.
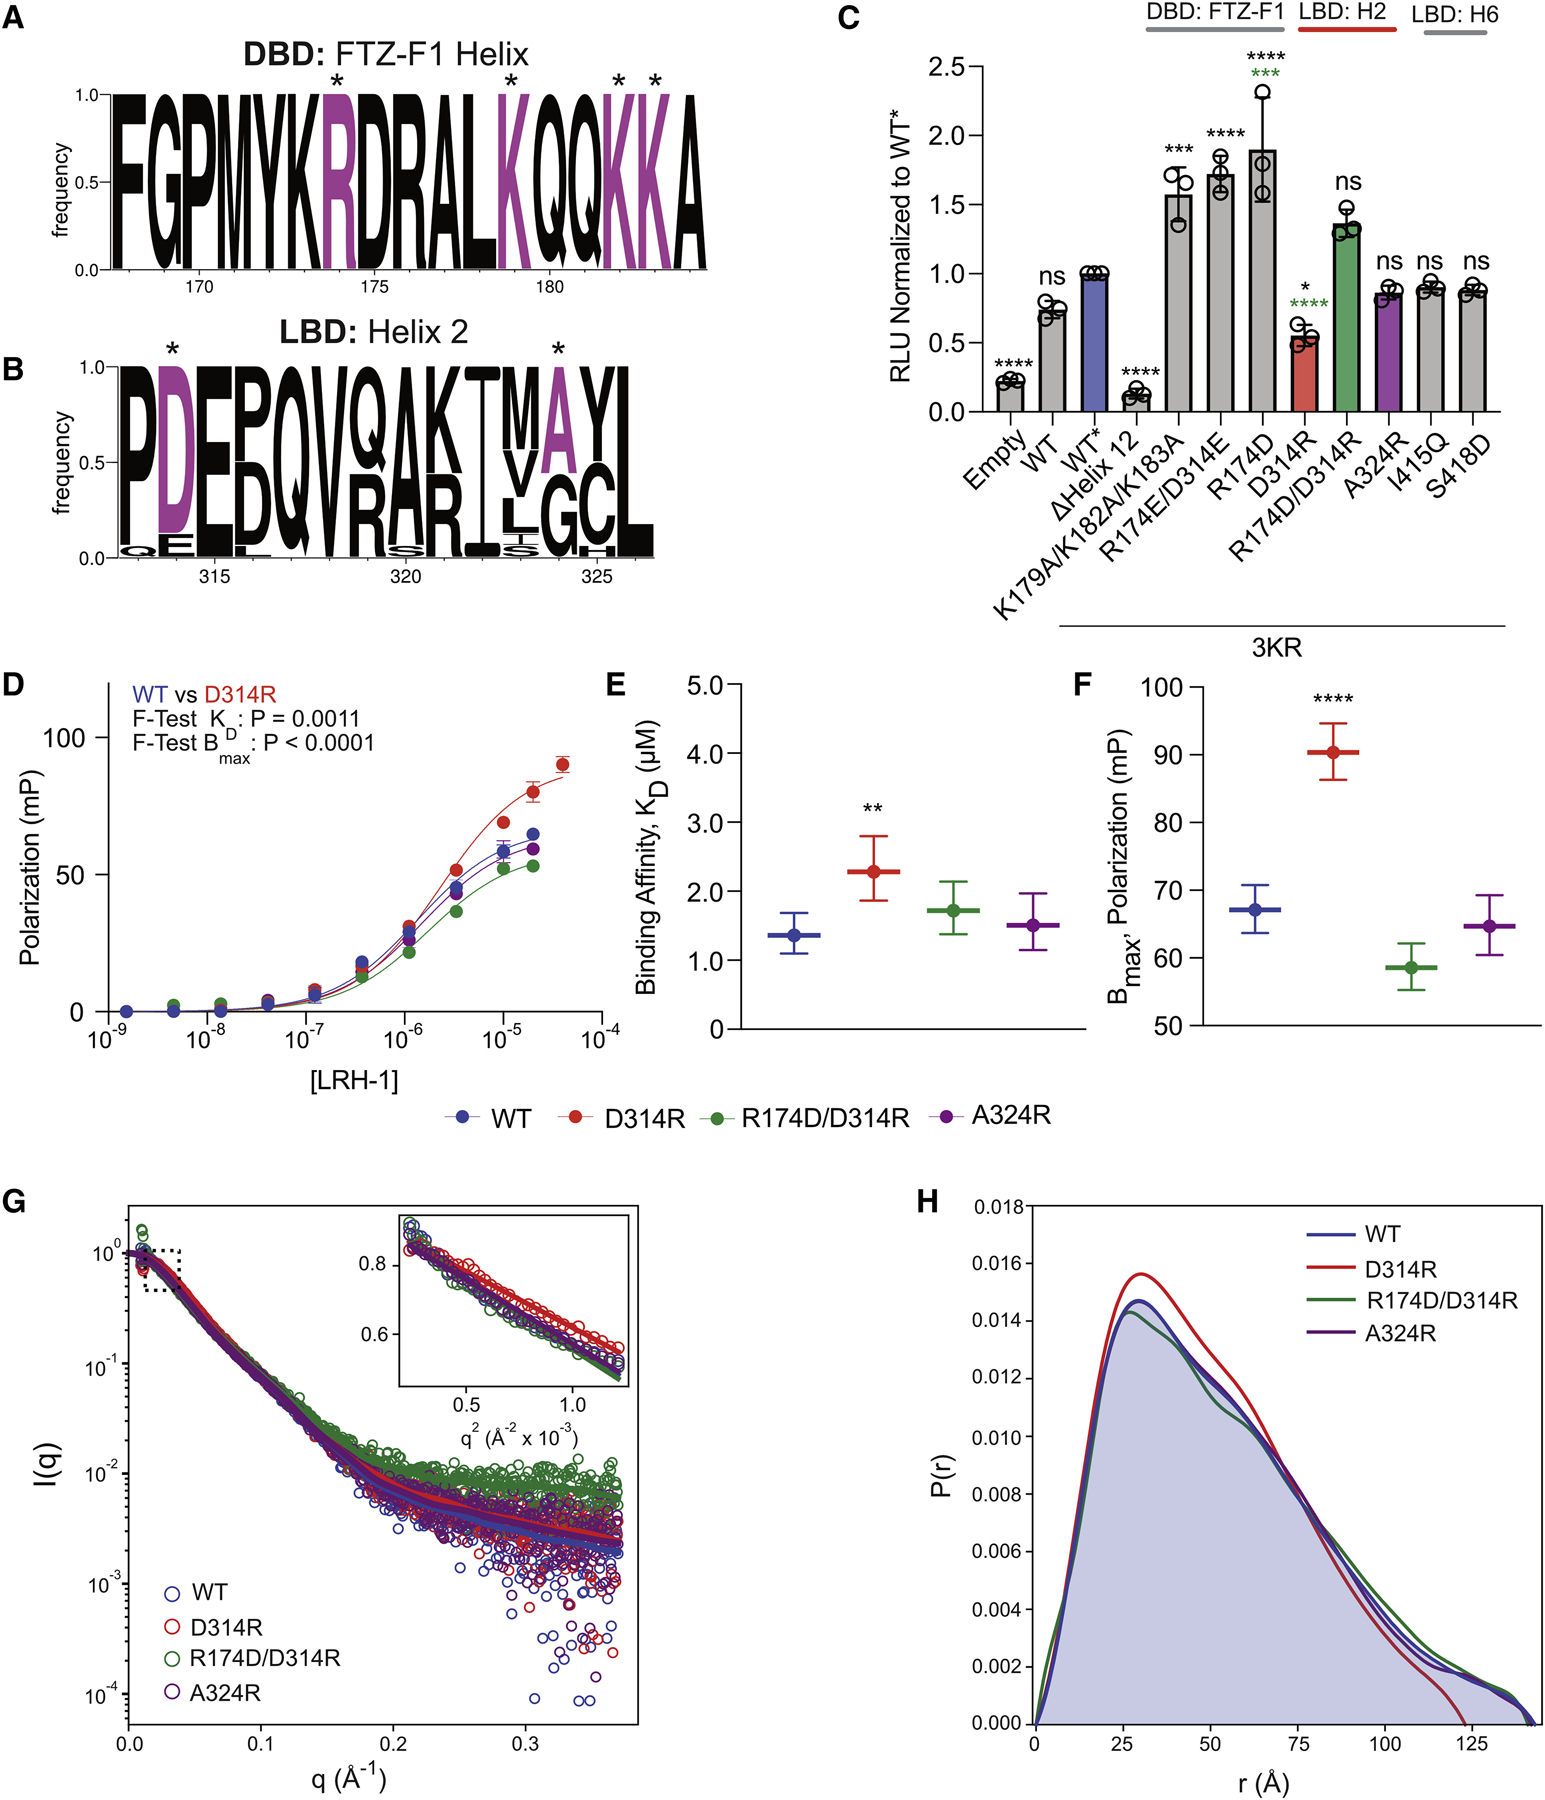
Sequence logos of DBD FTZ-F1 helix (A) and LBD helix 2 (B) compared between eight selected species of both LRH-1 and SF-1 with residues selected for mutagenesis marked by an asterisk (*). (C) Activity of DBD FTZ-F1 helix and LBD helix 2 mutants in luciferase reporter gene activation assays. Data are the combined results of three independent experiments plotted as the mean ± 95% CI. *P<0.05, ***P<0.001, ****P<0.0001, ns – not significant. The expression levels were similar between WT* and mutants. See Figure S9. (D) Co-activator binding of LRH-1 R174-D314 salt bridge mutants measured by fluorescence polarization. Data points represent the average ± SEM of three independent experiments. The KD and Bmax parameters are plotted in (E) and (F) as mean ± 95% CI. Comparison was made by extra sum-of-squares F-test. **P<0.01. ****P<0.0001. SAXS analysis of WT LRH-1 and mutants. (G) Experimental and calculated SAXS data with inset showing Guinier plots with linear fits yielding Rg values listed in Table 2. (H) Pairwise distance distributions resulting from Fourier transform of the SAXS data with Rg and Dmax parameters listed in Table 2.
First, we performed PGC1α binding assays to assess whether mutating Site 1 residues alters LRH-1 function. The D314R mutant (KD = 2.28μM) exhibited a statistically significant lower binding affinity compared to WT LRH-1 (KD = 1.36μM) (P=0.0011, F-test; no overlap between 95% CI), albeit showing a modest 2-fold decrease. Additionally, the D314R mutant exhibited a significantly increased Bmax compared to WT (P<0.0001, F-test, no overlap between 95% CI). As a control, we repeated the PGC1α binding assays with the isolated LBDs of WT and D314R. No detectable differences in either KD or Bmax were observed (Figure S9B–D), consistent with D314 being solvent accessible in the isolated LBD and only contributing to an allosteric domain interaction when present in the intact receptor. R174D had expression levels below amounts necessary for functional and structural analyses, preventing characterization of this mutant. However, the double mutant R174D/D314R could be successfully expressed, and, consistent with the integrated model, partially rescued PGC1α binding affinity and led to a KD and Bmax not significantly different from WT. Additionally, a control mutant, A324R, predicted to be adjacent to the putative DBD-LBD interface, failed to alter PGC1α binding.
To test if these changes in PGC1α affinity correlate with structural changes in LRH-1FL, we performed SEC-SAXS on the WT, D314R, R174D/D314R, and A324R species (Figure 5G,H), revealing similar trends: compared to WT (Rg = 42.18 ± 0.37 Å, Dmax ~143 Å), D314R exhibited a decrease in Rg (37.85 ± 0.27 Å) and Dmax (~123 Å), which was rescued by the R174D/D314R double mutant (Rg = 42.71 ± 0.43 Å, Dmax ~141 Å) (Figure 5G,H, and Table 2). No structural change was found for A324 (Rg = 40.98 ± 0.22 Å, Dmax ~142 Å). Together, these data suggest mutations to the putative inter-domain interface alter LRH-1 structure and function.
Table 2:
Parameters from best fits of SEC-SAXS analysis:
| Rg Guinier (Å)a | R2 (Guinier fit)b | Rg Pr (Å)c | Dmax Pr (Å) | quality estimated | X2 (Pr fit)e | |
|---|---|---|---|---|---|---|
| WTf | 41.11 ± 0.41 | 0.98 | 40.84 ± 0.17 | 135 | 0.7653 | 2.10 |
| S148Rf | 35.19 ± 0.89 | 0.98 | 35.52 ± 0.32 | 107 | 0.8687 | 1.23 |
| WTg | 42.18 ± 0.37 | 0.98 | 42.69 ± 0.22 | 143 | 0.7699 | 1.20 |
| D314Rg | 37.85 ± 0.27 | 0.98 | 39.03 ± 0.14 | 123 | 0.7625 | 1.05 |
| R174D/D314Rg | 42.71 ± 0.43 | 0.98 | 43.37 ± 0.25 | 141 | 0.7476 | 1.39 |
| A324Rg | 40.98 ± 0.22 | 0.99 | 42.40 ± 0.17 | 142 | 0.7394 | 1.70 |
Rg obtained by Guinier fit.
Pearson correlation coefficient of Guinier fit.
Rg obtained by pairwise distance distribution function fit.
GNOM quality estimate; a value greater 0.75 is considered a good solution, and a value between 0.5–0.75 is considered a reasonable solution.
χ2 between experimental SAXS curve and SAXS curve back-calculated from pairwise distance distribution.
SAXS data were collected in buffer containing 10 mM Na-phosphate pH 7.0, 100 mM NaCl
SAXS data were collected in buffer containing 20 mM TRIS pH 7.5, 150 mM NaCl, 2% glycerol, 0.5 mM CHAPS, 5 mM DTT
To further validate the DBD CTE loop and FTZ-F1 helix being in close proximity to LBD helix 2, we incorporated the UV-crosslinkable benzophenone (BpF) unnatural amino acid at A324 (Method Details), given mutation to arginine did not alter the structure and function of the receptor in vitro. After expression, purification, irradiation with 365 nm light, and mass spectrometry analysis, a UV-dependent crosslink was observed between A324BpF to CTE residues spanning V156-R162 (Figure S10). The exact location of the crosslink could not be identified due to the lack of chemical specificity of BpF and the lack of a discernable fragmentation pattern within this sequence. Nonetheless, the presence of this crosslink further supports A324 being in close proximity to the DBD CTE as predicted by the integrated model (Figure S5B,I and S10A–C,L).
To examine how these residues influence LRH-1 function under cellular conditions, we performed luciferase-based reporter gene transcription assays in HEK293T cells (Figure 5C). This mutational analysis was performed under a genetic background of LRH-1 that is unable to be SUMOylated at K44, K192, and K270 by mutation to arginine, denoted as 3KR/WT*. This was done to remove any affects SUMOylation has on LRH-1 and because these regions are located in highly dynamic unstructured regions revealed by HDX-MS (Spreadsheet S1). Consistent with the in vitro functional and structural data, D314R exhibited decreased induction of gene transcription relative to WT*, R174D/D314R rescued transcriptional activity levels not statistically different than WT*, and no change was observed with mutation A324R. Surprisingly, mutations R174D and R174E/D314E (glutamate is present at the analogous D314 position in human SF-1) resulted in increased transcriptional activity, as did mutation of neighboring lysines on the FTZ-F1 helix to alanine (K179A/K182A/K183A). Combined, these results suggest removing positive charge from the FTZ-F1 helix results in increased LRH-1 dependent transcriptional induction under the conditions tested in the assay. We also tested the relevance of surface exposed residues on LBD helix 6 given a 5% change in deuterium exchange was noted in the HDX-MS experiments, albeit at a different time point than regions used in generating the integrated model. These mutants (I415Q and S418D) exhibited no statistically significant changes in LRH-1 induced transcriptional activity, consistent with the integrated model predicting these residues to be in a substitutable region. Together, these data show the R174/D314 inter-domain salt bridge influences both the structure and function of LRH-1, confirming the prediction of the integrated model.
Site 2/3: Interference with putative DBD/LBD core alters LRH-1FL structure and function:
We next focused our attention to amino acid S148 spanning Site 2 and 3 given this residue is 1) present in a region associated with decreased deuterium exchange in LRH-1FL, 2) buried in the core of the integrated model, but solvent accessible in isolated DBD crystal structures, and 3) located at a critical node in the MD simulation network analysis (Figure 4D). We noted this site is comprised of small polar or negatively charged amino acids in sequence alignment analysis (Figure 6A). Additionally, searching the sequence database gnomAD (Karczewski et al., 2019), revealed S148 is mutated to arginine in four individuals, although it is unknown if this mutation is associated with a disease phenotype (Figure 6B). To characterize this site and human derived mutation, we performed the same series of experiments to determine its effect on LRH-1 structure and function. S148R exhibited decreased transcriptional induction compared to WT* in cellular luciferase reporter assays (Figure 6C) and exhibited decreased affinity for PGC1α (KD ~7.0 μM) apparent by a rightward shift in the binding curve, although a KD was unable to be determined due to the lack of saturation at 20 μM LRH-1 (Figure 6D, Table 1). S148R also exhibited decreased DNA binding affinity in homologous competition assays as the IC50 95% confidence intervals for WT and S148R do not overlap (Figure 6E,F, Table S1). Additionally, the S148R mutant exhibited an altered structure in SEC-SAXS analysis: Compared to WT (Rg = 41.11 ± 0.41 Å, Dmax ~135 Å), S148R had a decreased Rg (35.19 ± 0.89 Å) and Dmax (~107 Å). (Figure 6G+H, and Table 2). Together, these data confirm that mutation of the core residue S148 alters both the structure and function of LRH-1, confirming the prediction made by the integrated model.
Figure 6: S148R mutant decreases LRH-1 function and alters global structure.
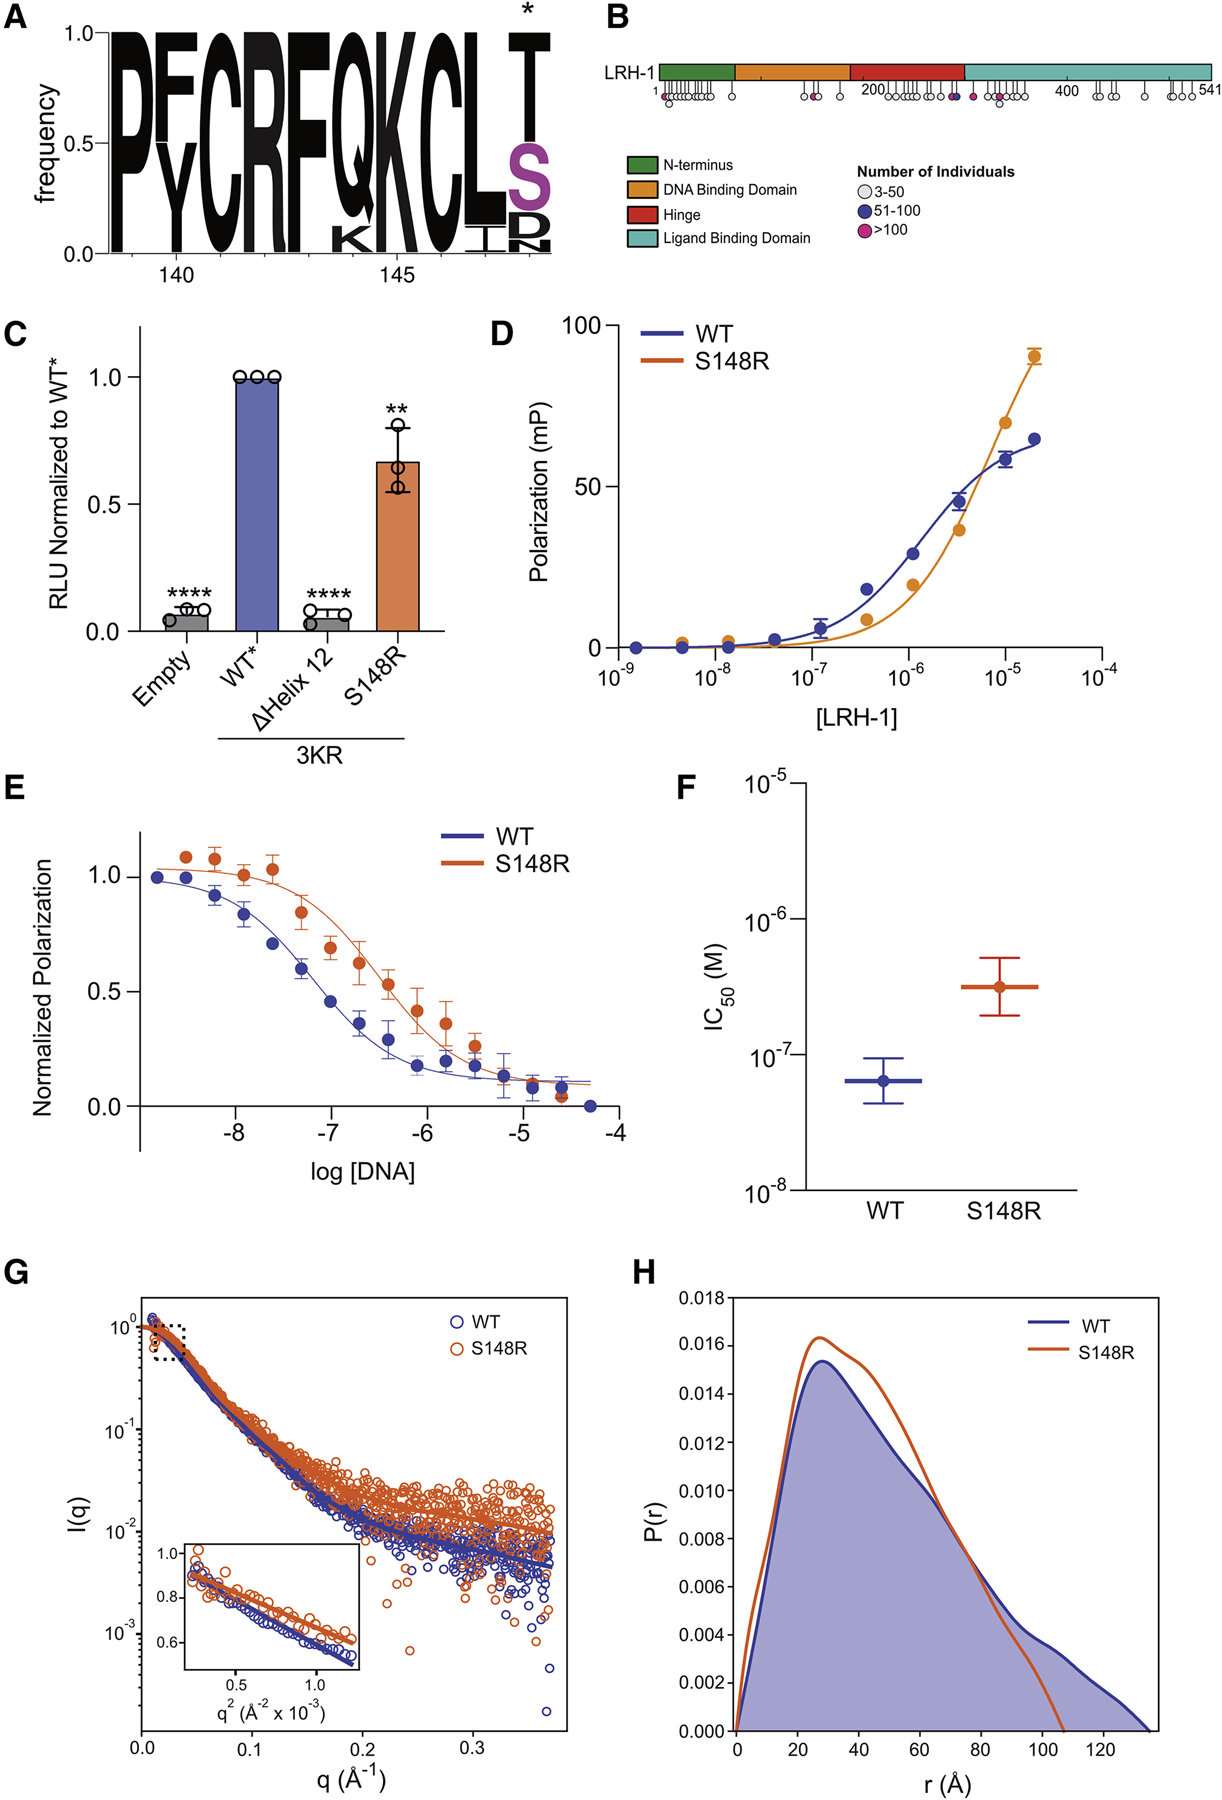
(A) Sequence logo of DBD helix containing S148, with S148 position marked by an asterisk (*). (B) Map of mutations in LRH-1 identified in greater than three individuals in the gnomAD database. (C) Mutational analysis of S148R in luciferase reporter gene activation assays. Data are the combined results of three independent experiments plotted as the mean ± SD. **P<0.01, ****P<0.0001.The expression levels were similar between WT* and S148R. See Figure S9. S148R in vitro characterization in fluorescence polarization. (D) PGC1α co-activator peptide binding and (E) DNA binding curves with associated parameters plotted as mean ± 95% confidence interval (F). Data represent the mean ± SEM from three independent experiments. SAXS analysis of WT LRH-1 and S148R mutant. (G) Experimental and calculated SAXS data with inset showing Guinier plots with linear fits yielding Rg values listed in Table 2. (H) Pairwise distance distributions resulting from Fourier transform of the SAXS data with Rg and Dmax parameters listed in Table 2.
Table 1:
Parameters from best fits of the PGC1α binding curves.
| LRH-1 | KD (μM) | 95% CI (μM) | Bmax(mP) | 95% CI (mP) | R2 |
|---|---|---|---|---|---|
| WT | 1.36 | 1.01–1.69 | 67.1 | 63.7–70.8 | 0.9854 |
| S148R | 7.03 | 5.85–8.50 | 120.7 | 112.5–130.4 | 0.9925 |
| D314R | 2.28 | 1.87–2.80 | 90.4 | 86.3–94.6 | 0.9872 |
| R174D/D314R | 1.72 | 1.38–2.14 | 58.5 | 55.3–62.0 | 0.9839 |
| A324R | 1.51 | 1.15–1.97 | 64.7 | 60.4–69.27 | 0.9761 |
Site 3: Interaction between DBD zinc finger 2 and LBD helix 11–12 linker confirmed by disulfide crosslinking:
Given site 3 is spanned by DBD zinc finger 2 and the LBD helix 11–12 linker, classical loss of function mutations would not confirm the presence of inter-domain interactions given the integral roles of these regions in receptor function. Thus, to confirm this interaction, we performed in-cell oxidation experiments where an LRH-1 Q126C/Y528C double mutant was expressed in an E. coli cell line genetically altered to produce an oxidizing environment, purified to homogeneity, and analyzed via MS to identify disulfide bonds. The Q126/Y528 site was chosen due to 1) being present in 93.4% of the Rosetta ensemble of models, 2) having a predicted Rosetta energy of −3.8 ± 0.3 REU, and 3) the DbD2 prediction algorithm (Craig and Dombkowski, 2013) identified this as a potential designable disulfide. Additionally, cysteine is present in the analogous position of Y528 in Danio rerio LRH-1 and SF-1, suggesting this site would tolerate substitution to cysteine in human LRH-1. Surprisingly, instead of the expected Q126C/Y528C disulfide, we identified a high-confidence inter-domain disulfide crosslink between the engineered Y528C and the naturally occurring C122 of zinc finger 2 (Figure S10G–K). These residues have a predicted Cβ-Cβ-distance of ~8.5 Å in the Rosetta model (Figure 4) and of minimal 4–6 Å in MD simulation (Figure S5B+I, and 4th row in Table S5), confirming these two sites are in close proximity. Given the crosslink was not identified between the engineered cysteine sites, it is possible the Q126C mutation caused a structural rearrangement of the zinc finger given its position relative the (Cys)4 motif and should be viewed in light of this caveat. Together, this data supports predicted interactions in site 3 being present in LRH-1.
Interruption of the LRH-1 DBD-LBD interface results in increased flexibility and altered dynamics:
To further investigate how mutation of critical node residues predicted by the MD simulation within Site 1 (D314R) and Site 2/3 (S148R) result in decreased particle dimensions and function, we performed a series of solution-based dynamics analyses. Normalized Kratky analysis of SAXS data allows for direct comparison of particles in solution exhibiting different shapes and sizes. Comparison of WT and S148R curves revealed a leftward shift in the bell-curve at low q·Rg values, consistent with a decrease in Rg. Additionally, scatter at higher q·Rg values exhibit an overall positive deflection in S148R compared to WT, consistent with increased particle flexibility (Figure 7A). Surprisingly, analysis via quantitative XL-MS revealed the K118-K335 interdomain crosslink to increase ~54% in abundance in S148R compared to WT (Figure 7B). Similar to S148R, comparison of WT and D314R Kratky plots also revealed a leftward shift in the bell-curve at low q·Rg values, consistent with a decrease in Rg. Also similar to S148R, scatter at higher q·Rg values exhibit an overall positive deflection in D314R compared to WT albeit more subtle, consistent with increased particle flexibility (Figure 7C). Further, quantitative XL-MS revealed the K118-K335 interdomain crosslink to increase ~30% in abundance in D314R compared to WT (Figure 7D). To determine if the D314R mutant exhibited alterations in solvent exchange, we performed additional HDX-MS experiments from 3–3,000 seconds (Figure 7E–G, Spreadsheet S1). Mutation to D314R resulted in significant destabilization of helix 2 residues spanning 310KCEPDEPQVQAKIMA324 at all time points performed, with additional increases in deuterium exchange observed in helix 9 spanning residues 468QLVEGVQEQVNAAL481. Additional deuterium exchange increases were observed in helix 12 spanning residues 532LIEML536, although this change did not meet our HDX threshold criterion of >0.4 Da mass difference. Together, these data support both S148R and D314R mutants exhibiting states with 1) decreased particle dimensions (i.e. Rg and Dmax), 2) increased flexibility (Kratky analysis), 3) the DBD and LBD in close proximity such that conformations capable of forming the inter-domain K118-K335 BS3 crosslink are sampled more frequently (XL-MS analysis), and 4) not consistent with a pure “bead-on-a-string” model (lack of global changes in HDX).
Figure 7: LRH-1 inter-domain loss of function mutants exhibit increased flexibility and altered dynamics.
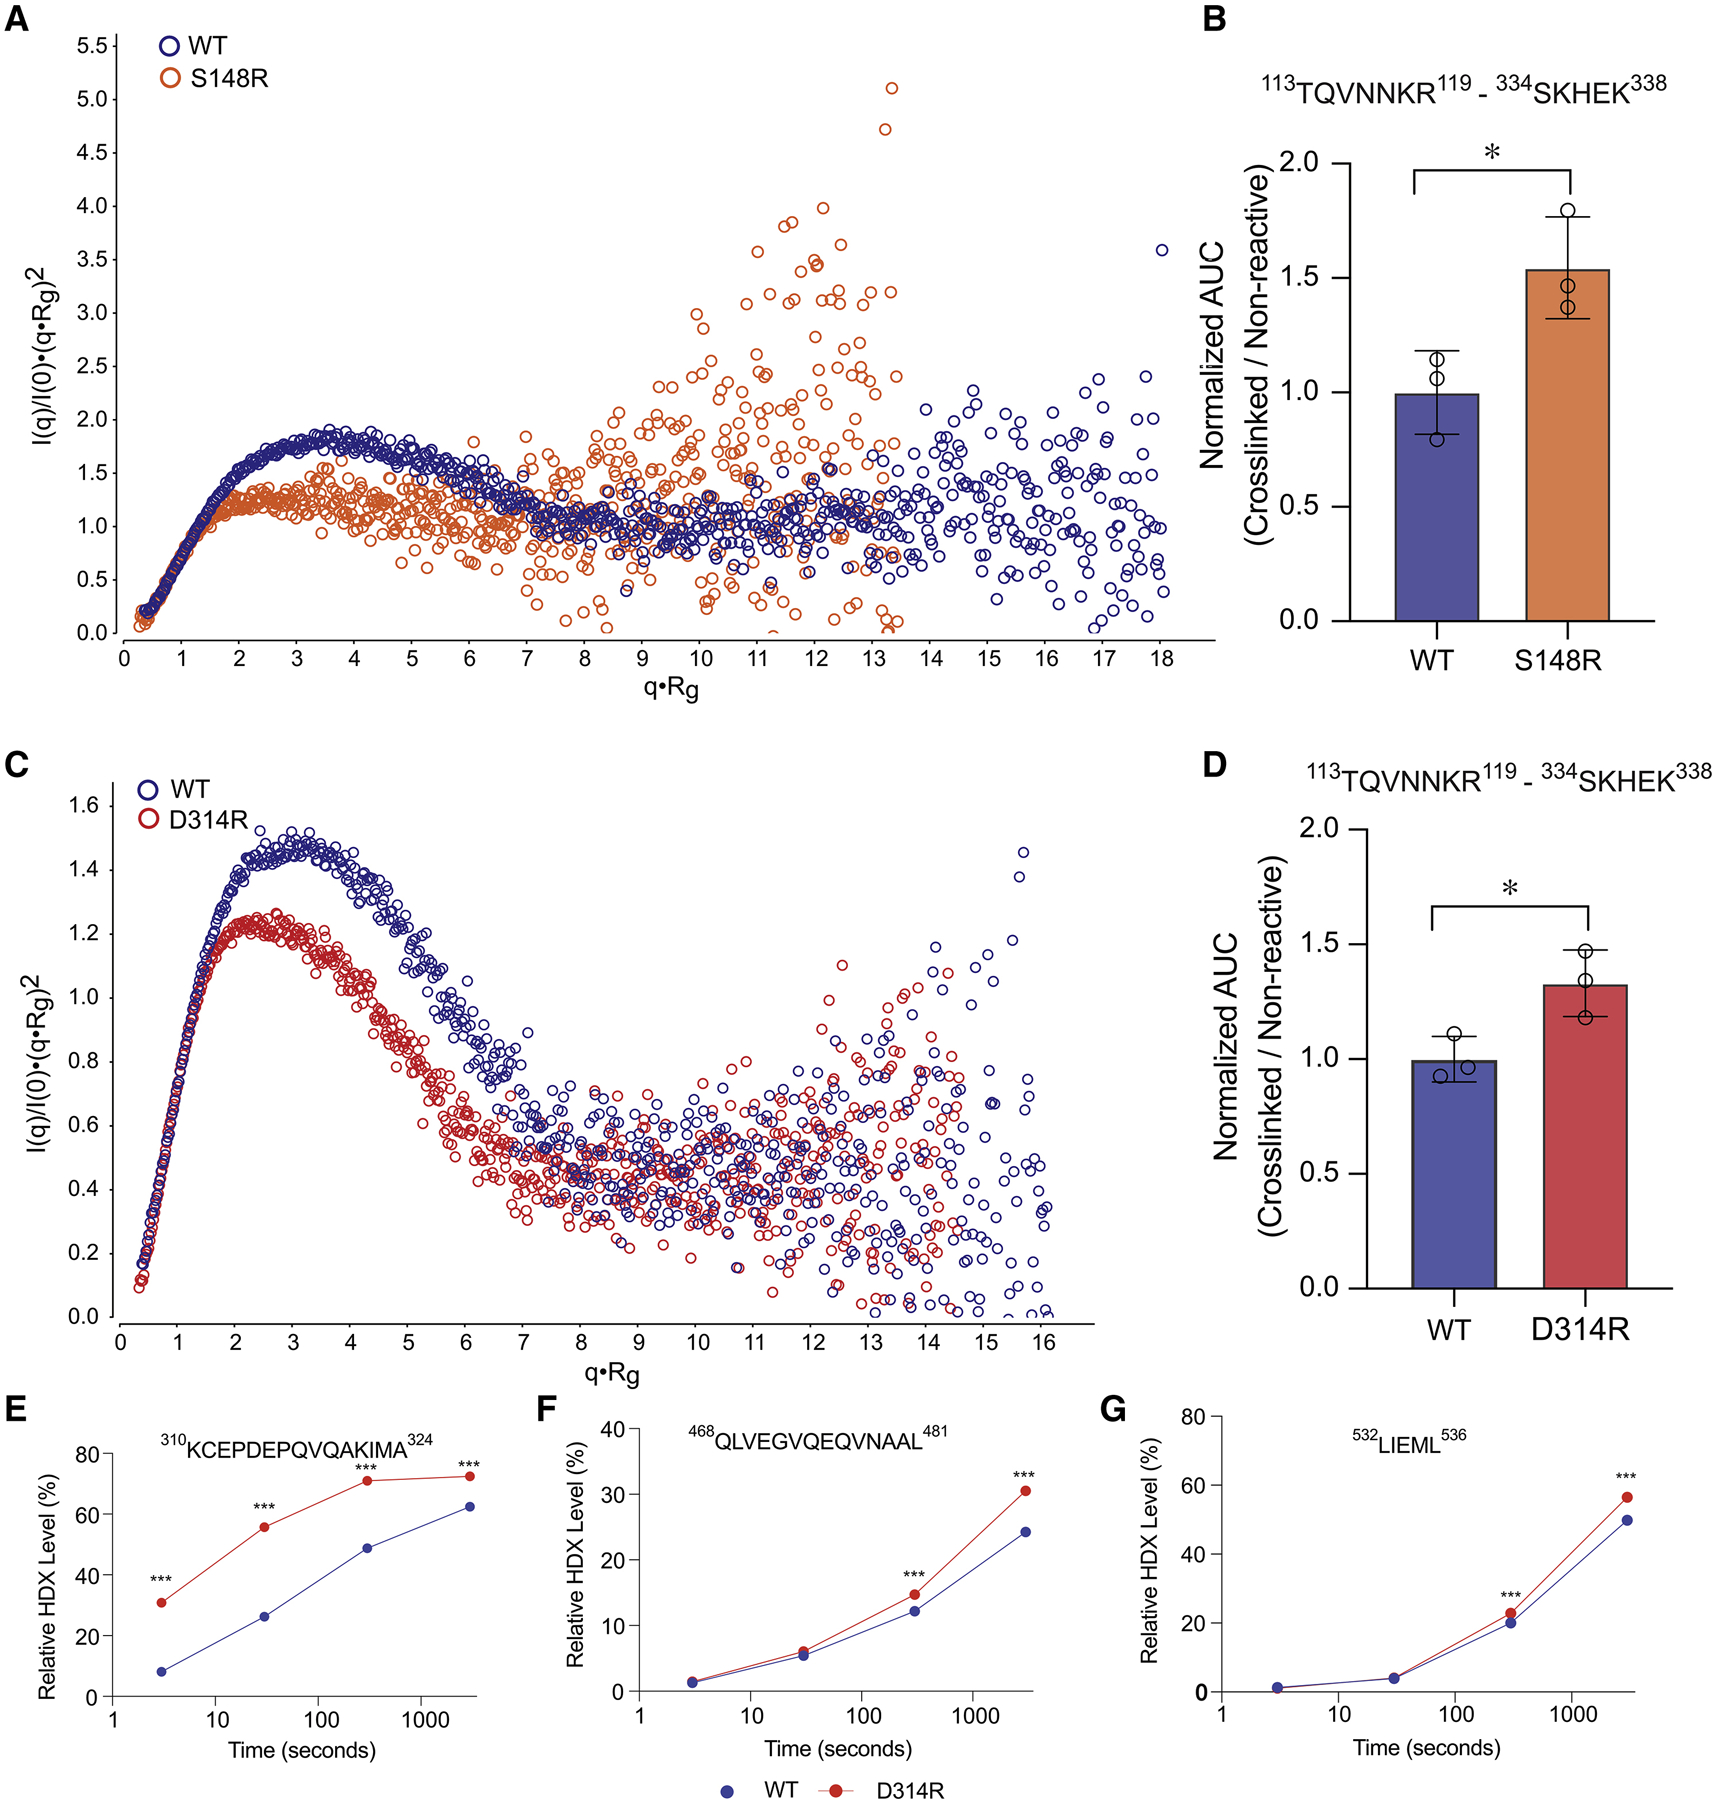
Normalized Kratky plots derived from SEC-SAXS of mutants S148R (A) and D314R (C) compared to WT. Quantitative XL-MS analysis of K118-K335 interdomain BS3 crosslink comparing S148R (B) or D314R (D) to WT LRH-1 peptide abundance. *P<0.05. HDX profiles for peptides shown to have differential solvent exchange between WT and the D314R (E-G). ***P<0.0001.
Binding of Dax-1 alters LRH-1FL conformational dynamics and transcriptional activity while binding of β-catenin does not :
Previously reported crystal structures of the LRH-1 LBD bound to interactors such as DAX-1 (Sablin et al., 2008) and β-catenin (Yumoto et al., 2012) suggest certain transcriptional co-regulators may affect the conformational state of LRH-1 predicted by the integrated structural model. A co-crystal structure of the LRH-1 LBD complexed to Dax-1 (NR0B1), a noncanonical nuclear receptor lacking a DNA-binding domain and co-repressor of LRH-1, revealed a stoichiometry of two Dax-1 LBDs interact with one LRH-1 LBD (Figure 8C). In this model, the Dax-1 unit 1 repression helix interacts with LRH-1 LBD helices 3,4, and 12, while DAX-1 unit 2 interacts with LRH-1 LBD helices 7 and 11. Alignment with the LRH-1FL model reveals a putative large steric clash between Dax-1 unit 1 and the LRH-1 DBD, suggesting these states to be mutually exclusive, potentially causing LRH-1 to be forced into a “bead-on-a-string” like state (Figure 8D). This analysis further suggests Dax-1 not only competes for occupancy of helix 12 but would disrupt DBD-LBD communication. In contrast, a co-crystal structure of the LRH-1 LBD complexed to β-catenin, a noncanonical co-activator of LRH-1, revealed the interaction to be mediated by helices 9 and 10 (Figure S9E). Alignment with the LRH-1FL model reveals helices 9 and 10 are predicted to be accessible for β-catenin to bind LRH-1 while the LBD and DBD could still interact in the range of conformations predicted by Rosetta docking and MD (Figure S9F).
Figure 8: LRH-1 inter-domain interactions are altered by DAX-1 and influence DAX-1 regulation of LRH-1 activity.
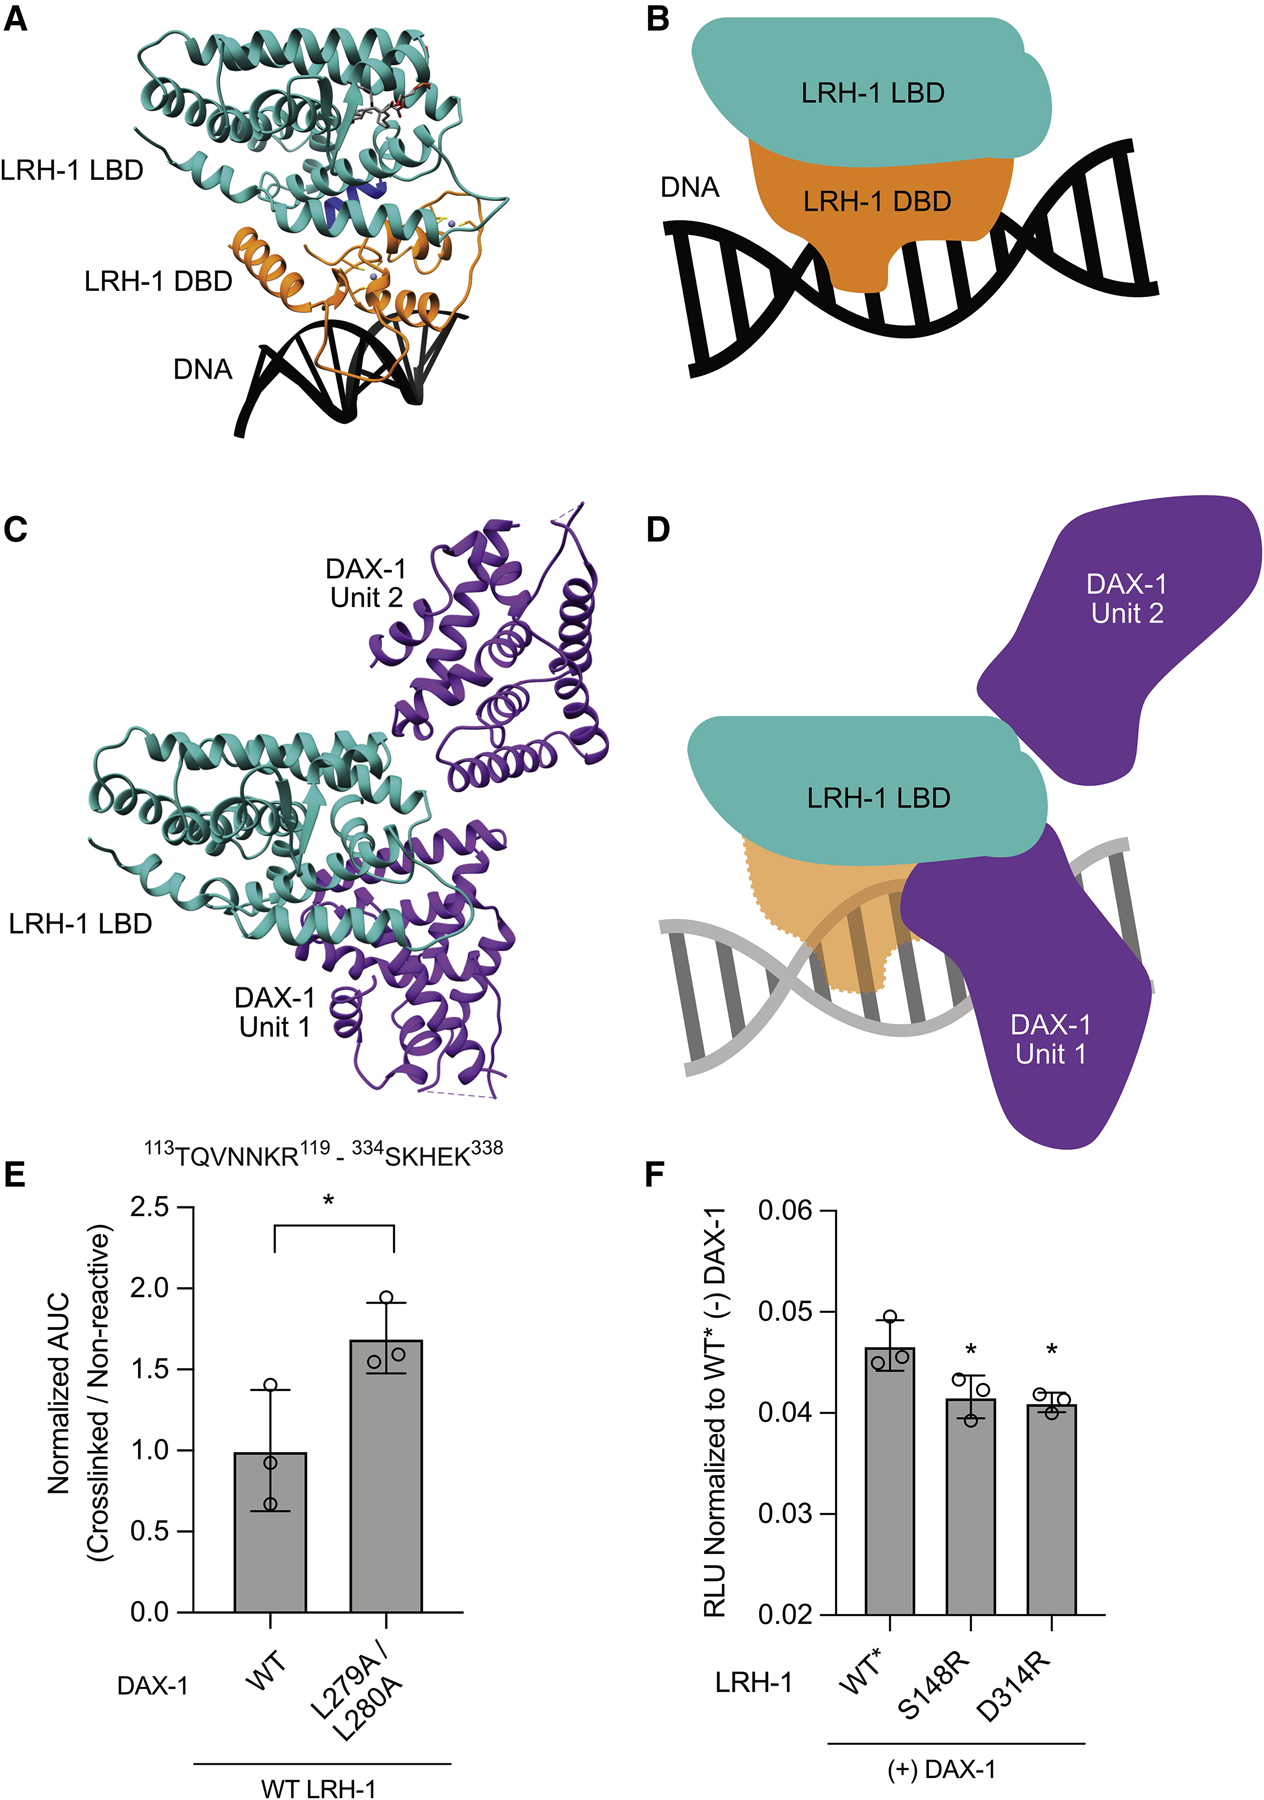
Side view of (A) the LRH-1FL integrated model, and (C) the LRH-1 LBD:DAX-1 (PDB: 3F5C) co-crystal structure. Schematic cartoon depictions are shown in (B) and (D). (E) Quantitative XL-MS analysis of LRH-1 K118-K335 interdomain BS3 crosslink abundance compared between complexes containing WT LRH-1FL and WT or mutant DAX-1. *P<0.05. (F) LRH-1 mutational analysis with DAX-1 co-transfection in luciferase reporter gene activation assays. Data are the combined results of three independent experiments plotted as the mean ± SD. *P<0.05.
To interrogate whether these structural comparisons can predict changes in LRH-1FL conformational dynamics in the presence of those transcriptional co-regulators, we performed quantitative XL-MS studies using the K118-K335 BS3 inter-domain crosslink as a surrogate of LRH-1 DBD/LBD proximity. Consistent with our hypothesis, binding of WT Dax-1 results in ~40% reduction in crosslink formation compared to a Dax-1 mutant lacking residues in a critical helix necessary for binding the LRH-1 LBD (Figure 8E). Additionally, comparison between LRH-1 complexes containing WT β-catenin and a β-catenin mutant with a decreased ability to bind LRH-1 resulted in no detectable change in K118-K335 crosslink formation (Figure S9G). Together, these data confirm binding of certain transcriptional co-regulators alters the quaternary dynamics of LRH-1, a prediction made possible by the LRH-1FL integrated structural model.
To probe whether the ability of Dax-1 and β-catenin to influence LRH-1 transcription is dependent on the model-predicted DBD-LBD domain interaction, we performed cellular transcription assays for Site 1 (D314R) and Site 2/3 (S148R) LRH-1 mutants in the presence of those co-regulators. Surprisingly, Dax-1 exhibited a slightly increased ability to repress transcriptional activity for LRH-1 mutants D314R and S148R (Figure 8F). In contrast, overexpression of a constitutively active form of β-catenin (S33Y) did not affect transcriptional output of those LRH-1 mutants (Figure S9H). Together, these data suggest LRH-1 DBD-LBD interactions alter the ability of Dax-1 to regulate LRH-1 dependent transcription while these interactions do not alter β-catenin activity.
Discussion:
Given the biomedical implications of LRH-1, we initially attempted to develop three-dimensional models via traditional structural determination methods (X-ray crystallography and electron microscopy). These attempts were unsuccessful. To circumvent these challenges, we obtained several in-solution biophysical restraints and in combination with advanced molecular modeling were able to arrive at an integrated model that predicted several inter-domain structural interactions with functional implications. Although a reasonable hypothesis regarding the general DBD-LBD orientation was possible without advanced computational modeling, design of loss of function mutants targeted to disrupt the DBD-LBD interface required the integration of experimental data.
Our structural and functional analysis of LRH-1FL has revealed an inter-domain interaction between the DBD and LBD that utilizes surfaces unique to the NR5A subclass of nuclear receptors and is modulated by certain transcriptional co-regulators. Given LRH-1 is monomeric, lacking a partner nuclear receptor to stabilize the overall architecture, and ~30% of the protein is constituted by predicted unstructured regions, the integrated model likely predicts a state that is short lived on biological time scales. This is supported by the modest changes observed in deuterium exchange in LRH-1FL, although these sites largely influence the global ensemble of LRH-1 given the large structural changes observed in the S148R and D314R mutant SAXS curves. Additionally, these regions may be regulated in some fashion not predicted by the integrated model, as decreasing the positive charge of the FTZ-F1 helix by mutations R174D, R174E/D314E, and K179A/K182A/K183A increased LRH-1 dependent transcriptional responses. Previous reports have shown a small, highly basic, transcriptional co-activator MBF-1/EDF-1 is able to associate with the LRH-1 FTZ-F1 helix in vitro and increase LRH-1 dependent transcriptional activity in cellular luciferase reporter assays (Brendel, Gelman and Auwerx, 2002). It is possible the increase in LRH-1 dependent transcriptional activity observed with these mutants is due to increased association with an MBF-1 like co-activator due to the decreased positive character of the FTZ-F1 helix, independent of the state predicted by the integrated model.
Previous studies on dimeric nuclear receptors have demonstrated certain small molecule modulators, which bind the LBD, allosterically communicate to DBD interdomain residues to alter overall receptor function (Chandra et al., 2017b). Recent studies have successfully developed an efficacious and selective small molecule LRH-1 agonist (Mays et al., 2019). This comprehensive structure-based drug design effort attributed the observed increases in efficacy, in part, due to increases in communication between LBD helices 4–6 and 12. In light of our LRH-1FL integrated structural model, future efforts are necessary to determine whether the observed increases in agonist potency in cellular transcriptional assays may also be in part due to increased interdomain communication. Putative allosteric signatures unique to the intact receptor may provide insight into further rational improvement of LRH-1 small molecule modulators.
In summary, we describe a structural model of a full-length monomeric nuclear receptor in association with DNA and a co-activator peptide based on low-resolution solution-based biophysical techniques and computational modeling. The model predicted several inter-domain interactions between the LRH-1 DBD and LBD (Figure 3,4). These interactions were confirmed to influence LRH-1FL structure and function (Figure 5,6), although it remains to be seen how these interactions affect LRH-1 recruitment and transcription at a genomic level. Further, this work shows the DBD FTZ-F1 helix serves as a docking surface for LBD helix 2, rationalizing the functional affects observed in previous studies showing the structural integrity of the DBD FTZ-F1 helix is required for LRH-1 transactivation (Solomon et al., 2005). Although LRH-1 and SF-1 share high sequence identity in the DBD and LBD, initial mutational analysis in transcriptional assays showed SF-1 sites analogous to S148 (T75) and D314 (D236) do not alter SF-1 dependent transcriptional responses (Figure S9I). These initial studies suggest inter-domain organization may not be conserved between LRH-1 and SF-1. Further, these differences may be due to the large sequence divergence observed in the hinge region connecting the DBD and LBD although additional rigorous structural and functional studies are necessary to validate these early observations. Given LRH-1 and SF-1 are the only two members of the NR5A subclass, it remains to be seen if inter-domain interactions and communication occur in other monomeric nuclear receptors as they do not possess the FTZ-F1 docking helix. Overall, this work confirms inter-domain communication occurs within a monomeric nuclear receptor and adds another structural model to the growing number of nuclear receptors characterized in intact states.
STAR Methods:
Resource Availability:
Lead Contact
Requests for resources should be directed to Lead Contact, Raymond D. Blind (ray.blind@vanderbilt.edu).
Materials Availability:
All unique/stable reagents generated in this study are available from the Lead Contact with a completed Materials Transfer Agreement.
Data and Code Availability
The integrative LRH-1 model is available from PDB-Dev under accession number PDBDEV_00000035. SAXS data of full-length LRH-1 are available from SASBDB under accession number SASDG85. HDX-MS data, PDB coordinates of LRH-1 starting models, and Rosetta calculation scripts are available under https://doi.org/10.5281/zenodo.3405545.
Experimental Model and Subject Details:
Bacterial Strains:
Escherichia coli BL21 dE3 Chemically Competent Cells (Novagen), BL21 AI, and Origami 2 dE3 strains used for protein production were cultured in TB media and were supplemented with appropriate antibiotics. Escherichia coli DH5α used for plasmid production were cultured in TB media supplemented with appropriate antibiotics.
Human HEK293T Cells:
HEK293T cells (Homo sapiens female, kidney, ATCC® CRL-3216) were cultured in DMEM supplemented with 10% FBS and penicillin-streptomycin antibiotic solution.
Method Details
Constructs and Reagents:
Chemicals were purchased from FisherScientific, Sigma-Aldrich, or Promega. pRSF2 full-length human LRH-1 construct was a gift from Robert Fletterick (University of California at San Francisco). CYP17A1 firefly luciferase reporter construct was a gift from Holly Ingraham (University of California at San Francisco). Full-length human LRH-1 CMV mammalian expression vector, T7-inducible LRH-1 DBD bacterial expression vector, arabinose-inducible LRH-1 LBD bacterial expression vector, T7-inducible mouse Dax-1 WT and L279A/L280A bacterial expression vectors, and T7-inducible human β-catenin R1C Y306A/K345A/W383A bacterial expression vector was purchased from VectorBuilder (Chicago, IL). Mutagenesis of CMV-LRH-1, pRSF2-LRH-1, and LRH-1 LBD constructs were performed by Genewiz (South Plainfield, NJ). CYP7A1 promoter DNA oligonucleotide was synthesized by IDT (Coralville, IA). PGC1α co-activator peptide was synthesized by New England Peptide (Gardner, NJ).
Protein Expression and Purification:
Full-length wildtype and mutant versions of human LRH-1 (aa 1–541, UniprotKB O00482) were expressed via pRSF2 vector and were carried out similar to previous studies (Suzawa et al., 2015). Briefly, BL21 dE3 E. coli was transformed with pRSF2 full-length LRH-1, grown at 37 °C until OD600 =0.8, and induced with 250 μM IPTG at 15 °C for 16–18 hours. Cells were centrifuged at 4,000xg at 4 °C for 20 minutes, washed with PBS, centrifuged again at 4,000 xg at 4 °C for 20 minutes, and stored at −80 °C. Cells were resuspended in Buffer A (20 mM TRIS pH 7.5, 300 mM NaCl, 5% v/v glycerol, 20 mM imidazole, 2 mM CHAPS) supplemented with cOmplete Protease tablets (Roche, Indianapolis, IN), sonicated for 10 minutes at 4 °C, and centrifuged at 16,000xg for 20 minutes at 4 °C. Supernatant was incubated with TALON® metal affinity resin (Clontech) for 30 minutes, washed with 50 column volumes of Buffer A +1 mM ATP + 5 mM MgCl2, loaded onto a gravity column and washed with 50 column volumes of Buffer A, and eluted with 10 mL Buffer A + 200 mM imidazole. Eluant was dripped directly into 25 mL Buffer B (20 mM TRIS pH 7.5, 5% v/v glycerol, 2 mM) containing an additional cOmplete protease inhibitor tablet and 125 μL of 0.5 mM CYP7A1 DNA oligo (Forward 5’-GTTCAAGGCCAG-3’; Reverse 5’-CTGGCCTTGAAC-3’). Protein solution (~35 mL) was concentrated to ~0.5 mL using Amicon® Ultra 10K concentrators and loaded onto a Superdex 200 size exclusion column equilibrated in buffer necessary for subsequent experiments. Elution fractions corresponding to the expected molecular weight of LRH-1 with CYP7A1 DNA were collected, and the protein was concentrated using 0.5 mL Amicon ® Ultra 10K filter and flash frozen for storage at −80 °C.
LRH-1 LBD (aa 266–541, UniprotKB O00482) was expressed from arabinose-inducible vector with an N-terminal His-TEV tag purchased from VectorBuilder. Briefly, BL21 AI E. coli was transformed with His-TEVLBD vector, grown at 37 °C until OD600 =0.8, and induced with 0.2% w/v arabinose at 15 °C for 16–18 hours. Cells were centrifuged at 4,000xg at 4 °C for 20 minutes, washed with PBS, centrifuged again at 4 °C for 20 minutes, and stored at −80 °C. Cells were resuspended in Buffer A (20 mM TRIS pH 7.5, 300 mM NaCl, 5% v/v glycerol, 20 mM imidazole, 2 mM CHAPS) supplemented with cOmplete Protease tablets (Roche, Indianapolis, IN), sonicated for 10 minutes at 4 °C, and centrifuged at 16,000xg for 20 minutes at 4 °C. Supernatant was incubated with TALON® metal affinity resin (Clontech) for 30 minutes, washed with 50 column volumes of Buffer A, loaded onto a gravity column, washed with an additional 50 column volumes of Buffer A, and eluted with Buffer A + 200 mM imidazole. Protein solution was concentrated to ~0.5 mL using Amicon® Ultra 10K concentrators and loaded onto a Superdex 75 size exclusion column equilibrated in 20 mM TRIS pH 7.5, 5% v/v glycerol, 150 mM NaCl, 0.5 mM CHAPS. Elution fractions corresponding to the expected size of the LBD were collected, and the protein was concentrated using 0.5 mL Amicon ® Ultra 10K filter and flash frozen for storage at −80 °C.
LRH-1 DBD (aa 79–187, UniprotKB O00482) was expressed from IPTG-inducible vector with an N-terminal His-MBP-TEV tag purchased from VectorBuilder. Briefly, BL21 dE3 E. coli was transformed with His-TEVLBD vector, grown at 37 °C until OD600 =0.8, and induced with 1 mM IPTG at 15 °C for 16–18 hours. Cells were centrifuged at 4,000xg at 4 °C for 20 minutes, washed with PBS, centrifuged again at 4 °C for 20 minutes, and stored at −80 °C. Cells were resuspended in Buffer A (20 mM TRIS pH 7.5, 300 mM NaCl, 5% v/v glycerol, 20 mM imidazole, 2 mM CHAPS) supplemented with cOmplete Protease tablets (Roche, Indianapolis, IN), sonicated for 10 minutes at 4 °C, and centrifuged at 16,000xg for 20 minutes at 4 °C. Supernatant was incubated with TALON® metal affinity resin (Clontech) for 30 minutes, washed with 50 column volumes of Buffer A, loaded onto a gravity column, washed with an additional 50 column volumes of Buffer A, and eluted with Buffer A + 200 mM imidazole. Protein solution was digested with 1/20 TEV ratio in the presence of 1 mM DTT for 16–18 hours, concentrated to ~0.5 mL using Amicon® Ultra 10K concentrators, and loaded onto a Superdex 75 size exclusion column equilibrated in 20 mM TRIS pH 7.5, 5% v/v glycerol, 150 mM NaCl, 0.5 mM CHAPS. Elution peaks corresponding to the expected molecular weight of the DBD were collected, and the protein was concentrated using 0.5 mL Amicon ® Ultra 10K filter and flash frozen for storage at −80 °C.
His-tagged versions of WT and L279A/L280A mouse Dax-1 (aa 205–472, UniprotKB Q61066) were expressed from IPTG-inducible vectors purchased from VectorBuilder. Briefly, BL21 dE3 E. coli was transformed with His-DAX-1 vector, grown at 37 °C until OD600 =0.8, and induced with 100 μM IPTG at 15 °C for 16–18 hours. Cells were centrifuged at 4,000xg at 4 °C for 20 minutes, washed with PBS, centrifuged again at 4 °C for 20 minutes, and stored at −80 °C. Protein was purified as per the same protocol as LRH-1 LBD.
Human β-catenin R1C (aa 79–187, UniprotKB P35222) was expressed from IPTG-inducible vector with an N-terminal His-TEV tag (WT purchased from Addgene Vector No.17200) (Y306A/K345A/W383A triple mutant purchased from VectorBuilder). Briefly, BL21 dE3 E. coli was transformed with His-DAX-1 vector, grown at 37 °C until OD600 =0.8, and induced with 250 μM IPTG at 15 °C for 16–18 hours. Cells were centrifuged at 4,000xg at 4 °C for 20 minutes, washed with PBS, centrifuged again at 4 °C for 20 minutes, and stored at −80 °C. Protein was purified as per the same protocol as LRH-1 LBD.
BS3 Crosslink Identifications via Mass Spectrometry:
For BS3 (bis(sulfosuccinimidyl)suberate) crosslinking reactions, full-length LRH-1/CYP7A1 complex was prepared in crosslinking buffer (20 mM HEPES, 150 mM NaCl, 5% glycerol). BS3 crosslinker was freshly dissolved in crosslinking buffer at a final concentration of 2.5 mM. 5 μM full-length LRH-1/CYP7A1 complex with 25 μM PGC1α peptide was incubated on ice for 15 minutes to allow for complex to form. BS3 crosslinker was added to solution at a final concentration of 250 μM and allowed to react for 1–2 hours at 4 °C. Reactions were quenched for 15 minutes at room temperature with the addition of 50 mM TRIS pH 7.5. Control reactions were performed in tandem without the addition of BS3 crosslinker. Reactions were separated via SDS-PAGE to separate monomeric species from aggregates. Monomeric protein bands were excised and subjected to in-gel trypsin digestion. Peptides were autosampled onto a 200 mm by 0.1 mm (Jupiter 3 micron, 300A), self-packed analytical column coupled directly to a QExactive mass spectrometer (ThermoFisher) using a nanoelectrospray source and resolved using an aqueous to organic gradient. Tandem MS/MS (MS2) spectra were collected in a data dependent manner over the course of a 70 min gradient using a full MS1 resolution of 70,000, 1e6 AGC target and MS2 resolution of 17,500, 1e5 AGC target with a loop count of 20.
To identify cross-linked peptides, spectra were extracted into MGF format, and analyzed via pLink2 with the following parameters- MS1 tolerance: 15 ppm; MS2 tolerance: 25 ppm; missed trypsin cleavage: 3; oxidation of methionine: variable; carbamidomethylation of cysteine: fixed; BS3 specificity: N-terminal amine or lysine (Chen et al., 2019). Positive crosslink identifications via pLink2 were confirmed to not be present in control reaction and exhibit idot product mass predictions >0.90 via analysis of extracted ion chromatograms using Skyline (MacLean et al., 2010).
LRH-1 Inter-domain BS3 Crosslink validation via +/− PGC1α peptide:
K118-K335 inter-domain crosslink was further verified by performing additional reactions as previously described +/− BS3 crosslinker in the presence and absence of 25 μM PGC1α peptide. Reactions were performed in triplicate for 1 hour at 4 °C, quenched with 50 mM TRIS pH 7.5 at room temperature, separated via SDS-PAGE, and subjected to in-gel trypsin digestion. Mass spectral data were collected as described above with the following differences. Data were acquired on a QExactive plus mass spectrometer (ThermoFisher) with an MS1 AGC target of 3e6.
MS-1 parent ion peaks of inter-domain crosslink were extracted via Skyline (MacLean et al., 2010) and normalized to a non-reactive peptide peak (28RHGSPIPARG37). AUCs were compared using a two-tailed t-test with GraphPad Prism 8 (GraphPad Software, Inc. La Jolla, CA).
LRH-1 Inter-domain BS3 Crosslink quantitation for S148R and D314R mutants:
K118-K335 inter-domain crosslink levels were quantitated as described in +/− PGC1α peptide experiments, with the exception of all were conducted in the absence of the PGC1α peptide.
LRH-1 Inter-domain BS3 Crosslink quantitation in the presence of WT and mutant DAX-1:
K118-K335 inter-domain crosslink levels were quantitated as described in +/− PGC1α peptide experiments, with the following exceptions: 1) LRH-1 was present at final concentration of 2.5 μM and WT or mutant DAX-1 was present at final concentration of 10 μM and 2) samples were processed using S-trap spin columns with trypsinization rather than being run through SDS-PAGE excised, and in-gel trypsinized.
LRH-1 Inter-domain BS3 Crosslink quantitation in the presence of WT and mutant β-catenin R1C:
K118-K335 inter-domain crosslink levels were quantitated as described in +/− PGC1α peptide experiments, with the following exceptions: 1) LRH-1 was present at final concentration of 2.5 μM and β-catenin R1C was present at final concentration of 5 μM, and 2) samples were processed using S-trap spin columns with trypsinization rather than being run through SDS-PAGE excised, and in-gel trypsinized.
Benzophenone Crosslinking Mass Spectrometry:
For production of A324BpF full-length LRH-1, the following modifications were made to the full-length LRH-1 production and purification protocol. pRSF2 LRH-1 A324BpF was co-transformed with pEVOL-pBpF into BL21 dE3 E. coli (Chin et al., 2002). Cultures were grown as previously described except for the addition of 0.2% arabinose upon IPTG induction, in addition to the cultures being grown in the dark. Purification was conducted as previously described except for protein was kept in the dark, including FPLC purification with A280 lamp off. Protein was flash frozen for storage at −80 °C.
Photo-crosslinking reactions were performed in crosslinking buffer with 5 μM full-length LRH-1/CYP7A1 complex with 25 μM PGC1α peptide and placed in 96 well plates (total volume 50 μL). Reactions were conducted on ice at 4 °C and initiated via exposure to 365-nm light for 3 hours by placement under a Black-Ray 100 Watt UV lamp. Control reactions were simultaneously kept in the dark on ice at 4 °C. Reactions were separated via SDS-PAGE, excised, and subjected to in-gel trypsin digestion. Mass spectral data were collected as described above with the following differences. Data were acquired on a QExactive plus mass spectrometer (ThermoFisher) with an MS1 AGC target of 3e6 and a repeat count of 15.
To identify cross-linked peptides, spectra were extracted into MGF format, and analyzed via CrossFinder with the following parameters- MS1 tolerance: 15 ppm; MS2 tolerance: 25 ppm; missed trypsin cleavage: 3; oxidation of methionine: variable; carbamidomethylation of cysteine: fixed, BpF specificity: non-specific (Mueller-Planitz, 2015). Positive crosslink identifications via CrossFinder were compared to control reactions via analysis of ion chromatograms using Skyline (MacLean et al., 2010).
Q126C/Y528C Engineered Disulfide Detection:
For production of Q126C/Y528C full-length LRH-1, the previous protocol was followed except for protein was expressed in Origami 2 dE3 E. coli. Purified protein was taken directly off S200 size exclusion column and was split into +/− 10 mM DTT. The following extraction was performed in duplicate for each sample group. Protein sample was treated with 100% TCA to a final concentration of 25% TCA overnight to precipitate protein. Samples were centrifuged at 16,000 xg 4 °C for 30 minutes. Pellets were washed with cold acetone, resuspended in solubilization buffer (100 mM TRIS pH 6.5, 8 M urea), and reacted with 2 mM N-ethylmaleimide for 2 hours at 37 °C. Samples were then diluted to 2 M urea with 100 mM TRIS pH 6.5 and treated with 1/20 w/w trypsin for 12 hours. Samples were next diluted to 1 M urea with 100 mM TRIS pH 6.5 and treated with 1/40 w/w GluC for 12 hours. Reactions were quenched with 5% formic acid and stored until further processing. Mass spectral data were collected as described above with the following differences. Data were acquired on a QExactive plus mass spectrometer (ThermoFisher) at 140,000 with an MS1 AGC target of 3e6, an MS2 AGC target of 5e4, and a repeat count of 15.
To identify cross-linked peptides, spectra were extracted into MGF format, and analyzed via pLink2 with the following parameters- MS1 tolerance: 15 ppm; MS2 tolerance: 25 ppm; missed protease cleavage: 3; N-ethylmaleimide modification of cysteine: variable. Crosslink identifications via pLink2 were further filtered for monocrosslink identifications with 1 or less missed cleavage site (Trypsin or GluC) per peptide. Positive crosslinks were confirmed to not be present in control reaction with DTT, exhibited idot product mass predictions >0.90, and had MS2 spectra with the major fragmentation ions series identified via analysis of extracted ion chromatograms using Skyline (MacLean et al., 2010) and fragmentation pattern analysis via pLink-SS (Lu et al., 2015) and xiSPEC (Kolbowski, Combe and Rappsilber, 2018).
Hydrogen-Deuterium Exchange Mass Spectrometry:
HDX-MS reactions were performed in a similar manner as described previously (Jenkins et al., 2018; Lučić et al., 2018). In brief, HDX reactions for the isolated domains experiments were conducted in a final reaction volume of 50μL with a molar quantity of 30pmol of intact, full-length WT LRH-1, LRH-1 DBD, or LRH-1 LBD, all expressed in bacteria. The reaction was started by the additions of 48.5 μL of D2O buffer (100mM NaCl, 50mM pH7.5 HEPES, 89% D2O (V/V)) to 1.5 μL of protein solution (final D2O concentration of 86%). The reaction allowed to proceed for 3s at 4°C (referred to as 0.3 sec in figures, as this is roughly the temperature corrected exchange time for 20°C), and 3, 30, 300, or 3000 s at 20°C, before being quenched with ice cold acidic quench buffer, resulting in a final concentration of 0.6M guanidine-HCl and 0.9% formic acid post quench. HDX-MS experiments for LRH-1 in the presence of PGC1a coregulator peptide were conducted in the same manner, with the exception being that the final reaction volume was 15μL with a molar quantity of 31pmol of full length LRH-1. Protein was then incubated with 300pmol of PGC1a peptide or an equivalent volume of buffer for two minutes prior to the addition of D2O buffer (final D2O concentration of 83% in the 15 μL reaction). HDX-MS experiments for comparing LRH-1 to LRH-1 D314R were conducted in the same manner as the others but with a final reaction volume of 10 μL with a molar quantity of 31 pmol of LRH-1 and LRH-1 D314R. The reaction was started by adding 9μL of D2O buffer to 1 μL of protein, resulting in a final D2O concentration of 80%.HDX-MS experiments for comparing full-length WT and D314R LRH-1 were conducted in the same manner as all other HDX experiments with the exception of a final reaction volume of 10 μL and molar quantity of 31 pmol of LRH-1. The reaction was initiated with the addition of 9 μL of D2O buffer to 1 μL of protein, resulting in a final D2O concentration of 80%.HDX-MS experiments for comparing LRH-1 to LRH-1 D314R were conducted in the same manner as the others but with a final reaction volume of 10 μL with a molar quantity of 31 pmol of LRH-1 and LRH-1 D314R. The reaction was started by adding 9μL of D2O buffer to 1 μL of protein, resulting in a final D2O concentration of 80%HDX-MS experiments for comparing LRH-1 to LRH-1 D314R were conducted in the same manner as the others but with a final reaction volume of 10 μL with a molar quantity of 31 pmol of LRH-1 and LRH-1 D314R. The reaction was started by adding 9μL of D2O buffer to 1 μL of protein, resulting in a final D2O concentration of 80% All conditions and timepoints were created and run in triplicate. Samples were flash frozen immediately after quenching and stored at −80°C until injection onto the ultra-performance liquid chromatography (UPLC) system for proteolytic cleavage, peptide separation, and injection onto a QTOF for mass analysis, described below.
Protein samples were rapidly thawed and injected onto a UPLC system kept in a Peltier driven cold box at 2°C (LEAP). The protein was run over two immobilized pepsin columns (Applied Biosystems; Porosyme 2-3131-00) and the peptides were collected onto a VanGuard Precolumn trap (Waters). The trap was eluted in line with an ACQUITY 1.7 μm particle, 100 × 1 mm2 C18 UPLC column (Waters), using a gradient of 5%−36% B (Buffer A 0.1% formic acid, Buffer B 100% acetonitrile) over 16 min. MS experiments were performed on an Impact HD QTOF (Bruker) and peptide identification was done by running tandem MS (MS/MS) experiments run in data-dependent acquisition mode. The resulting MS/MS datasets were analyzed using PEAKS7 (PEAKS) and a false discovery rate was set at 1% using a database of purified proteins and known contaminants. HDExaminer Software (Sierra Analytics) was used to automatically calculate the level of deuterium incorporation into each peptide. All peptides were manually inspected for correct charge state and presence of overlapping peptides. Deuteration levels were calculated using the centroid of the experimental isotope clusters. Differences in exchange in a peptide were considered significant if they met all three of the following criteria: > 5% change in exchange, > 0.4 Da mass difference in exchange, and a p-value < 0.01 using a two-tailed Student’s t-test. Peptides were included in modeling if 1) >5% decreased in HDX was observed on multiple peptides, 2) a change being observed at similar time points (300 or 3,000 seconds) and 3) either a p-value < 0.01 using a two-tailed Student’s t-test or > 0.4 Da mass difference in exchange. The full set of HDX-MS source data is provided in the supplement and at https://doi.org/10.5281/zenodo.3405545. In addition, a summary table of all HDX-MS processing parameters is included as described in (Masson et al., 2019).
Small Angle X-ray Scattering Data Collection and Analysis:
SAXS data were collected at the SIBYLS beamline 12.3.1 of the Advanced Light Source at the Lawrence Berkeley National Laboratory (Classen et al., 2013; Dyer et al., 2014) using 1.127 Å wavelength and Pilatus 2M detector at a 2.105-m sample-to-detector distance, with resulting scattering vectors (q = 4π sinθ / λ, where 2θ is the scattering angle) ranging from 0.01 to 0.4 Å−1. SEC in line with SAXS was performed to ensure the aggregation-free state of the sample. A Shodex KW-802.5 SEC column was pre-equilibrated with either 20 mM TRIS pH 7.5, 150 mM NaCl, 2% glycerol, 0.5 mM CHAPS, 5 mM DTT or 10 mM Na-phosphate pH 7.0, 100 mM NaCl with a flow rate of 0.5 mL/min. 100 μL sample (7.5 mg/mL) was run through the SEC and 3 second X-ray exposures were collected continuously during a ~25 minute elution. The SAXS frames recorded prior to the protein elution peak were used to subtract all other frames. The background-subtracted frames were investigated by Rg and scattering intensity at q = 0 Å−1 (I(0)) derived via the Guinier approximation I(q) = I(0) exp(−q2Rg2/3) with the limits qRg <1.3. Data were processed using SCÅTTER3.0 for buffer subtraction and ATSAS 2.8.4 for particle parameter analysis. Experimental data were analyzed using the ATSAS software suite (Franke et al., 2017) with the PRIMUS (Konarev et al., 2003) and GNOM (Svergun, 1992) modules.
Computational docking of LRH-1 DBD and LBD:
Molecular models of the DBD-LBD complex of LRH-1 were developed by computational docking with Rosetta (version 3.10) (Leaver-Fay et al., 2011) integrating restraints from BS3 crosslinking, H/D exchange (HDX), and SAXS (Figure S3). Prior to docking, crystal structures of the DNA-bound DBD (PDB: 2A66) (Solomon et al., 2005) and the P6L ([(2S)-3-[[(2R)-2,3-dihydroxypropoxy]-hydroxy-phosphoryl] oxy-2-hexadec-6-enoyloxy-propyl] octadec-8-enoate)- and PGC1α-bound LBD (PDB: 1YOK for LBD, PBD: 5UNJ for PGC1α) (Krylova et al., 2005; Mays et al., 2017) were energy-minimized with Rosetta using the Ref2015 (Alford et al., 2017) energy function. Missing LBD residues K335, H336, and E337 were added by comparative modeling based on another LRH-1 LBD crystal structure (PDB: 4DOS) (Musille et al., 2012b) using RosettaCM (Song et al., 2013). The structure of the DBD was extended by one additional N-terminal residue (E83) and six C-terminal residues (K179-A184) guided by the structure of the homologous SF-1 protein (PDB: 2FF0, 92% sequence identity to human LRH-1) (Tanya H Little et al., 2006) and PSIPRED (Jones, 1999) secondary structure prediction using RosettaRemodel (Huang et al., 2011). This was done to stabilize the structure of the C-terminal helix in the DBD because preliminary MD simulations had indicated that this helix lacked interaction with the rest of the DBD and was prone to unwinding in MD. Conformations of the P6L ligand were calculated with BCL::CONF generator (Kothiwale, Mendenhall and Meiler, 2015), and a library of 2,000 lowest-energy conformers was used in Rosetta modeling. Furthermore, the coordination geometry of the two ZnCys4 sites in the DBD was fixed by applying constraints between each of the two Zn ions and their coordinating cysteines.
A total of 40,000 LRH-1 DBD-LBD models were created per docking run starting from random orientations of the DBD and LBD with no prior contact. The BS3 crosslinking and HDX data were implemented in docking as follows: BS3 crosslinks were translated to Cα atom pair distance restraints with a harmonic penalty function that was zero below 26 Å and grew quadratically beyond that distance. The upper bound distance of 26 Å was chosen by adding a tolerance of 2 Å to the theoretically maximum length of two fully extended lysine sidechains and BS3 crosslinker (24 Å) following recommendations by (Merkley et al., 2014). The experimental crosslink between K118 (LRH-1) and E740 (PGC1α) was mapped to the first residue (P742) in the PGC1α model and the upper bound distance was increased to 32 Å because the first two PGC1α residues were missing in the LRH-1 LBD crystal structure (PDB: 5UNJ) (Mays et al., 2017).
HDX data were used as additional model filter by enforcing that at least one amino acid from every peptide region with decreased HDX signal in DBD+LBD samples versus samples containing only DBD or LBD was part of the model inter-domain interface. The interface was defined as every residue i in the DBD or LBD that fulfilled at least one of the two criteria: (1) had an atom within 5.5 Å distance of any residue j in the second domain, or (2) had a Cβ atom within 9 Å distance to the Cβ atom of any residue j and a Cα-Cβ-vector pointing towards the other domain (i.e. with a Cβ(i) - Cα(i) - Cα(j) angle below 75°). Docking models which passed this HDX interface filter and had a BS3 crosslink restraint penalty <200 REU (Rosetta energy units) and a Rosetta ddG score <0 REU were clustered based on their Cα atom root-mean-square distance deviations (Cα-RMSD) using a cluster radius of 3 Å. About ten lowest-scoring models from the largest 10–20 model clusters were selected and used to seed another round of docking. This procedure was repeated twice while the BS3 crosslink distance cutoff and the cluster radius were gradually decreased to 0 REU and 2 Å in the final round of docking. Only small initial random rotations and translations with standard deviations of 8° and 3 Å were applied to the DBD and LBD prior to the second and third docking run. Inspection of the cluster centroids after the third round of docking showed that 17 of the 20 largest clusters shared very similar domain orientations and that ~40% of models fell within the largest cluster indicating convergence in docking (Figure S7). Likely DBD-LBD residue contacts were then determined by a pairwise breakdown of the Rosetta energy across the DBD-LBD interface and counting all residue pairs with a Rosetta score <−1.0 REU within the 5,000 models with lowest ddG score from the largest docking cluster. Agreement of the LRH-1 docking model with the BS3 XL-MS data was evaluated by measuring the Euclidean Cα-Cα and Nζ-Nζ (Nζ-N in case of K118-P742) distance, and solvent-accessible surface (SAS) Nζ-Nζ (Nζ-N) distance between crosslinked residues in MD simulations (see below) of the LRH-1 model (Figure S4+S5, Table S2). SAS paths were calculated with the program Xwalk (Kahraman, Malmström and Aebersold, 2011). To more accurately analyze the SAS crosslink distance between K118 and the PGC1α N-terminus at E740, two additional residues were modeled into the PGC1α peptide in selected MD snapshots using RosettaRemodel (Huang et al., 2011).
LRH-1 models were validated against SAXS data after docking because it was assumed that the long NTD (residues M1 - L82) and inter-domain hinge (residues L185 - P298), which are not seen in the DBD and LBD crystal structures and predicted to be disordered, made significant contributions to the SAXS intensity. To take structural flexibility of those regions into account in modeling, 900 conformations of the NTD and hinge domain were built into 50 lowest-ddG-scoring models from the largest cluster after the final round of docking using the RANCH (Tria et al., 2015) program from the ATSAS (Franke et al., 2017) package to yield 45,000 full-length LRH-1 models. The Cα atom trace conformations were converted into all-atom representation using REMO (Li and Zhang, 2009) and their geometry was further minimized with Rosetta. Theoretical SAXS profiles for every full-length LRH-1 model with bound DNA and P6L were simulated using CRYSOL (Svergun, Barberato and Koch, 1995). The pool of LRH-1 models was then regularized by running 100 cycles of a genetic algorithm as implemented in GAJOE (Tria et al., 2015) with 1000 generations per cycle and disallowing self-repetition of SAXS curves to find a likely LRH-1 ensemble that minimized the SAXS χ2 value. The LRH-1 docking model with lowest ddG score and an ensemble of ten LRH-1 full-length models with minimal χ2 were used for final analysis and running MD simulations. Those models are provided with the supporting material to this paper and can be obtained from PDB-Dev (Vallat et al., 2018) under accession code PDBDEV_00000035. SAXS data reported in this paper are available from SASBDB (Valentini et al., 2015) under accession number SASDG85. MS data reported in this paper as well as LRH-1 starting structures and Rosetta input scripts used in model building are available from: https://doi.org/10.5281/zenodo.3405545.
Molecular Dynamics simulation of the LRH-1 DBD-LBD complex models:
All-atom MD simulations of models of the LRH-1 DBD-LBD complex were conducted with AMBER 16 (Case DA, 2016) employing the ff14SB (Maier et al., 2015) force field for proteins, the OL15 (Galindo-Murillo et al., 2016) force field for DNA, the TIP4P/Ew (Horn et al., 2004; Horn, Swope and Pitera, 2005) water model with parameters for monovalent ions from Joung and Cheatham (Joung and Cheatham, 2008, 2009), and the Zinc AMBER force field (ZAFF) (Peters et al., 2010) for the two ZnCys4 sites in LRH-1. Assignment of atom types and calculation of atomic point charges for the P6L ligand was carried out with Antechamber (Wang et al., 2006) using the general AMBER force field (GAFF) (Wang et al., 2004) and the AM1-BCC (Jakalian, Jack and Bayly, 2002) charge model. LRH-1 docking models were embedded in an octahedral TIP4P/Ew water box and 65 Na+ and 45 Cl− ions were added to neutralize the system’s charge and adjust the ionic number to the experimental salt concentration of 150 mM NaCl. SHAKE (Ryckaert et al., 1977) bond length constraints were applied to all bonds involving hydrogen. Nonbonded interactions were evaluated with a 10 Å cutoff, and electrostatic interactions were calculated with a particle-mesh Ewald summation method (Darden, York and Pedersen, 1993; Essmann et al., 1995).
The MD system was first minimized for 10,000 steps using steepest descent followed by 10,000 steps of conjugate gradient minimization. With protein, DNA and P6L restrained to their initial coordinates, the system was then heated to 310 K over 500 ps in the NVT ensemble using a step size of 1 fs and an Andersen thermostat with a heat bath coupling time constant of 1 ps. After switching to the NPT ensemble, positional restraints on protein, DNA and P6L were gradually removed over 6 ns while Langevin dynamics with a collision frequency of 2.0 ps−1 was used for temperature regulation. Production MD was conducted for 800 ns using a step size of 2 fs, constant pressure periodic boundary conditions, isotropic pressure scaling and Langevin dynamics. To avoid that the elongated LRH-1 DBD-LBD complex would rotate outside of the simulation box during MD, very weak harmonic restraints with a force constant of 0.02 kcal mol−1 Å−1 were applied to the deoxy-ribose phosphate backbone atoms of the DNA. Four independent MD simulations starting from different members of the selected ensemble of ten LRH-1 models were carried out yielding 3.2 μs of trajectory data.
Analysis of molecular dynamics simulations:
Analysis of MD trajectories with CPPTRAJ (version 18.0) (Roe and Cheatham, 2013) included calculation of Cα atom root-mean-square deviations (Cα-RMSD) and root-mean-square fluctuations (Cα-RMSF), measurement of DBD-LBD residue pair and crosslink Cα-Cα and Nζ-Nζ distances, and calculation of the change in solvent-accessible surface area (ΔSASA) to assess stability of the LRH-1 DBD-LBD docking model. Dynamical network analysis was performed with the Network View plugin (Eargle and Luthey-Schulten, 2012) in VMD (Humphrey, Dalke and Schulten, 1996). A node in the network was assigned to every amino acid in LRH-1 and PGC1α peptide centered at their Cα atom, and two nodes were assigned to every DNA residue – one centered at the P atom of the sugar-phosphate moiety and another centered at the N1 (dC, dT) or N9 (dA, dG) atom of the N-glycosidic bond. The P6L phospholipid ligand was represented by ten nodes – one for the glycerol headgroup, one for the phosphate group, two for the glycerol backbone, and three for each fatty acid tail. Network edges were defined between nodes whose residues were within 4.5 Å distance for at least 75% of the MD trajectory and the last 700 ns of simulation were used in the analysis. Edge weights were derived from the pairwise residue correlation matrix calculated with the program Carma (Glykos, 2006). Network communities were determined by applying the Girvan-Newman algorithm (Girvan and Newman, 2002) implemented in the program gncommunities as part of the Network View plugin (Eargle and Luthey-Schulten, 2012).
Fluorescence Polarization Co-activator Peptide Binding Assays:
Full-length LRH-1/CYP7A1 promoter complex or LRH-1 LBD was serially diluted in assay buffer (20 mM TRIS pH 7.5, 150 mM NaCl, 0.5 mM CHAPS) in black-walled 384 well plates. N-terminally FAM-labeled PGC1α co-regulator peptide (Sequence: +H3N-EEPSLLKKLLLAPA-CO2−) was added to a final concentration of 50 nM. Fluorescence polarization measurements were collected using a BioTek Neo plate reader (BioTek Instruments, Winooski, VT). Data are the results of three independent experiments performed at least in duplicate in a total volume of 50 μL. Data were fitted to a single-site equilibrium binding equation with GraphPad Prism (GraphPad Software, Inc. La Jolla, CA) to determine KD and Bmax parameters.
Fluorescence Polarization DNA competition Binding Assays:
Unlabeled CYP7A1 DNA oligonucleotide was serially diluted into assay buffer (20 mM TRIS pH 7.5, 150 mM NaCl, 0.5 mM CHAPS) in black-walled 384 well plates. Full-length LRH-1/CYP7A1 promoter complex with FAM-labeled oligo was added to a final concentration of 50 nM. Fluorescence polarization measurements were collected using a BioTek Neo plate reader (BioTek Instruments, Winooski, VT). Data are the results of three independent experiments performed in triplicate in a total volume of 50 μL. Data were fitted to a single-site competition-binding curve with GraphPad Prism (GraphPad Software, Inc. La Jolla, CA) to determine IC50 parameters.
Cellular Transcriptional Assays:
Transactivation of wild type, 3KR LRH-1 and 3KR LRH-1 mutants were measured using luciferase-based reporter gene assay. HEK293T cells were seeded into 24-well plates and incubated at 37 °C in complete media (DMEM supplemented with 10% FBS and 1% penicillin/streptomycin) until ~70% confluent. Each well was then transiently transfected using PolyJet™ with plasmids encoding firefly luciferase under the control of the mouse CYP17A1 promoter (300 ng/well), Renilla luciferase under constitutive activation via either the SV40 promoter or TK promoter (30 ng/well), and LRH-1 plasmids under constitutive activation via CMV promoter (180 ng/well). Transfection was ended after 4 hours of incubation at 37 °C via replacement of media with complete media. Cells were incubated for an additional 44 hours, washed with PBS, and frozen at −80 °C until luciferase analysis. Luciferase activity was measured using a Biotek® luminescence detector. Statistical analyses were performed using GraphPad Prism (GraphPad Software, Inc. La Jolla, CA) via a one-factor analysis of variance (ANOVA) followed by Bonferonni-corrected multiple comparison tests. Data are the result of three independent experiment performed in quadruplicate. Co-regulator transactivation studies (human β-catenin S33Y and WT human DAX-1) were performed as above with additional 180 ng/well of transcriptional co-activator plasmid.
Western Blot Analysis of LRH-1 Mutants:
LRH-1 variant protein expression levels were measured using western blot analysis. HEK293T cells were seeded into 6-well plates and incubated at 37 °C in complete media (DMEM supplemented with 10% FBS and 1% penicillin/streptomycin) until ~70% confluent. Each well was then transiently transfected using PolyJet™ with an LRH-1 plasmid under constitutive activation via CMV promoter (1.0 μg/well). Transfection was ended after 4 hours of incubation at 37 °C via replacement of media with complete media. Cells were incubated for an additional 44 hours, trypsinized to remove from 6-well plate, washed with PBS, and frozen at −80 °C until western blot analysis. Cells were disrupted in lysis buffer (10 mM HEPES pH 7.5, 500 mM NaCl, 5 mM EDTA, 1% NP-40, 0.1% SDS) in the presence of cOmplete Protease tablets (Roche, Indianapolis, IN), incubated on ice for 30 minutes, and centrifuged at 17,500xg for 15 minutes at 4 °C. The supernatant was quantified for total protein content via BCA assay. 5 μg total protein of each LRH-1 variant was loaded onto SDS-PAGE and was sequentially blotted for LRH-1 and β-actin.
Lipid Mass Spectrometry Quantification:
IPA (100 μL) was added to 100uL of each sample (~17 μM protein for both FL and LBD LRH-1), along with 10μL of SPLASH LipidoMIX Internal Standard (Avanti, USA). Samples were vortexed, kept on ice (30 min), and centrifuged (10 min at 15K rpm) to clear the sample of precipitated protein and DNA oligo. Direct infusion-mass spectrometry (DI-MS) (sample flow 5 μL/min) were performed on Agilent 6560 Ion Mobility LC/Q-TOF (Agilent, Santa Clara, CA, USA). Data was acquired in negative full scan mode using Agilent’s Jet Stream ESI source, with a capillary voltage of 3.5 kV, gas temperature at 300°C with flow of 13 L/min, sheath gas temperature at 300°C with flow of 12 L/min. Flow injection analysis- mass spectrometry (FIAMS) and product ion scan (PIS) were performed on Agilent 6470 Triple Quadrupole (Agilent, Santa Clara, CA, USA) equipped with Agilent 1290 Infinity II UHPLC system (Agilent, Santa Clara, CA, USA). FIA was performed at 100 μL/min using 10 mM ammonium acetate in 50% isopropanol, 30% methanol, 20% acetonitrile and 10% water for 1 min; injection volume: 10 μL, autosampler temperature: 4°C.Data was acquired in negative PIS mode using Agilent’s Jet Stream ESI source, with a capillary voltage of 2.5 kV, gas temperature at 300°C with flow of 8 L/min, sheath gas temperature at 300°C with flow of 7 L/min. Data was processed and analyzed using Agilent’s MassHunter Workstation Data Acquisition, MassHunter Qualitative Analysis, Microsoft Excel, GraphPad Prism (GraphPad Software, Inc. La Jolla, CA).
PE and PG species were identified by high resolution accurate mass measurements, and fatty acyl chain constituents were confirmed by MS/MS and annotated as described by Liebisch, Ejsing and Ekroos, 2015.
Bioinformatics Sequence Alignment:
The following LRH-1 and SF-1 sequences were aligned using ClustalOmega (Madeira et al., 2019): Homo sapiens LRH-1 (O00482), Pan troglodytes LRH-1 (XP_001142695), Mus musculus LRH-1 (P45448), Rattus norvegicus LRH-1 (Q9QWM1), Bos taurus LRH-1 (NP_001193745), Equus caballus LRH-1 (XP_023488164), Sus scrofa LRH-1 (AFD98842), Danio rerio LRH-1 (AAI63522), Homo sapiens SF-1 (Q13285), Pan troglodytes SF-1 (XP_016817123), Mus musculus SF-1 (P33242), Rattus norvegicus SF-1 (P50569), Bos taurus SF-1 (NP_776828), Equus caballus SF-1 (NP_001075320), Sus scrofa SF-1 (NP_999344), and Danio rerio SF-1 (NP_997999). Sequence logo of amino acid frequencies for regions of interest were generated using WebLogo3 (Crooks et al., 2004).
Quantification and Statistical Analysis:
Fluorescence polarization co-activator and DNA binding experiments were performed in three independent experiments. Data were fit to appropriate binding curve model (single-site binding model for co-activator binding curves; single-site competition binding model for DNA binding curves) using GraphPad Prism 8. Cellular luciferase reporter assays were performed in three independent experiments. P-value were calculated by one-way analysis of variance (ANOVA) with Bonferroni corrections for multiple comparisons using GraphPad Prism 8. HDX-MS studies were performed in three independent experiments and were compared using Student’s t-test where P-values >0.01 were considered statistically significant to correct for multiple comparisons. Quantitative XL-MS studies were performed in three independent experiments and were compared using a Student’s t-test where P-values >0.05 were considered statistically significant. Lipid mass spectrometry quantification studies were performed in three independent extraction experiments and were compared using a grouped Student’s t-test with Bonferroni corrections for multiple comparisons. SEC-SAXS data statistics are shown in Table 2. Molecular dynamics simulations shown in Figure 4 were carried out with four of the ten selected members of the LRH-1 ensemble from Rosetta docking simulations, each over 800 ns for a total of 3.2 μs.
Supplementary Material
Spreadsheet S1: HDX-MS %D data related to Figures 1, S1, and 7. Tabs indicate each experiment. Experiments are full-length LRH-1 vs. individual domains (%D_FL_vs_Domains); full-length LRH-1 with or without PGC1α coactivator peptide (%D_No_Peptide_vs_Peptide); full-length LRH-1 wild-type vs. D314R mutant (%D_WT_vs_D314R). Data are presented as % Deuteration (%D) and differences between control vs. experimental HDX-MS for individual peptides. Gray-filled squares in T-test columns indicate p<0.01.
Video S1: MD trajectory of the LRH-1 integrative model depicting the interaction between R174 and D314 at site 1; related to Figures 4 and 5.
Video S2: MD trajectory of the LRH-1 integrative model depicting the residue neighborhood of S148 at site 2/3; related to Figures 4 and 6.
Video S3: MD trajectory of the LRH-1 integrative model (in cartoon representation) depicting BS3 crosslink sites; related to Figures 2, 3 and 4.
Video S4: MD trajectory of the LRH-1 integrative model (in space filled representation) depicting BS3 crosslink sites; related to Figures 2, 3, and 4.
Key Resources Table
| Reagent or resource | Source | Identifiers |
|---|---|---|
| Bacterial and Virus Strains | ||
| BL21 dE3 Chemically Competent E. coli | Novagen | 69450 |
| BL21 dE3 AI Chemically Competent E. coli | ThermoFisher Scientific | C607003 |
| Origami 2 dE3 Chemically Competent E. coli | Novagen | 71345 |
| Chemicals, Peptides, and Recombinant Proteins | ||
| cOmplete™, EDTA-free Protease Inhibitor Cocktail | Sigma-Alrich | 4693132001 |
| Adenosine 5’-triphosphate disodium salt hydrate | Sigma-Aldrich | A2383 |
| BS3 (bis(sulfosuccinimidyl)suberate) | ThermoFisher Scientific | A39266 |
| Mouse anti-LRH-1 primary | R&D Systems | PP-H2325-00 |
| Goat anti-mouse HRP conjugated secondary | Promega | W4021 |
| β-actin primary | Millipore Sigma | A3854 |
| PGC1α peptide (740EEPSLLKKLLLAPA753) | New England Peptides | N/A |
| N-terminally FAM-labeled PGC1α peptide (740EEPSLLKKLLLAPA753) | New England Peptides | N/A |
| Gene | ||
| NR5A2 (LRH-1), Homo sapiens | UniProt database | O00482 |
| Deposited Data | ||
| LRH-1FL Integrated Model | This study | PDBDev_00000035 |
| LRH-1 DBD:CYP7A1 Promoter Complex | Solomon et al, 2005 | PDB: 2A66 |
| LRH-1 LBD: NCoA2 Peptide Complex | Krylova, et al 2005 | PDB: 1YOK |
| LRH-1 LBD: RJW100: PGC1α Peptide Complex | Mays et al, 2017 | PDB: 5UNJ |
| LRH-1 LBD: DLPC: NCoA2 Peptide Complex | Musille et al, 2012 | PDB: 4DOS |
| mSF-1 DBD: Inhibinα Promoter Complex | Little et al, 2006 | PDB: 2FF0 |
| Experimental Models: Cell Lines | ||
| HEK 293T, Human embryonic kidney | ATCC | CRL-3216 |
| Recombinant DNA | ||
| pRSF2-LRH-1 WT | Suzawa, et al., 2015. | N/A |
| pRSF2-LRH-1 S148R | This study | N/A |
| pRSF2-LRH-1 R174D | This study | N/A |
| pRSF2-LRH-1 D314R | This study | N/A |
| pRSF2-LRH-1 R174D/D314R | This study | N/A |
| pRSF2-LRH-1 A324R | This study | N/A |
| pRSF2-LRH-1 A324TAG | This study | N/A |
| pRSF2-LRH-1 Q126C/Y528C | This study | N/A |
| pEVOL-pBpF | Chin et al., 2002 | Addgene 31190; A gift from Peter Schultz |
| pET-His-MBD-TEV- LRH-1 DBD (aa 79–187) | This study | N/A |
| pET-His- TEV- LRH-1 LBD WT (aa 266–541) | This study | N/A |
| pET-His- TEV- LRH-1 LBD D314R (aa 266–541) | This study | N/A |
| pET28-His-TEV- human β-catenin R1C WT | Addgene 17200; A gift from Randall Moon | |
| pET-His-TEV- human β-catenin R1C K306A / K345A / W383A | This study | N/A |
| pET-His- mouse Dax-1 WT (aa 205–472) | This study | N/A |
| pET-His- mouse Dax-1 L279A / L280A (aa 205472) | This study | N/A |
| HA-LRH1 WT, mCherry dual ORF | This study | N/A |
| HA-LRH1 S148R, mCherry dual ORF | This study | N/A |
| HA-LRH1 R174D, mCherry dual ORF | This study | N/A |
| HA-LRH1 R174E/D314E, mCherry dual ORF | This study | N/A |
| HA-LRH1 K179A/K182A/K183A, mCherry dual ORF | This study | N/A |
| HA-LRH1 D314R, mCherry dual ORF | This study | N/A |
| pcDNA3-S33Y human β-catenin | Kolligs et al., 1999 | Addgene 19286; A gift from Eric Fearon |
| pcDNA3 human DAX-1 | Genscript | O H u 2 8 2 9 5 |
| CYP17A1-pGL3-Basic | A gift from Holly Ingraham | |
| pRL-SV40 | Promega | E2231 |
| pRL-TK | Promega | E2241 |
| Oligonucleotides | ||
| CYP7A1 Forward Promoter: GTTCAAGGCCAG | IDT | N/A |
| FAM-labeled CYP7A1 Forward Promoter: GTTCAAGGCCAG | IDT | N/A |
| CYP7A1 Reverse Promoter: CTGGCCTTGAAC | IDT | N/A |
| Software and Algorithms | ||
| Prism 8 | GraphPad | https://www.graphpad.com/scientific-software/prism/ |
| pLink 2.0 | Chen et al, 2019 | http://pfind.ict.ac.cn/software/pLink/ |
| Crossfinder | Mueller-Planitz | https://www.molekularbiologie.abi.med.uni-muenchen.de/ueber_uns/mueller_planitz/index.html |
| Skyline | MacLean et al, 2010 | https://skyline.ms/project/home/software/Skyline/begin.view |
| Rosetta 3.10 | Leaver Fay et al., 2011 | https://www.rosettacommons.org/software |
| ATSAS 2.8.4 | Franke D et al., 2017 | https://www.embl-hamburg.de/biosaxs/software.html |
| REMO | Li Y et al., 2009 | https://zhanglab.ccmb.med.umich.edu/REMO/ |
| BCL::Conf | Kothiwale S et al., 2015 | http://www.meilerlab.org/index.php/ |
| AMBER16 | Case DA et al., 2016 | http://ambermd.org |
| PyMOL | The PyMOL Molecular Graphics System, Version 2.0 Schrodinger, LLC | https://pymol.org/ |
| VMD | Humphrey W et al., 1996 | https://www.ks.uiuc.edu/Research/vmd/ |
| CPPTRAJ | Roe DR & Cheatham TE 3rd, 2013 | http://ambermd.org/AmberTools.php |
| CARMA | Glykos NM, 2006 | https://utopia.duth.gr/~glykos/Carma.html |
| NetworkView plugin for VMD | Eargle J et al., 2012 | https://www.ks.uiuc.edu/Research/vmd/plugins/networkview/ |
| ClustalOmega | Madeira et al, 2019 | https://www.ebi.ac.uk/Tools/msa/clustalo/ |
| PSIPRED | Jones et al, 1999 | http://bioinf.cs.ucl.ac.uk/psipred/ |
| RosettaRemodel | Huang, et al 2011 | https://www.rosettacommons.org/software |
| Other | ||
| TALON metal affinity resin | Takara | 635503 |
| Superdex 200 Increase HiScale 26/40 | GE Healthcare | 29321906 |
| Superdex 75 Increase 10/300 GL | GE Healthcare | 29148721 |
| Protein Assay Dye Reagent Concentrate | Bio-Rad | 5000006 |
| Dual Luiferase® Reporter Assay System | Promega | E1980 |
Highlights:
Integrated structure of full-length monomeric nuclear receptor LRH-1
Structure accurately predicts a novel inter-domain charge clamp
DNA-binding and transcriptional activation domains dock via conserved helices
Binding of known transcription co-regulators alters LRH-1 inter-domain dynamics
Acknowledgements:
SAXS data was collected at the Advanced Light Source, SIBYLS beamline on behalf of US DOE-BER, through the Integrated Diffraction Analysis Technologies (IDAT) program. Lipid mass spectrometry supported by the Center for Innovative Technology (CIT) at Vanderbilt University, NIGMS ALS-ENABLE P30 GM124169 and S10OD018483. Rosetta and MD calculations utilized the computing cluster of the Advanced Center for Research and Education (ACCRE) at Vanderbilt University. We thank Dr. Brinda Vallat for her assistance in the LRH-1 model deposition to PDB-Dev. We thank Dr. Hayes McDonald and the Vanderbilt University Mass Spectrometry Research Center for collection of XL-MS data.
CDS supported by T32DK007563 and pre-doctoral fellowship 1F31DK120214-01. GK supported by postdoctoral fellowship American Heart Association 18POST34080422. Work in the JEB laboratory supported by NSERC discovery grant NSERC-2014-05218. Work in the RDB laboratory supported by CA243036, DK020593, American Cancer Society Research Scholar Grant RSG-17-063-01, Vanderbilt Ingram Cancer Center / ACS Pilot IRG-58-009-56, The V Foundation for Cancer Research V-Scholar Grant V2016-015, Vanderbilt Diabetes Center Discovery Award and Vanderbilt Ingram Cancer Center Young Ambassadors Discovery Award.
Footnotes
Publisher's Disclaimer: This is a PDF file of an unedited manuscript that has been accepted for publication. As a service to our customers we are providing this early version of the manuscript. The manuscript will undergo copyediting, typesetting, and review of the resulting proof before it is published in its final form. Please note that during the production process errors may be discovered which could affect the content, and all legal disclaimers that apply to the journal pertain.
Declaration of Interest: The authors declare no competing interests.
References:
- Abio Madeira F ´ et al. (2019) ‘The EMBL-EBI search and sequence analysis tools APIs in 2019’, Web Server issue Published online, 47. doi: 10.1093/nar/gkz268. [DOI] [PMC free article] [PubMed] [Google Scholar]
- Alford RF et al. (2017) ‘The Rosetta All-Atom Energy Function for Macromolecular Modeling and Design.’, Journal of chemical theory and computation, 13(6), pp. 3031–3048. doi: 10.1021/acs.jctc.7b00125. [DOI] [PMC free article] [PubMed] [Google Scholar]
- Bayrer JR et al. (2018) ‘LRH-1 mitigates intestinal inflammatory disease by maintaining epithelial homeostasis and cell survival’, Nature Communications, 9(1), p. 4055. doi: 10.1038/s41467-018-06137-w. [DOI] [PMC free article] [PubMed] [Google Scholar]
- Bianco S et al. (2019) ‘The Ovulatory Signal Precipitates LRH-1 Transcriptional Switching Mediated by Differential Chromatin Accessibility’, Cell Reports, 28(9), pp. 2443–2454.e4. doi: 10.1016/j.celrep.2019.07.088. [DOI] [PubMed] [Google Scholar]
- Brendel C, Gelman L and Auwerx J (2002) ‘Multiprotein bridging factor-1 (MBF-1) is a cofactor for nuclear receptors that regulate lipid metabolism.’, Molecular endocrinology (Baltimore, Md.), 16(6), pp. 1367–77. doi: 10.1210/mend.16.6.0843. [DOI] [PubMed] [Google Scholar]
- Case DA, et al. (2016) ‘AMBER 2016.’, San Francisco: University of California. Available at: http://ambermd.org/doc12/Amber16.pdf (Accessed: 10 September 2019). [Google Scholar]
- Chandra V et al. (2008) ‘Structure of the intact PPAR-γ–RXR-α nuclear receptor complex on DNA’, Nature, 456(7220), pp. 350–356. doi: 10.1038/nature07413.Structure. [DOI] [PMC free article] [PubMed] [Google Scholar]
- Chandra V et al. (2013) ‘Multidomain integration in the structure of the HNF-4α nuclear receptor complex.’, Nature, 495(7441), pp. 394–8. doi: 10.1038/nature11966. [DOI] [PMC free article] [PubMed] [Google Scholar]
- Chandra V et al. (2017a) ‘The quaternary architecture of RARβ-RXRα heterodimer facilitates domain-domain signal transmission.’, Nature communications, 8(1), p. 868. doi: 10.1038/s41467-017-00981-y. [DOI] [PMC free article] [PubMed] [Google Scholar]
- Chandra V et al. (2017b) ‘The quaternary architecture of RARβ-RXRα heterodimer facilitates domain-domain signal transmission.’, Nature communications, 8(1), p. 868. doi: 10.1038/s41467-017-00981-y. [DOI] [PMC free article] [PubMed] [Google Scholar]
- Chen Z-L et al. (2019) ‘A high-speed search engine pLink 2 with systematic evaluation for proteome-scale identification of cross-linked peptides.’, Nature communications, 10(1), p. 3404. doi: 10.1038/s41467-019-11337-z. [DOI] [PMC free article] [PubMed] [Google Scholar]
- Chin JW et al. (2002) ‘Addition of a photocrosslinking amino acid to the genetic code of Escherichia coli’, Proceedings of the National Academy of Sciences, 99(17), pp. 11020–11024. doi: 10.1073/pnas.172226299. [DOI] [PMC free article] [PubMed] [Google Scholar]
- Classen S et al. (2013) ‘Implementation and performance of SIBYLS: a dual endstation small-angle X-ray scattering and macromolecular crystallography beamline at the Advanced Light Source.’, Journal of applied crystallography, 46(Pt 1), pp. 1–13. doi: 10.1107/S0021889812048698. [DOI] [PMC free article] [PubMed] [Google Scholar]
- Cobo-Vuilleumier N et al. (2018) ‘LRH-1 agonism favours an immune-islet dialogue which protects against diabetes mellitus’, Nature Communications, 9(1), p. 1488. doi: 10.1038/s41467-018-03943-0. [DOI] [PMC free article] [PubMed] [Google Scholar]
- Cobo I et al. (2018) ‘Transcriptional regulation by NR5A2 links differentiation and inflammation in the pancreas’, Nature, 554(7693), pp. 533–537. doi: 10.1038/nature25751. [DOI] [PMC free article] [PubMed] [Google Scholar]
- Craig DB and Dombkowski AA (2013) ‘Disulfide by Design 2.0: a web-based tool for disulfide engineering in proteins’, BMC Bioinformatics. BioMed Central, 14(1), p. 346. doi: 10.1186/1471-2105-14-346. [DOI] [PMC free article] [PubMed] [Google Scholar]
- Crooks GE et al. (2004) ‘WebLogo: a sequence logo generator.’, Genome research, 14(6), pp. 1188–90. doi: 10.1101/gr.849004. [DOI] [PMC free article] [PubMed] [Google Scholar]
- Darden T, York D and Pedersen L (1993) ‘Particle mesh Ewald: An N·log(N) method for Ewald sums in large systems’, The Journal of Chemical Physics. American Institute of Physics, 98(12), pp. 10089–10092. doi: 10.1063/1.464397. [DOI] [Google Scholar]
- Dyer KN et al. (2014) ‘High-throughput SAXS for the characterization of biomolecules in solution: a practical approach.’, Methods in molecular biology (Clifton, N.J.), 1091, pp. 245–58. doi: 10.1007/978-1-62703-691-7_18. [DOI] [PMC free article] [PubMed] [Google Scholar]
- Eargle J and Luthey-Schulten Z (2012) ‘NetworkView: 3D display and analysis of protein{middle dot}RNA interaction networks’, Bioinformatics, 28(22), pp. 3000–3001. doi: 10.1093/bioinformatics/bts546. [DOI] [PMC free article] [PubMed] [Google Scholar]
- Essmann U et al. (1995) ‘A smooth particle mesh Ewald method’, The Journal of Chemical Physics. American Institute of Physics, 103(19), pp. 8577–8593. doi: 10.1063/1.470117. [DOI] [Google Scholar]
- Evans RM and Mangelsdorf DJ (2014) ‘Nuclear Receptors, RXR, and the Big Bang’, Cell, 157(1), pp. 255–266. doi: 10.1016/j.cell.2014.03.012. [DOI] [PMC free article] [PubMed] [Google Scholar]
- Fayard E, Auwerx J and Schoonjans K (2004) ‘LRH-1: An orphan nuclear receptor involved in development, metabolism and steroidogenesis’, Trends in Cell Biology, 14(5), pp. 250–260. doi: 10.1016/j.tcb.2004.03.008. [DOI] [PubMed] [Google Scholar]
- Franke D et al. (2017) ‘ATSAS 2.8: a comprehensive data analysis suite for small-angle scattering from macromolecular solutions.’, Journal of applied crystallography, 50(Pt 4), pp. 1212–1225. doi: 10.1107/S1600576717007786. [DOI] [PMC free article] [PubMed] [Google Scholar]
- Galindo-Murillo R et al. (2016) ‘Assessing the Current State of Amber Force Field Modifications for DNA.’, Journal of chemical theory and computation, 12(8), pp. 4114–27. doi: 10.1021/acs.jctc.6b00186. [DOI] [PMC free article] [PubMed] [Google Scholar]
- Girvan M and Newman MEJ (2002) ‘Community structure in social and biological networks’, Proceedings of the National Academy of Sciences of the United States of America. National Academy of Sciences, 99(12), pp. 7821–6. doi: 10.1073/pnas.122653799. [DOI] [PMC free article] [PubMed] [Google Scholar]
- Glykos NM (2006) ‘Software news and updates carma: A molecular dynamics analysis program’, Journal of Computational Chemistry, 27(14), pp. 1765–1768. doi: 10.1002/jcc.20482. [DOI] [PubMed] [Google Scholar]
- Horn HW et al. (2004) ‘Development of an improved four-site water model for biomolecular simulations: TIP4P-Ew.’, The Journal of chemical physics, 120(20), pp. 9665–78. doi: 10.1063/1.1683075. [DOI] [PubMed] [Google Scholar]
- Horn HW, Swope WC and Pitera JW (2005) ‘Characterization of the TIP4P-Ew water model: vapor pressure and boiling point.’, The Journal of chemical physics, 123(19), p. 194504. doi: 10.1063/1.2085031. [DOI] [PubMed] [Google Scholar]
- Huang P-S et al. (2011) ‘RosettaRemodel: a generalized framework for flexible backbone protein design’, PloS one. Edited by Uversky VN, 6(8), p. e24109. doi: 10.1371/journal.pone.0024109. [DOI] [PMC free article] [PubMed] [Google Scholar]
- Huang W et al. (2018) ‘Multidomain architecture of estrogen receptor reveals interfacial cross-talk between its DNA-binding and ligand-binding domains’, Nature Communications, 9(1), p. 3520. doi: 10.1038/s41467-018-06034-2. [DOI] [PMC free article] [PubMed] [Google Scholar]
- Humphrey W, Dalke A and Schulten K (1996) ‘VMD: visual molecular dynamics.’, Journal of molecular graphics, 14(1), pp. 33–8, 27–8. Available at: http://www.ncbi.nlm.nih.gov/pubmed/8744570 (Accessed: 10 September 2019). [DOI] [PubMed] [Google Scholar]
- Jakalian A, Jack DB and Bayly CI (2002) ‘Fast, efficient generation of high-quality atomic charges. AM1-BCC model: II. Parameterization and validation.’, Journal of computational chemistry, 23(16), pp. 1623–41. doi: 10.1002/jcc.10128. [DOI] [PubMed] [Google Scholar]
- Jenkins ML et al. (2018) ‘Structural determinants of Rab11 activation by the guanine nucleotide exchange factor SH3BP5’, Nature Communications, 9(1), p. 3772. doi: 10.1038/s41467-018-06196-z. [DOI] [PMC free article] [PubMed] [Google Scholar]
- Jones DT (1999) ‘Protein secondary structure prediction based on position-specific scoring matrices.’, Journal of molecular biology, 292(2), pp. 195–202. doi: 10.1006/jmbi.1999.3091. [DOI] [PubMed] [Google Scholar]
- Joung IS and Cheatham TE (2008) ‘Determination of alkali and halide monovalent ion parameters for use in explicitly solvated biomolecular simulations.’, The journal of physical chemistry. B, 112(30), pp. 9020–41. doi: 10.1021/jp8001614. [DOI] [PMC free article] [PubMed] [Google Scholar]
- Joung IS and Cheatham TE (2009) ‘Molecular dynamics simulations of the dynamic and energetic properties of alkali and halide ions using water-model-specific ion parameters.’, The journal of physical chemistry. B, 113(40), pp. 13279–90. doi: 10.1021/jp902584c. [DOI] [PMC free article] [PubMed] [Google Scholar]
- Kahraman A et al. (2013) ‘Cross-Link Guided Molecular Modeling with ROSETTA’, PLoS ONE, 8(9). doi: 10.1371/journal.pone.0073411. [DOI] [PMC free article] [PubMed] [Google Scholar]
- Kahraman A, Malmström L and Aebersold R (2011) ‘Xwalk: computing and visualizing distances in cross-linking experiments’, Bioinformatics, 27(15), pp. 2163–2164. doi: 10.1093/bioinformatics/btr348. [DOI] [PMC free article] [PubMed] [Google Scholar]
- Karczewski KJ et al. (2019) ‘Variation across 141,456 human exomes and genomes reveals the spectrum of loss-of-function intolerance across human protein-coding genes’, bioRxiv. Cold Spring Harbor Laboratory, p. 531210. doi: 10.1101/531210. [DOI] [Google Scholar]
- Kolbowski L, Combe C and Rappsilber J (2018) ‘xiSPEC: web-based visualization, analysis and sharing of proteomics data’, Nucleic acids research. Oxford University Press, 46(W1), pp. W473–W478. doi: 10.1093/nar/gky353. [DOI] [PMC free article] [PubMed] [Google Scholar]
- Kolligs FT et al. (1999) ‘ Neoplastic Transformation of RK3E by Mutant β-Catenin Requires Deregulation of Tcf/Lef Transcription but Not Activation of c- myc Expression ‘, Molecular and Cellular Biology. American Society for Microbiology, 19(8), pp. 5696–5706. doi: 10.1128/mcb.19.8.5696. [DOI] [PMC free article] [PubMed] [Google Scholar]
- Konarev PV et al. (2003) ‘PRIMUS: A Windows PC-based system for small-angle scattering data analysis’, Journal of Applied Crystallography. International Union of Crystallography (IUCr), 36(5), pp. 1277–1282. doi: 10.1107/S0021889803012779. [DOI] [Google Scholar]
- Kothiwale S, Mendenhall JL and Meiler J (2015) ‘BCL::Conf: small molecule conformational sampling using a knowledge based rotamer library’, Journal of Cheminformatics, 7(1), p. 47. doi: 10.1186/s13321-015-0095-1. [DOI] [PMC free article] [PubMed] [Google Scholar]
- Krylova IN et al. (2005) ‘Structural Analyses Reveal Phosphatidyl Inositols as Ligands for the NR5 Orphan Receptors SF-1 and LRH-1’, Cell, 120(3), pp. 343–355. doi: 10.1016/j.cell.2005.01.024. [DOI] [PubMed] [Google Scholar]
- Lai C-F et al. (2013) ‘Co-regulated gene expression by oestrogen receptor α and liver receptor homolog-1 is a feature of the oestrogen response in breast cancer cells’, Nucleic Acids Research, 41(22), pp. 10228–10240. doi: 10.1093/nar/gkt827. [DOI] [PMC free article] [PubMed] [Google Scholar]
- Leaver-Fay A et al. (2011) ‘ROSETTA3: an object-oriented software suite for the simulation and design of macromolecules.’, Methods in enzymology, 487, pp. 545–74. doi: 10.1016/B978-0-12-381270-4.00019-6. [DOI] [PMC free article] [PubMed] [Google Scholar]
- Lee JM et al. (2011) ‘A nuclear-receptor-dependent phosphatidylcholine pathway with antidiabetic effects’, Nature, 474(7352), pp. 506–510. doi: 10.1038/nature10111. [DOI] [PMC free article] [PubMed] [Google Scholar]
- Li Y and Zhang Y (2009) ‘REMO: A new protocol to refine full atomic protein models from C-alpha traces by optimizing hydrogen-bonding networks’, Proteins: Structure, Function, and Bioinformatics, 76(3), pp. 665–676. doi: 10.1002/prot.22380. [DOI] [PMC free article] [PubMed] [Google Scholar]
- Liebisch G, Ejsing CS and Ekroos K (2015) ‘Identification and annotation of lipid species in metabolomics studies need improvement’, Clinical Chemistry. American Association for Clinical Chemistry Inc., pp. 1542–1544. doi: 10.1373/clinchem.2015.244830. [DOI] [PubMed] [Google Scholar]
- Little Tanya H et al. (2006) ‘Sequence-specific deoxyribonucleic acid (DNA) recognition by steroidogenic factor 1: a helix at the carboxy terminus of the DNA binding domain is necessary for complex stability.’, Molecular endocrinology (Baltimore, Md.), 20(4), pp. 831–43. doi: 10.1210/me.2005-0384. [DOI] [PubMed] [Google Scholar]
- Little Tanya H. et al. (2006) ‘Sequence-Specific Deoxyribonucleic Acid (DNA) Recognition by Steroidogenic Factor 1: A Helix at the Carboxy Terminus of the DNA Binding Domain Is Necessary for Complex Stability’, Molecular Endocrinology, 20(4), pp. 831–843. doi: 10.1210/me.2005-0384. [DOI] [PubMed] [Google Scholar]
- Lou X et al. (2014) ‘Structure of the retinoid × receptor α-liver × receptor β (RXRα-LXRβ) heterodimer on DNA.’, Nature structural & molecular biology, 21(3), pp. 277–81. doi: 10.1038/nsmb.2778. [DOI] [PubMed] [Google Scholar]
- Lu S et al. (2015) ‘Mapping native disulfide bonds at a proteome scale’, Nature Methods, 12(4), pp. 329–331. doi: 10.1038/nmeth.3283. [DOI] [PubMed] [Google Scholar]
- Lučić I et al. (2018) ‘Conformational sampling of membranes by Akt controls its activation and inactivation.’, Proceedings of the National Academy of Sciences of the United States of America, 115(17), pp. E3940–E3949. doi: 10.1073/pnas.1716109115. [DOI] [PMC free article] [PubMed] [Google Scholar]
- MacLean B et al. (2010) ‘Skyline: an open source document editor for creating and analyzing targeted proteomics experiments.’, Bioinformatics (Oxford, England), 26(7), pp. 966–8. doi: 10.1093/bioinformatics/btq054. [DOI] [PMC free article] [PubMed] [Google Scholar]
- Maier JA et al. (2015) ‘ff14SB: Improving the Accuracy of Protein Side Chain and Backbone Parameters from ff99SB.’, Journal of chemical theory and computation, 11(8), pp. 3696–713. doi: 10.1021/acs.jctc.5b00255. [DOI] [PMC free article] [PubMed] [Google Scholar]
- Maletta M et al. (2014) ‘The palindromic DNA-bound USP/EcR nuclear receptor adopts an asymmetric organization with allosteric domain positioning’, Nature Communications, 5(1), p. 4139. doi: 10.1038/ncomms5139. [DOI] [PubMed] [Google Scholar]
- Masson GR et al. (2019) ‘Recommendations for performing, interpreting and reporting hydrogen deuterium exchange mass spectrometry (HDX-MS) experiments’, Nature Methods, 16(7), pp. 595–602. doi: 10.1038/s41592-019-0459-y. [DOI] [PMC free article] [PubMed] [Google Scholar]
- Mays SG et al. (2017) ‘Structure and Dynamics of the Liver Receptor Homolog 1-PGC1α Complex.’, Molecular pharmacology, 92(1), pp. 1–11. doi: 10.1124/mol.117.108514. [DOI] [PMC free article] [PubMed] [Google Scholar]
- Mays SG et al. (2019) ‘Development of the first low nanomolar liver receptor homolog-1 agonist through structure-guided design’, Journal of Medicinal Chemistry. American Chemical Society. doi: 10.1021/acs.jmedchem.9b00753. [DOI] [PMC free article] [PubMed] [Google Scholar]
- Meinsohn M-C et al. (2019) ‘The Orphan Nuclear Receptors Steroidogenic Factor-1 and Liver Receptor Homolog-1: Structure, Regulation, and Essential Roles in Mammalian Reproduction’, Physiological Reviews, 99(2), pp. 1249–1279. doi: 10.1152/physrev.00019.2018. [DOI] [PubMed] [Google Scholar]
- Merkley ED et al. (2014) ‘Distance restraints from crosslinking mass spectrometry: Mining a molecular dynamics simulation database to evaluate lysine-lysine distances’, Protein Science. Blackwell Publishing Ltd, 23(6), pp. 747–759. doi: 10.1002/pro.2458. [DOI] [PMC free article] [PubMed] [Google Scholar]
- Miranda DA et al. (2018) ‘LRH-1 regulates hepatic lipid homeostasis and maintains arachidonoyl phospholipid pools critical for phospholipid diversity.’, JCI insight, 3(5). doi: 10.1172/jci.insight.96151. [DOI] [PMC free article] [PubMed] [Google Scholar]
- Mueller-Planitz F (2015) ‘Crossfinder-assisted mapping of protein crosslinks formed by site-specifically incorporated crosslinkers: Fig. 1.’, Bioinformatics, 31(12), pp. 2043–2045. doi: 10.1093/bioinformatics/btv083. [DOI] [PubMed] [Google Scholar]
- Musille PM et al. (2012a) ‘Antidiabetic phospholipid-nuclear receptor complex reveals the mechanism for phospholipid-driven gene regulation.’, Nature structural & molecular biology, 19(5), pp. 532–S2. doi: 10.1038/nsmb.2279. [DOI] [PMC free article] [PubMed] [Google Scholar]
- Musille PM et al. (2012b) ‘Antidiabetic phospholipid-nuclear receptor complex reveals the mechanism for phospholipid-driven gene regulation.’, Nature structural & molecular biology, 19(5), pp. 532–S2. doi: 10.1038/nsmb.2279. [DOI] [PMC free article] [PubMed] [Google Scholar]
- Oosterveer MH et al. (2012) ‘LRH-1-dependent glucose sensing determines intermediary metabolism in liver.’, The Journal of clinical investigation, 122(8), pp. 2817–26. doi: 10.1172/JCI62368. [DOI] [PMC free article] [PubMed] [Google Scholar]
- Orlov I et al. (2012) ‘Structure of the full human RXR/VDR nuclear receptor heterodimer complex with its DR3 target DNA.’, The EMBO journal, 31(2), pp. 291–300. doi: 10.1038/emboj.2011.445. [DOI] [PMC free article] [PubMed] [Google Scholar]
- Ortlund EA et al. (2005) ‘Modulation of human nuclear receptor LRH-1 activity by phospholipids and SHP’, Nature Structural & Molecular Biology, 12(4), pp. 357–363. doi: 10.1038/nsmb910. [DOI] [PubMed] [Google Scholar]
- Pang J-MB et al. (2017) ‘LRH-1 expression patterns in breast cancer tissues are associated with tumour aggressiveness’, Oncotarget, 8(48), pp. 83626–83636. doi: 10.18632/oncotarget.18886. [DOI] [PMC free article] [PubMed] [Google Scholar]
- Peters MB et al. (2010) ‘Structural Survey of Zinc Containing Proteins and the Development of the Zinc AMBER Force Field (ZAFF).’, Journal of chemical theory and computation, 6(9), pp. 2935–2947. doi: 10.1021/ct1002626. [DOI] [PMC free article] [PubMed] [Google Scholar]
- Rastinejad F et al. (2013) ‘Understanding nuclear receptor form and function using structural biology’, Journal of Molecular Endocrinology, 51(3), pp. T1–T21. doi: 10.1530/JME-13-0173. [DOI] [PMC free article] [PubMed] [Google Scholar]
- Rochel N et al. (2011) ‘Common architecture of nuclear receptor heterodimers on DNA direct repeat elements with different spacings.’, Nature structural & molecular biology, 18(5), pp. 564–70. doi: 10.1038/nsmb.2054. [DOI] [PubMed] [Google Scholar]
- Roe DR and Cheatham TE (2013) ‘PTRAJ and CPPTRAJ: Software for Processing and Analysis of Molecular Dynamics Trajectory Data’, Journal of Chemical Theory and Computation. American Chemical Society, 9(7), pp. 3084–3095. doi: 10.1021/ct400341p. [DOI] [PubMed] [Google Scholar]
- Ryckaert J et al. (1977) ‘Numerical integration of the Cartesian equations of motion of a system with constraints: molecular dynamics of n-alkanes’, J. COMPUT. PHYS, pp. 327−−341. Available at: http://citeseerx.ist.psu.edu/viewdoc/summary?doi=10.1.1.399.6868 (Accessed: 10 September 2019). [Google Scholar]
- Sablin EP et al. (2003) ‘Structural basis for ligand-independent activation of the orphan nuclear receptor LRH-1.’, Molecular cell, 11(6), pp. 1575–85. Available at: http://www.ncbi.nlm.nih.gov/pubmed/12820970 (Accessed: 10 September 2019). [DOI] [PubMed] [Google Scholar]
- Sablin EP et al. (2008) ‘The structure of corepressor Dax-1 bound to its target nuclear receptor LRH-1’, Proceedings of the National Academy of Sciences, 105(47), pp. 18390–18395. doi: 10.1073/pnas.0808936105. [DOI] [PMC free article] [PubMed] [Google Scholar]
- Sethi A et al. (2009) ‘Dynamical networks in tRNA:protein complexes’, Proceedings of the National Academy of Sciences of the United States of America. National Academy of Sciences, 106(16), pp. 6620–5. doi: 10.1073/pnas.0810961106. [DOI] [PMC free article] [PubMed] [Google Scholar]
- Solomon IH et al. (2005) ‘Crystal structure of the human LRH-1 DBD-DNA complex reveals Ftz-F1 domain positioning is required for receptor activity.’, Journal of molecular biology, 354(5), pp. 1091–102. doi: 10.1016/j.jmb.2005.10.009. [DOI] [PubMed] [Google Scholar]
- Song Y et al. (2013) ‘High-resolution comparative modeling with RosettaCM.’, Structure (London, England : 1993), 21(10), pp. 1735–42. doi: 10.1016/j.str.2013.08.005. [DOI] [PMC free article] [PubMed] [Google Scholar]
- Stein S et al. (2014) ‘SUMOylation-Dependent LRH-1/PROX1 Interaction Promotes Atherosclerosis by Decreasing Hepatic Reverse Cholesterol Transport’, Cell Metabolism, 20(4), pp. 603–613. doi: 10.1016/j.cmet.2014.07.023. [DOI] [PubMed] [Google Scholar]
- Stein S et al. (2017) ‘Impaired SUMOylation of nuclear receptor LRH-1 promotes nonalcoholic fatty liver disease.’, The Journal of clinical investigation, 127(2), pp. 583–592. doi: 10.1172/JCI85499. [DOI] [PMC free article] [PubMed] [Google Scholar]
- Suzawa M et al. (2015) ‘A gene-expression screen identifies a non-toxic sumoylation inhibitor that mimics SUMO-less human LRH-1 in liver.’, eLife, 4. doi: 10.7554/eLife.09003. [DOI] [PMC free article] [PubMed] [Google Scholar]
- Svergun D, Barberato C and Koch MHJ (1995) ‘CRYSOL– a Program to Evaluate X-ray Solution Scattering of Biological Macromolecules from Atomic Coordinates’, Journal of Applied Crystallography. International Union of Crystallography (IUCr), 28(6), pp. 768–773. doi: 10.1107/S0021889895007047. [DOI] [Google Scholar]
- Svergun DI (1992) ‘Determination of the regularization parameter in indirect-transform methods using perceptual criteria’, Journal of Applied Crystallography. International Union of Crystallography (IUCr), 25(4), pp. 495–503. doi: 10.1107/S0021889892001663. [DOI] [Google Scholar]
- Tria G et al. (2015) ‘Advanced ensemble modelling of flexible macromolecules using X-ray solution scattering’, IUCrJ, 2(2), pp. 207–217. doi: 10.1107/S205225251500202X. [DOI] [PMC free article] [PubMed] [Google Scholar]
- Vadas O et al. (2017) ‘Using Hydrogen–Deuterium Exchange Mass Spectrometry to Examine Protein–Membrane Interactions’, in Methods in enzymology, pp. 143–172. doi: 10.1016/bs.mie.2016.09.008. [DOI] [PubMed] [Google Scholar]
- Valentini E et al. (2015) ‘SASBDB, a repository for biological small-angle scattering data’, Nucleic Acids Research, 43(D1), pp. D357–D363. doi: 10.1093/nar/gku1047. [DOI] [PMC free article] [PubMed] [Google Scholar]
- Vallat B et al. (2018) ‘Development of a Prototype System for Archiving Integrative/Hybrid Structure Models of Biological Macromolecules.’, Structure (London, England : 1993), 26(6), pp. 894–904.e2. doi: 10.1016/j.str.2018.03.011. [DOI] [PMC free article] [PubMed] [Google Scholar]
- Wang J et al. (2004) ‘Development and testing of a general amber force field’, Journal of Computational Chemistry, 25(9), pp. 1157–1174. doi: 10.1002/jcc.20035. [DOI] [PubMed] [Google Scholar]
- Wang J et al. (2006) ‘Automatic atom type and bond type perception in molecular mechanical calculations.’, Journal of molecular graphics & modelling, 25(2), pp. 247–60. doi: 10.1016/j.jmgm.2005.12.005. [DOI] [PubMed] [Google Scholar]
- Wang W et al. (2005) ‘The crystal structures of human steroidogenic factor-1 and liver receptor homologue-1’, Proceedings of the National Academy of Sciences, 102(21), pp. 7505–7510. doi: 10.1073/pnas.0409482102. [DOI] [PMC free article] [PubMed] [Google Scholar]
- Weikum ER et al. (2016) ‘A Structural Investigation into Oct4 Regulation by Orphan Nuclear Receptors, Germ Cell Nuclear Factor (GCNF), and Liver Receptor Homolog-1 (LRH-1).’, Journal of molecular biology, 428(24 Pt B), pp. 4981–4992. doi: 10.1016/j.jmb.2016.10.025. [DOI] [PMC free article] [PubMed] [Google Scholar]
- Yumoto F et al. (2012) ‘Structural basis of coactivation of liver receptor homolog-1 by β-catenin.’, Proceedings of the National Academy of Sciences of the United States of America, 109(1), pp. 143–8. doi: 10.1073/pnas.1117036108. [DOI] [PMC free article] [PubMed] [Google Scholar]
- Zhang C et al. (2013) ‘Liver receptor homolog-1 is essential for pregnancy’, Nature Medicine, 19(8), pp. 1061–1066. doi: 10.1038/nm.3192. [DOI] [PMC free article] [PubMed] [Google Scholar]
Associated Data
This section collects any data citations, data availability statements, or supplementary materials included in this article.
Supplementary Materials
Spreadsheet S1: HDX-MS %D data related to Figures 1, S1, and 7. Tabs indicate each experiment. Experiments are full-length LRH-1 vs. individual domains (%D_FL_vs_Domains); full-length LRH-1 with or without PGC1α coactivator peptide (%D_No_Peptide_vs_Peptide); full-length LRH-1 wild-type vs. D314R mutant (%D_WT_vs_D314R). Data are presented as % Deuteration (%D) and differences between control vs. experimental HDX-MS for individual peptides. Gray-filled squares in T-test columns indicate p<0.01.
Video S1: MD trajectory of the LRH-1 integrative model depicting the interaction between R174 and D314 at site 1; related to Figures 4 and 5.
Video S2: MD trajectory of the LRH-1 integrative model depicting the residue neighborhood of S148 at site 2/3; related to Figures 4 and 6.
Video S3: MD trajectory of the LRH-1 integrative model (in cartoon representation) depicting BS3 crosslink sites; related to Figures 2, 3 and 4.
Video S4: MD trajectory of the LRH-1 integrative model (in space filled representation) depicting BS3 crosslink sites; related to Figures 2, 3, and 4.
Data Availability Statement
The integrative LRH-1 model is available from PDB-Dev under accession number PDBDEV_00000035. SAXS data of full-length LRH-1 are available from SASBDB under accession number SASDG85. HDX-MS data, PDB coordinates of LRH-1 starting models, and Rosetta calculation scripts are available under https://doi.org/10.5281/zenodo.3405545.