

Abstract
Background and Purpose
Cardiovascular safety is one of the most frequent causes of safety‐related attrition both preclinically and clinically. Preclinical cardiovascular safety is routinely assessed using dog telemetry monitoring key cardiovascular functions. The present research was to develop a semi‐mechanistic modelling platform to simultaneously assess changes in contractility (dPdtmax), heart rate (HR) and mean arterial pressure (MAP) in preclinical studies.
Experimental Approach
Data from dPdtmax, HR, preload (left ventricular end‐diastolic pressure [LVEDP]) and MAP were available from dog telemetry studies after dosing with atenolol (n = 27), salbutamol (n = 5), L–NG–nitroarginine methyl ester (L–NAME; n = 4), milrinone (n = 4), verapamil (n = 12), dofetilide (n = 8), flecainide (n = 4) and AZ001 (n = 14). Literature model for rat CV function was used for the structural population pharmacodynamic model development. LVEDP was evaluated as covariate to account for the effect of preload on dPdtmax.
Key Results
The model was able to describe drug‐induced changes in dPdtmax, HR and MAP for all drugs included in the developed framework adequately, by incorporating appropriate drug effects on dPdtmax, HR and/or total peripheral resistance. Consistent with the Starling's law, incorporation of LVEDP as a covariate on dPdtmax to correct for the preload effect was found to be statistically significant.
Conclusions and Implications
The contractility and haemodynamics semi‐mechanistic modelling platform accounts for diurnal variation, drug‐induced changes and inter‐animal variation. It can be used to hypothesize and evaluate pharmacological effects and provide a holistic cardiovascular safety profile for new drugs.
Abbreviations
- CO
cardiac output
- CV
cardiovascular
- dOFV
difference in objective function value
- dPdtmax
maximum rate of left ventricular pressure change
- FB
physiological feedback from BP
- GOF
goodness of fit
- HR
heart rate
- HRSV
parameter quantifying the effect of heart rate on stroke volume
- ICH
International Conference on Harmonisation
- IIV
inter‐individual variability
- L–NAME
L–NG–nitroarginine methyl ester
- LVEDP
left ventricular end‐diastolic pressure—a measure of preload
- LVP
left ventricular pressure
- MAP
mean arterial pressure
- NME
new molecular entities
- OFV
objective function value
- pcVPC
prediction corrected visual predictive checks—a pharmacometric model diagnostic tool
- PD
pharmacodynamic
- PK
pharmacokinetic
- SV
stroke volume
- TPR
total peripheral resistance
What is already known
Dog telemetry studies are used to assess safety pharmacology, monitoring cardiac contractility and haemodynamic functions.
Predictive approaches are needed to understand the impact of drugs on cardiac contractility and haemodynamics.
What this study adds
Semi‐mechanistic model was developed to capture telemetry changes in contractility, HR and BP.
Model platform captures haemodynamic trends reasonably well for multiple drugs with different mechanisms of action.
What is the clinical significance
Model can be utilized to hypothesize and evaluate cardiovascular safety profiles for new molecular entities.
1. INTRODUCTION
Cardiovascular safety is a major reason for black box warnings and post approval drug withdrawal from the market (Cook et al., 2014; Kola & Landis, 2004; Munos, 2009). Thus, QT prolongations and other acute cardiovascular effects (Cavero & Holzgrefe, 2014; Colatsky et al., 2016; ICH guideline on Safety Pharmacology Studies for Human Pharmaceuticals; Redfern et al., 2003) have led to the introduction of detailed preclinical and clinical regulatory guidelines. Haemodynamic changes, such as increases in BP, which have been linked to high incidence rates of cardiovascular adverse events are often overlooked. While these endpoints are analysed preclinically prior to the investigational new drug application, the circadian rhythm and other variability can obfuscate interpretation of small signals. Further, the endpoints are often highly coupled, making it difficult to interpret primary effects from secondary compensatory effects. For the development of safe and effective medicines, robust and predictive approaches are needed to better understand the impact of candidate drugs on haemodynamics and the resulting cardiovascular risks (Sarazan et al., 2011).
Cardiac contractility is defined as the ability of the cardiac muscle to do work at a constant end‐diastolic fibre length (Feneley, 2013). Drug‐induced changes in cardiac contractility, for instance, alter the ability of the heart to generate force and may prove harmful to vulnerable patient groups with existing co‐morbidities (Pugsley & Curtis, 2012). Positive inotropes can cause ischaemic damage by increasing the work the heart performs, while negative inotropes reduce the ability of the heart to pump potentially leading to chronic heart failure. Assessing the inotropic effect of novel drug candidates early during drug discovery and development is becoming of more importance. Preclinical in vivo safety evaluation of new molecular entities (NME) is typically performed in non‐rodent species, where the cardiac inotropic state is measured using the maximum rate of left ventricular pressure (LVP) change (dPdtmax) during the systolic phase. Recently, the in vivo protocol to detect drug‐induced changes in contractility in chronically instrumented conscious dogs, using a panel of drugs clinically known to have inotropic effects, was developed and standardized (Guth et al., 2015).
Typically, during pharmacokinetic (PK)/pharmacodynamic (PD) modelling of safety pharmacology studies, the model linking PK and cardiovascular PD is developed to fit a single haemodynamic effect at a time. These models might not capture the effect of drugs that cause changes in more than one cardiovascular mechanism (Guth et al., 2015; Skinner, Lainee, Valentin, & Moors, 2012). Further, altering any one haemodynamic factor typically alters other factors as it is a result of a physiological compensation to maintain homeostasis. Despite this, there are only a handful example models that look at multiple measurements simultaneously. For example, a model developed earlier that includes arterial and venous distribution compartments to describe magnesium pharmacokinetics and incorporated relevant mechanisms (i.e. Frank–Starling and Baroreceptor control) to describe haemodynamics was able to capture and predict short‐term impact of magnesium dosing on haemodynamics (Upton & Ludbrook, 2005). Along similar lines, more recently, a model (Chou & Rinehart, 2018) was developed that reasonably well described the right heart and pulmonary circulation in humans for healthy as well as the pathological conditions by explicitly including vascular volume, vascular compliance, non‐linear pressure/volume relationships and pressure‐dependent flows. A simple model that captures the interplay between cardiac output (CO), heart rate (HR), total peripheral resistance (TPR) and BP was postulated to capture the haemodynamic changes after dihydropyridine dosing in healthy volunteers (Francheteau, Steimer, Merdjan, Guerret, & Dubray, 1993). Eventually, this structure was adapted well to capture the trends in haemodynamics from rats for a wide variety of compounds (Kamendi et al., 2016; Snelder et al., 2013, 2014).
The purpose of this study was to incorporate cardiac contractility as one of the endpoints along with commonly measured outcomes such as mean BP and HR within a semi‐mechanistic modelling platform. The aim was to develop a semi‐mechanistic modelling platform that is based on physiological principles and can fit data robustly which are obtained from routinely performed dog telemetry studies for compounds in drug development. Compound selection was based on the availability of historic data from routine dog telemetry studies where significant effect on cardiac contractility (dPdtmax) or other haemodynamic variables (e.g. HR and mean arterial pressure [MAP]) was observed. To this extent, multiple compounds were identified with a wide range of mechanisms of action that were observed to alter the cardiac contractility. This included β‐adrenoceptor antagonists (atenolol), β‐agonists (salbutamol also known as albuterol), NOS inhibitors (L–NG–nitroarginine methyl ester [L‐NAME]), PDE inhibitors (milrinone), calcium channel inhibitors (verapamil), anti‐arrhythmics (dofetilide and flecainide) and one AstraZeneca (AZ) in‐house compound (AZ001).
2. METHODS
2.1. Compounds
A detailed list of the historic studies with eight compounds included in this analysis and their mechanisms of action is shown in Table 1. This includes one AZ proprietary compound, six marketed drugs and one other (L‐NAME).
TABLE 1.
Detailed information on compounds and studies used for the development of the model
| Compound | Study | Site | Dog supply | Diet | Weight | Age | Sex | n | Route of administration | Dose | Dosing days | Sampling time range | Other |
|---|---|---|---|---|---|---|---|---|---|---|---|---|---|
| Atenolol | 001 | AZ | Dog breeding Unit, AZ | SDS Dog DD3(E) SQC (Special Diet services) | 14.2–14.6 kg | 17–22 months | M | 4 | Oral | 0, 1, 3, 10 mg·kg−1 | 1, 5, 8, 10 | −1 to 20 h | Vehicle: water |
| 002 | AZ | Dog breeding Unit, AZ | SDS Dog DD3(E) SQC (Special Diet services) | 14.2–14.6 kg | 17–22 months | M | 4 | Oral | 0, 1, 3, 10 mg·kg−1 | 1, 5, 8, 10 | −1 to 20 h | Vehicle: water | |
| 003 | AZ | Dog breeding Unit, AZ | SDS Dog DD3(E) SQC (Special Diet services) | 10–15 kg | 14–24 months | M | 4 | IV | 0, 0.1, 0.5 mg·kg−1 | 1, 5 | −1 to 1 h | Infusion via cephalic vein | |
| Vehicle: 0.9% NaCl | |||||||||||||
| 004 | HLS | Dog breeding Unit, AZ | Standard dry diet (Harlan Teklad 2021) | 12.0–13.1 kg | 28–31 months | M | 4 | Oral | 0, 0.5 mg·kg−1 | 1, 5 | 0 to 22 h | Vehicle: 0.9% NaCl | |
| 005 | HLS | Harlan, UK | Standard dry diet (Harlan Teklad 2021) | 11.4–13.4 kg | 14–16 months | M | 4 | Oral | 0, 5 mg·kg−1 | 1, 5 | 0 to 20 h | Vehicle: water | |
| 006 | HLS | Harlan, UK | Standard dry diet (Harlan Teklad 2021) | 12.0–13.1 kg | 28–31 months | M | 4 | Oral | 0, 3 mg·kg−1 | 1, 5 | 0 to 24 h | Vehicle: 0.9% NaCl | |
| 007 | HLS | Harlan, UK, and Dog breeding Unit, AZ | PMI nutrition certified Canine diet no. 5007 | 12.9–14.8 kg | 16–36 months | M | 4 | Oral | 0, 5 mg·kg−1 | 1, 5 | 0 to 20 h |
Vehicle: 0.5% HPMC 0.1% polysorbate 80 in water |
|
| Albuterol | 008 | HLS | Harlan, UK | Standard dry diet (Harlan Teklad 2021) | 12.4–16.5 kg | 17–20 months | M | 5 | Oral | 0, 3 mg·kg−1 | 1, 5 | 0 to 14 h | Vehicle: water |
| L‐NAME | 009 | AZ | Dog breeding Unit, AZ | SDS Dog DD3(E) SQC (Special Diet services) | 9–22 kg | >9 months | M | 4 | Oral | 0, 10 mg·kg−1 | 1, 5 | 0 to 20 h | Vehicle: water |
| Milrinone | 010 | AZ | Dog breeding Unit, AZ | SDS Dog DD3(E) SQC (Special Diet services) | 10–14 kg | 12–17 months | M | 4 | IV (15‐min infusion) | 0, 0.0375, 0.075 mg·kg−1 | 1, 5 | 0 to 1.5 h | Vehicle: 0.9% NaCl |
| Doses delivered by infusion (2 × 30 min) | |||||||||||||
| AZ001 | 011 | Cov | Covance research products, Kalamazoo, Michigan, USA | PMI nutrition International certified Canine diet no. 5007 | M 7.7–10.7 kg | 6–9 months | M + F | 6 | IV (1‐h infusion) | 0, 0.75, 5, 21 μmol·kg−1 | 1, 5 | −1 to 20 h | Latin square design |
| F 9.3–10.2 kg | Vehicle: sterile saline 90.9% NaCl adjusted to pH 4 | ||||||||||||
| 012 | AZ | Dog breeding Unit, AZ | Laboratory Diet A (Special Diet services) | 9.7–11.4 kg | 9 months | M | 1 | IV (15‐min infusion) | 0, 5, 50, 100 μmol·kg−1 | 1 | 0 to 3.75 h | Animals anaesthetized (propofol/alfentanil) with mechanical ventilation | |
| 3 | IV (1‐ or 15‐min infusion) | 0, 0.75, 1.5, 5, 25 μmol·kg−1 | 1 | 0 to 3.75 h | Vehicle: water containing 0.9% NaCl, pH 4. All doses given on 1 day. Adaptive design | ||||||||
| 013 | AZ | Dog breeding Unit, AZ | Laboratory Diet A (Special Diet services) | 11.6–15.4 kg | 10–65 months | M | 1 | IV (15‐min infusion) | 0, 10 μmol·kg−1 | 1 | −1 to 2.5 h | Animals anaesthetized (propofol/alfentanil) with mechanical ventilation | |
| 3 | IV (*1‐ or #15‐min infusion) | 0, 10* μmol·kg−1 + 10# μmol·kg−1 | 1 | −1 to 2.5 h | Vehicle: water containing 0.9% NaCl, pH 4. All doses given on 1 day. Adaptive design | ||||||||
| Verapamil | 014 | AZ | Dog breeding Unit, AZ | SDS Dog DD3(E) SQC (Special Diet services) | 9–22 kg | >9 months | M | 4 | Oral | 0, 5, 10, 15 mg·kg−1 | 1, 8, 15, 22 | −1 to 20 h | Vehicle: water |
| 015 | AZ | Dog breeding Unit, AZ | SDS Dog DD3(E) SQC (Special Diet services) | 14.5–18.3 kg | 19–25 months | M | 4 | Oral | 0, 1, 5, 15 mg·kg−1 | 1, 8, 15, 22 | −1 to 20 h | Vehicle: water | |
| 016 | AZ | Dog breeding Unit, AZ | SDS Dog DD3(E) SQC (Special Diet services) | 11.6–15.4 kg | 10–65 months | M | 4 | Oral | 0, 15 mg·kg−1 | 1, 8 | 0 to 24 h | Vehicle: water containing 0.9% sodium chloride | |
| Flecainide | 017 | AZ | Dog breeding Unit, AZ | SDS Dog DD3(E) SQC (Special Diet services) | 11.2–12.0 kg | 19–20 months | M | 4 | Oral | 0, 3, 10, 20 mg·kg−1 | 1, 8, 15, 22 | −1 to 20 h | Vehicle: 10% DMSO + water. Flecainide acetate (gelatin capsules) |
| Dofetilide | 018 | CRL | Harlan and Dog breeding Unit, AZ | PMI nutrition International certified Canine diet no. 5007 | 12.2–15.4 kg | 20–24 months | M | 4 | Oral | 0, 0.2 mg·kg−1 | 1, 8 | 0 to 24 h | Modified Latin square design, vehicle: 0.5% hydroxy methylcellulose (E4M) and 0.1% polysorbate 80 in water |
| 019 | AZ | Dog breeding Unit, AZ | SDS Dog DD3(E) SQC (Special Diet services) | 10.4–13.7 kg | 14–30 months | M | 4 | Oral | 0, 0.01, 0.06, 0.18 mg·kg−1 | 1, 6, 8, 13 | −1 to 20 h | Vehicle: 0.5% HPMC and 0.1% polysorbate 80 in water. Modified Latin square design |
2.2. In vivo studies
The standard dog cardiovascular telemetry safety pharmacology studies form part of the International Conference on Harmonisation (ICH) core battery of studies and follow the ICH S7A/S7B guidelines. Exploratory in vivo studies were carried out in house at AstraZeneca sites (Alderley Park, UK) or outsourced to Huntingdon Life Sciences (Huntingdon, UK), Charles River Laboratories (Edinburgh, UK) or Covance (Madison, WI, USA). All animal care and experimental procedures were performed in the United Kingdom under the authority of a valid Home Office project license and conformed to the UK Animals (Scientific Procedures) Act, 1986, and all other studies had local ethics committee approval. UK studies were carried out in agreement with UK Animals (Scientific Procedures) Act 1986. Animal studies are reported in compliance with the ARRIVE guidelines (Kilkenny, Browne, Cuthill, Emerson, & Altman, 2010a) and with the recommendations made by the British Journal of Pharmacology.
Cardiac effects were monitored using telemetry devices (DSI® PhysioTel) surgically implanted under anaesthesia prior to this study, as described earlier (Prior, McMahon, Schofield, & Valentin, 2009). The telemetry transmitter was placed in the abdominal muscle and the ECG electrodes sutured in a lead II configuration across the chest. A pressure catheter was also placed in the left ventricle. A minimum of 4‐week recovery was allowed between surgery and each study. All dogs were instrumented to monitor MAP, LVP, the ECG including HR, body temperature and activity.
Dogs were housed in groups of four or less except during recording days and feeding when they were housed individually. Pen size (~4 m2), pen temperature was kept within 20 ± 5°C and 12/12‐h light/dark cycles were maintained (Prior et al., 2009). Dry pellet food was offered in the afternoon and water provided ad libitum and toys were offered for environmental enrichment. Animal welfare was monitored visually by examining all animals for abnormal signs prior to the start of dosing and at each blood sampling time point and by recording food consumption and body weight.
Animals are allocated to study from the stock colony according to signal quality, veterinary approval (including clinical pathology results within normal ranges, where applicable) and wash‐out from previous use. Studies were performed in conscious male beagle dogs where all animals receive all doses, which inherently means groups of equal size within a study. The majority of studies were as ascending dose design (dosed the same test article on the same day) unless stated as modified Latin square design (accounting for group housing) in Table 1, where dogs are assigned different dose levels in different orders but no further randomization takes place. For welfare reasons and in accordance with guidelines from the relevant authorities, no blinding took place during dosing. Test item and control were administered in the morning by the same unblinded operator with an appropriate washout between dosing (minimum 3 days) and recordings were made from approximately 1 h before administration to around 24 h following administration (according to the pharmacokinetics of individual compounds). Typical dose volume ranged 1–2 ml·kg−1 for infusion and 5 ml·kg−1 oral. Infusions were via catheter implanted in the jugular vein.
An adaptive design was employed where necessary and dose levels/infusion lengths can be reduced/removed upon observation of large magnitude of effects for welfare reasons (Table 1). Inside the telemetry pens, animals were allowed to move freely at all times except during dosing and blood sampling for PK determination. All plasma concentrations were determined by LC–MS/MS.
The number of animals utilized in telemetry studies was based on a power analysis. This model was powered using the pooled estimate of the SD, using data from seven historical studies. The power analysis is based on applying an equivalent to a two‐sided Student's t test at each time point tests with a significance level of 5%. These data found that a minimum of four animals gives the study 80% power to detect approximately 9% (6%) difference in QT (QTcR), 31% difference in HR and 13% difference in arterial BP from vehicle (change is expressed as a percentage of the parameter vehicle mean). Therefore, group sizes were equal within a study for statistical purposes.
2.3. Data and analysis
Data acquisition and analysis are detailed earlier (Prior et al., 2009) at a sampling rate of 500 Hz. All parameters are reported at selected time points from pre‐dose up to 24 h after dosing, where time 0 is the mean of pre‐dose measurements, −1, −0.75, −0.5 and −0.25 h. At each time point, BP and temperature parameters were averaged over 1 min. No outliers were excluded. This process is largely automated, although visual checks of the automated ECG, BP and HR measurements are made. Data analysis is not conducted in a blinded manner. As these studies generate quantitative data, with a high level of automated data analysis, there is little opportunity for individual bias to be introduced. The assessments are typically performed in a high throughput environment where the operators have no investment in the outcome of the study reducing the risk of bias.
The group size is the number of independent values, though statistical results were not undertaken as group size was typically less than 5 and due to the intent to analyse multiple parameters in semi‐mechanistic modelling platform with simultaneous fitting of multiple endpoints. In this type of model, deviations from vehicle effects over time are captured as being driven by plasma concentrations (as described by a pharmacokinetics), with a single concentration–response relationship across dose levels. Non‐linear mixed effects modelling (Bauer, 2019) is utilized to capture sources of variability such as inter‐individual differences. No further post hoc testing was performed. The results are reported in compliance with the ARRIVE guidelines (Kilkenny, Browne, Cuthill, Emerson, & Altman, 2010b; McGrath & Lilley, 2015). The data and statistical analysis comply with the recommendations of the British Journal of Pharmacology on experimental design and analysis in pharmacology (Curtis, Ashton, Moon, & Ahluwalia, 2018).
2.4. Population pharmacokinetic models
Pharmacokinetic models to describe dose–exposure relationships within beagle dogs were either (i) developed using AZ's in‐house experimental data of measured plasma concentration–time profiles (i.e. AZ001) and/or plasma concentration–time profiles from literature reports (i.e. for atenolol, milrinone and dofetilide) or (ii) adapted from available literature reports (i.e. for salbutamol, L‐NAME, verapamil and flecainide) (Auclair et al., 2000; Bergenholm, Collins, Evans, Chappell, & Parkinson, 2016; Buchanan et al., 2016; Edelson, Koss, Baker, & Park, 1983; Gotta et al., 2015; Guth et al., 2015; Howgate & Aarons, 2013; McAinsh & Holmes, 1983; Ollerstam et al., 2007; Parkinson et al., 2013; Pfeiffer, Leopold, Schmidt, Brunner, & Mayer, 1996). The pharmacokinetic models and data used are described in Supplemental Section A for each drug included in this analysis.
2.5. Circadian rhythm model
Measurements of in vivo dPdtmax (CON measured, mmHg·s−1) from dog telemetry studies were modelled to be composed of two components as described in Equation (1):
| (1) |
where CON is a physiological state variable representing contractility which can be altered by the action of a drug and CR CON is the circadian rhythm within dPdtmax. Measured heart rate (HR measured, bpm) and measured mean arterial pressure (MAP measured, mmHg) were formulated as a combination of the physiological states, HR and MAP and the corresponding circadian rhythms (CR HR and CR MAP) shown in Equations (2) and (3), respectively.
| (2) |
| (3) |
The circadian rhythm within each measurement was described by a series of cosine functions to describe the periodic with‐in‐day variations (Equation 4).
| (4) |
where Amp 24/n,VAR and T Peak,2/.n,VAR represent the amplitude and peak time of the nth cosine wave. The circadian rhythms tested had periods of 6, 8, 12 and 24 h for each of the VAR's (dPdtmax, HR or MAP), separately.
2.6. Contractility and haemodynamics model
Contractility and haemodynamics model was used to describe physiological state variables in dogs using well‐established physiological relationships (Snelder et al., 2013, 2014). The model development followed a multiple‐step approach: first, inclusion of the description of MAP being a multiplicative of CO and TPR where CO was calculated based on stroke volume (SV) and HR (Equation 5):
| (5) |
Second, extension of a more detailed mechanistic description of SV was included by taking into account CON and HR (Equation 6).
| (6) |
where BSLHR is the baseline HR in the absence of any drug effect and parameter HRSV is a factor accounting for the effect of lowering SV due to shorter filling time with increased HR during diastole (Snelder et al., 2013, 2014). The natural logarithm function was used and estimated the difference between HR and BSLHR in comparison to a simple algebraic difference to provide greater numerical stability.
Lastly, the description of the core physiological states of the system was extended using an indirect response model, incorporating (i) a description of the baroreflex feedback mechanism as a negative feedback from MAP and (ii) pharmacological effect of the drug on the physiological states (Equations 7, 8 and 9).
| (7) |
| (8) |
| (9) |
where K in,CON, K in,HR and K in,TPR represent the respective zero‐order generation rates; K out,CON, K out,HR and K out,TPR, represent the respective first‐order degradation rates; and FB characterizes the extent of feedback from MAP. Finally, E CON, E HR and E TPR represent the pharmacological induction or inhibition of the generation rates of the respective physiological states. The drug effect on CON, HR or TPR was modelled using either linear or Emax models as shown in Equation (10).
| (10) |
2.7. Population PK/PD model development
Population PK and PK/PD model development was performed using NONMEM® 7.3 (GloboMax/ICON, Ellicott City, MD) with data pre‐processing and model results post‐processing performed using R version 3.3. Population PK Parameters and Data modelling approach was utilized along with the first‐order linear conditional estimation method with interaction. The inclusion of drug effect in the model was driven primarily by the known mechanism of action (e.g. milrinone, a PDE inhibitor, is known to be a positive inotrope and vasodilator), as well as other factors such as additional in vitro or in vivo supporting evidence, or on the plausibility based on the observed dog data. Different drug effect models (Emax and linear models; Equation 10) were tested to use the simplest model that appropriately describes the data. Inter‐individual variability (IIV) was described by a log–normal parameter distribution in the model and additive and proportional error models were evaluated during the initial model development to describe the residual unexplained variability. Initial comparison between different models was based on a drop in objective function value (OFV). A drop in OFV of 3.84 (P < 0.05, degrees of freedom = 1) between nested models was considered statistically significant. Additionally, models were evaluated using diagnostic goodness of fit (GOF) plots to identify possible trends suggesting any model misspecification. The final drug effect model structure was based on a combined consideration of model fits and the strength of prior evidence.
2.8. Covariate effect on dPdtmax
dPdtmax, a biomarker for cardiac contractility, is dependent on the contractile state (CON) as well as on the preload conditions of the heart. Left ventricular end‐diastolic pressure (LVEDP), consistently measured across studies, is a biomarker for preload conditions. LVEDP was evaluated as time‐varying covariate on dPdtmax to correct for the effect of preload using a simple linear model as shown in Equation (11).
| (11) |
2.9. Population PK/PD model evaluation
The final model robustness was evaluated using non‐parametric bootstrap by estimating model parameters for 500 randomly sampled bootstrap datasets. The uncertainty in parameters from the final model runs was evaluated by comparing the point estimates to the calculated median, 2.5th and 97.5th percentiles for each parameter from the bootstrap runs. The models were further evaluated using prediction corrected Visual Predictive Checks (pcVPCs) by simulating 1,000 replicates of the original dataset (Bergstrand, Hooker, Wallin, & Karlsson, 2011). The median, 5th and 95th percentiles of the simulations and observations were plotted and overlaid with the observations to evaluate any potential differences in trends and possible model misspecifications.
Sobol, a global sensitivity analysis, was performed to identify key parameters contributing to the model fit (Zhang, Trame, Lesko, & Schmidt, 2015). Sobol sensitivity analysis is based on the ANOVA and has recently been proposed as a useful and robust methodology to evaluate systems pharmacology models with the advantage of evaluating the effect of simultaneous changes in multiple parameters as opposed to a one‐at‐a‐time sensitivity analysis approach. Monte Carlo simulations were performed across a wide range of parameters without the inclusion of IIV. The square root of sum of squared errors was used as model output for three different outcomes, namely, dPdtmax, HR and MAP. Total order sensitivity indices were used to evaluate the impact of parameter variability on output variability.
3. RESULTS
Statistically significant changes in relevant parameters of all dosed groups are in the Supporting Information.
3.1. Circadian rhythm
Baseline and placebo data from n = 6 atenolol studies (all except study 003; due to the short experimental duration; Table 1) were used to identify key harmonics that best describe trends within each measurement (viz, dPdtmax, HR and MAP) by estimating constant baseline levels. Studies of atenolol were chosen for model development as it had the highest number of studies and observations available. However, due to the overall sparseness of data, the number of harmonics was limited to four corresponding periods of 24, 12, 8 and 6 h. Baseline and placebo dPdtmax and MAP data were adequately described using a single 24‐h rhythm for all six atenolol studies. HR was best described using a combination of two cosine functions with rhythms of 24 and 6 h. Visual inspection of the baseline and placebo data was consistent with the identified key harmonics. Diagnostic plots for the baseline and placebo model showed no observable trends with respect to time.
Parameters describing the underlying circadian rhythm were estimated simultaneously for baseline placebo and drug effect. Estimates of amplitudes for dPdtmax, HR and MAP for different studies, dosing and different drugs ranged between 1% and 20% suggesting that diurnal variation would result in up to 20% variation of the daily average value. The design and timeline of the study 010, in which the effect of milrinone was studied, were short (1.5 h) compared to other studies and had limited information to capture the entire diurnal trend. Due to this, the amplitude of the diurnal variations was fixed based on the salbutamol model as it was found to be slightly better than other models in terms of the overall model fit.
3.2. Contractility and haemodynamics model results
The contractility and haemodynamics model was used to adequately capture diurnal variation, drug‐induced changes and inter‐animal variation based on the sparse measurements available in routine dog telemetry studies. The developed semi‐mechanistic modelling platform simultaneously captures changes in dPdtmax, HR and MAP for multiple drugs to assess the haemodynamic safety profile. Model parameter estimates including all baseline/placebo and drug effect data from all studies for each of the compounds are presented in Table 2. IIV was estimated for each of the baseline parameters Base CON, Base HR and Base TPR. The model was evaluated using routine diagnostic GOF plots that indicated no trend of model misspecification. The residual errors on dPdtmax, HR and MAP were best described using additive residual error models, with conditional weighted residuals and individual weighted residuals plots showing no trends of model misspecification (Supplemental Section B). IIV in drug parameters was evaluated by adding log‐normal IIV and was retained if the model fit improved significantly (difference in objective function value [dOFV] < −3.84).
TABLE 2.
Final PKPD parameter estimates for the integrated contractility and hemodynamics model for different drugs. +Linear covariate model was centered around observed median LVEDP in atenolol studies. *Median with 5th and 95th Confidence Interval from 500 Bootstraps.**Kout,HR was fixed to the final parameter estimate from the atenolol model. ***Milrinone parameters were fixed based on albuterol final parameter estimates due to short experimental time frame of the milrinone study.
| Atenolol | Lname | Albuterol | AZ001 | Verapamil | Flecainide | Milrinone | Dofetilide | |
|---|---|---|---|---|---|---|---|---|
| Base CON (mmHg/s) | 3020.0 [3014.7 (2855.3‐3185.9)] | 2950.0 [2940.6 (2853.6‐3044.9)] | 3030.0 [2996.7 (2712.4‐3137.4)] | 3110.0 [3111.4 (2787.1‐3436.4)] | 2640.0 [2648.6 (2457.9‐2825.4)] | 2770.0 [2773.2 (2744.9‐2825.9)] | 2590.0 [2656.5 (2385.1‐3564.0)] | 2910.0 [2965.6 (2756.0‐3189.9)] |
| BaseHR (bpm) | 79.7 [79.8 (77.5‐82.3)] | 85.6 [85.5 (78.7‐94.2)] | 72.6 [72.9 (68.4‐78.2)] | 91.7 [91.8 (89.9‐94.0)] | 71.9 [72.1 (68.3‐76.6)] | 78.1 [77.8 (75.1‐80.6)] | 79.5 [83.5 (69.8‐98.3)] | 82.1 [79.6 (75.9‐83.4)] |
| Base TPR | 0.43 [0.43 (0.41‐0.45)] | 0.43 [0.43 (0.38‐0.47)] | 0.49 [0.49 (0.44‐0.55)] | 0.29 [0.29 (0.27‐0.31)] | 0.5 [0.5 (0.5‐0.6)] | 0.47 [0.47 (0.46‐0.48)] | 0.58 [0.55 (0.41‐0.72)] | 0.40 [0.43 (0.40‐0.48)] |
| kout, CON (h ‐1 ) | 10 | 10 | 10 | 10 | 10 | 10 | 10 | 10 |
| kout, HR (h ‐1 ) | 10 | 10 | 10 | 10 | 10 | 10 | 10 | 10 |
| kout, TPR (h ‐1 ) | 10 | 10 | 10 | 10 | 10 | 10 | 10 | 10 |
| FB (mmHg ‐1 ) | 4.02 [3.51 (1.01‐7.69)] | 5.30 [5.30 (4.76‐5.84)] | 7.55 [7.55 (7.14‐7.97)] | 6.32 [6.26 (4.55‐7.81)] | 7.9 [7.9 (7.2‐8.4)] | 9.05 [8.89 (6.77‐9.31)] | 1.140 [1.136 (0.011‐4.271)] | 8.64 [7.25 (5.98‐8.25)] |
| HR_SV | 2.45 [2.58 (1.52‐2.99)] | 0.004 [0.004 (0.003‐0.005)] | 0.61 [0.59 (0.47‐0.65)] | 0.0005 [0.0008 (0.0002‐0.0011)] | 0.68 [0.71 (0.47‐0.83)] | 0.87 [0.79 (0.66‐1.02)] | 0.61* | 0.1 [0.0 (0.0‐0.0)] |
| Covariate Model | ||||||||
| LVEDPmed (mmHg) | 8.99 | 8.99 | 8.99 | 8.99 | 8.99 | 8.99 | 8.99 | 8.99 |
| Slope | 0.11 [0.11 (0.08‐0.13)] | 0.08 [0.08 (0.02‐0.14)] | 0.10 [0.11 (0.06‐0.40)] | 0.34 [0.33 (0.17‐0.46)] | 0.05 [0.04 (0.02‐0.07)] | 0.02 [0.02 (‐0.08‐0.16)] | 0.13 [0.11 (0.05‐0.31)] | 0.04 [0.05 (0.03‐0.08)] |
| Drug Related Parameters | ||||||||
| E max,C | 0.22 [0.24 (0.19‐0.35)] | 0.37 [0.37 (0.28‐0.45)] | 0.97 [1.00 (0.62‐1.09)] | 0.3 [0.3 (0.2‐0.3)] | 1.27 [1.30 (1.15‐1.47)] | 0.093 [0.091 (0.057‐0.106)] | 0.8 [1.0 (0.9‐1.3)] | |
| EC 50,CON | 8.94 [10.07 (2.61‐52.80)] | 0.62 [0.59 (0.30‐0.65)] | 6.2 [7.0 (0.9‐12.5)] | |||||
| E max,HR | 0.19 [0.19 (0.16‐0.29)] | 0.10 [0.10 (0.04‐0.17)] | ||||||
| EC 50,HR | 21.30 [22.36 (5.64‐81.87)] | 11.3 [0.6 (0.1‐60.2)] | ||||||
| E max,TPR | 1.38 [1.38 (1.03‐1.76)] | 0.99 [0.99 (0.91‐1.08)] | 0.51 [0.50 (0.42‐0.59)] | 0.13 [0.13 (0.11‐0.19)] | ||||
| EC 50,TPR | 131.0 [124.3 (72.9‐177.9)] | |||||||
| Inter‐animal variability | ||||||||
| Base,CON | 0.19 [0.18 (0.14‐0.21)] | 0.05 [0.05 (0.00‐0.06)] | 0.00 [0.05 (0.00‐0.07)] | 0.20 [0.20 (0.13‐0.25)] | 0.161 [0.155 (0.108‐0.189)] | 0.052 [0.047 (0.001‐0.071)] | 0.124 [0.123 (0.001‐0.147)] | 0.27 [0.27 (0.15‐0.34)] |
| Base,HR | 0.17 [0.16 (0.14‐0.19)] | 0.14 [0.10 (0.01‐0.16)] | 0.01 [0.05 (0.00‐0.10)] | 0.09 [0.08 (0.06‐0.10)] | 0.133 [0.127 (0.095‐0.153)] | 0.053 [0.041 (0.001‐0.059)] | 0.262 [0.250 (0.003‐0.321)] | 0.14 [0.08 (0.05‐0.12)] |
| Base,TPR | 0.25 [0.24 (0.19‐0.29)] | 0.14 [0.12 (0.04‐0.19)] | 0.02 [0.09 (0.00‐0.16)] | 0.17 [0.16 (0.07‐0.21)] | 0.215 [0.203 (0.131‐0.260)] | 0.027 [0.027 (0.000‐0.044)] | 0.311 [0.282 (0.024‐0.384)] | 0.31 [0.24 (0.14‐0.32)] |
| E Max,CON | 0.43 [0.30 (0.16‐0.65)] | |||||||
| E Max,HR | 0.24 [0.22 (0.14‐0.29)] | |||||||
| Residual Unexplained Variability | ||||||||
| E CON | 345.0 [333.0 (297.1‐379.5)] | 324.0 [316.7 (282.8‐342.9)] | 471.0 [465.5 (395.4‐552.9)] | 801.00 [794.28 (647.55‐909.08)] | 343.00 [339.15 (305.33‐374.23)] | 264.00 [256.27 (248.21‐269.95)] | 297.0 [297.0 (171.1‐368.7)] | 337.0 [311.3 (272.8‐336.4)] |
| her | 10.9 [10.9 (9.6‐12.2)] | 13.2 [13.2 (10.1‐14.8)] | 11.60 [11.43 (8.63‐13.64)] | 19.3 [19.2 (17.7‐20.6)] | 12.00 [11.74 (10.59‐12.81)] | 12.1 [12.1 (11.9‐12.5)] | 14.8 [14.8 (8.9‐18.9)] | 12.30 [11.52 (10.50‐12.42)] |
| E MAP | 7.47 [7.43 (6.98‐7.89)] | 8.86 [8.68 (7.95‐9.27)] | 10.70 [10.37 (9.02‐11.68)] | 13.20 [13.12 (12.47‐13.84)] | 8.09 [7.99 (7.29‐8.85)] | 6.9 [6.9 (6.7‐7.2)] | 7.32 [7.32 (6.62‐7.95)] | 6.97 [6.92 (6.42‐7.22)] |
The estimates of the baseline parameters for dPdtmax, HR and TPR were within the range as expected based on visual inspection of the data. The first‐order elimination rates were initially estimated using the developed model and estimates ranged from 33 to 188 h−1 for atenolol while the estimates for other drugs ranged from 0.3 to 9,000 h−1 (data not shown). Most of the estimated K out's were greater than 10 h−1 which represents a response half‐life of ~4.2 min. Interchanging the elimination rates from one model with another did not alter the fit and yielded in the same OFV. Given that the sampling frequency of the measurements was typically slower (at least a few minutes) than the half‐lives of the elimination rates, it would not be feasible to estimate elimination rates higher than 10 h−1. Therefore, the elimination rates for all three equations were fixed to 10 h−1. Preliminary efforts in estimating different feedback parameters (FBCON, FBHR, FBTPR etc.) for different states had limited success due to parameter identifiability. The model parameter estimates for feedback from BP (FB) and the effect of heart rate on stroke volume (HRSV) were estimated to be different across different drugs.
Drug effects of each drug (n = 8) included in this analysis (all model and data files are included at https://doi.org/10.5061/dryad.fttdz08pq) were included into the developed contractility and haemodynamic semi‐mechanistic modelling platform based on their individuals' mechanism of action. Figure 1 shows the semi‐mechanistic modelling platform indicating the inclusion of the drug effects as follows:
-
1
Atenolol
FIGURE 1.

Mechanism‐based model platform to predict cardiac contractility. Contractility (CON), heart rate (HR) and total peripheral resistance (TPR) are modelled using IDR models with drug effects on respective Kin's. Cardiac output (CO) is determined by CON (representing stroke work) and HR (frequency). Mean arterial pressure (MAP) is determined by the product of CO and TPR. Diurnal variations are modelled for measured quantities (CON, HR and MAP). A negative feedback from MAP to CON, HR and TPR captured the homeostatic BP control mechanisms
Drug effect of atenolol was implemented as a negative effect on CON (negative inotropy) and HR (negative chronotropy) using Emax models. The estimates of Emax for CON and HR were 22% and 19%, respectively and were consistent with a ~20% drop in each dPdtmax and HR observed at high doses in the current studies (Figure 2) and reported in literature (Guth et al., 2015). Simultaneous decrease in in vivo dPdtmax and in vivo HR was observed. Atenolol, a β1‐selective antagonist, simultaneously impacts both CON and HR. Simultaneous drug effect inclusion on CON and HR was found to describe the data best rather than inclusion of a drug effect on either CON or HR alone.
-
2
Salbutamol
FIGURE 2.

Visual predictive check for contractility, heart rate and mean arterial pressure for (a) atenolol, (b) salbutamol/albuterol, (c) L‐NAME, (d) milrinone, (e) dofetilide, (f) verapamil, (g) flecainide and (h) AZ001. Representative prediction corrected VPC plots for the PK/PD models. Blue dots represent observations. Red/black solid lines represent the median of the data/simulations, respectively. Red and black dashed lines represent the 5th and 95th percentile of the data and simulation, respectively. The shaded areas represent 95% confidence intervals for the simulated median (red shaded area), 5th and 95th (blue shaded areas) percentiles
Drug effect of salbutamol was found to increase dPdtmax and HR and decrease MAP. Salbutamol, administered as nebulized dose over 15 min, was absorbed via the lungs and the GI tract resulting in two plasma concentration–time profile peaks. Two peaks could also be visualized in the observed dPdtmax and HR data, though not as clear for MAP. The effect of salbutamol was well captured using a vasodilatory (TPR) and positive chronotropic (HR) effect using an Emax drug effect model. Other incorporations of the drug effect on only TPR or HR resulted in poorer fits as observed in terms of increased OFV and GOF plots.
-
3
L‐NAME
The effect of L‐NAME was captured by incorporating a drug effect on TPR and CON. The pharmacological effect of L‐NAME, hypothesized to be mediated solely through its hydrolysed metabolite L‐NOARG (Pfeiffer et al., 1996), was to inhibit the NO synthesis pathway thereby resulting in vasoconstriction. Initially, the effect of L‐NAME was evaluated using a single linear model on TPR. While this captured the model predicted increase in MAP well, dPdtmax was predicted to decrease (data showed an increase) owing to negative feedback from the increased BP. This, however, was rectified by using an Emax drug effect model on CON, thereby incorporating a positive inotropic effect that had been proposed earlier (Brady, Poole‐Wilson, Harding, & Warren, 1992) as pharmacological effect of NO inhibition.
-
4
Milrinone
The drug effect of milrinone, a PDE3 inhibitor, was captured by incorporating its positive inotropic effect on CON and its vasodilating effect on TPR (Borow et al., 1985) using linear drug effect models. This model adequately captured the observed increase in dPdtmax and the slight decrease in mean BP.
-
5
Verapamil
Verapamil drug effect was best incorporated as vasodilatory and negative inotropic drug effect (Verapamil prescription information; Pérez, Borda, Schuchleib, & Henry, 1982) using linear drug effect models. Verapamil is a slow calcium ion channel blocker which results in a reduced entry of Ca2+ ions within cardiomyocytes with negative inotropic effects as well as in smooth muscles resulting in vasodilation. The drug effect of verapamil on TPR had a more prominent effect than on CON. This can be evidenced at the highest dose, where an increase in dPdtmax is observed suggesting that the negative inotropic effect is superseded by the baroreflex feedback to a decrease in MAP as a result of the vasodilatory effect.
-
6
Flecainide
In dogs, the primary effect of flecainide was sufficiently well captured using a linear drug effect model on CON (Hoffmeister, Hepp, & Seipel, 1987) and captured the reduced dPdtmax which was sufficiently well captured along with other haemodynamic effects. An alternate negative chronotropic model evaluated as in vitro chronotropic (Scott et al., 2014) effect of flecainide was not able to capture the drug effect. Similarly, addition of a drug effect on TPR resulted in little to no improvement in model fits (dOFV = −0.04). Flecainide is known for its negative inotropic effects (Hoffmeister et al., 1987), though there are limited in vitro and in vivo evidence for its effects on HR.
-
7
Dofetilide
Pharmacological effect of dofetilide was captured using a linear drug effect model on CON (del Rio & Hamlin, 2013; Zhang et al., 2009). Dofetilide is an anti‐arrhythmic agent which prolongs the QT interval via hERG block which in turn may cause higher calcium influx via L‐type calcium channels resulting in increased contractility (Zhang et al., 2009). Dofetilide has shown to have increased contractility in vitro, though we were not able to identify any evidence of dofetilide impacting vascular tone resulting in reduced BP. These findings are consistent with the in vivo observations of increased dPdtmax in our analysis.
-
8
AZ001
Incorporating a drug effect on CON alone described the observed trends after AZ001 dosing adequately. AZ001 was suspected to have a negative inotropic effect based on in vitro and in vivo experiments (data not shown), which translated into negative inotropy in the clinic. Dosing of AZ001 resulted in a marked decrease in dPdtmax as well as a marked decrease in MAP, while the effect on HR was significantly smaller.
A more detailed description of the PK/PD modelling and the respective results are presented in Supplemental Section C.
3.3. Covariate effect on dPdtmax
Inclusion of preload, LVEDP, as a covariate was evaluated as a time‐varying linear and power covariate model on CON to account for the impact of concurrent preload measurement on the corresponding dPdtmax measurement. Preliminary evaluation using all atenolol studies revealed that a linear covariate model resulted in a similar model fit compared to the power model, although the linear model was found to have a lower OFV (dOFV = −10). LVEDP was found to be a statistically significant (dOFV < −3.84) covariate on dPdtmax for all drugs included in this work except milrinone, though the trend was very similar (dOFV = −3.05). Consistent slope estimates were obtained across the different models with preload correction accounting for about 5%–13% correction of dPdtmax for every 10‐mmHg LVEDP with the exception of the AZ001 and flecainide models where the correction accounted for 30% and 3% in dPdtmax, respectively. Overall, incorporation of the covariate effect LVEDP on dPdtmax resulted in better model predictions and model fits (Figure 3).
FIGURE 3.

Impact of incorporation of end‐diastolic left ventricular pressure (LVEDP) as a covariate on dPdtmax to correct for the effect of preload
3.4. Model evaluation
Results of model evaluation based on bootstrap analyses, performed to characterize the robustness of the model parameters, suggest that the model parameters were adequately estimated (Table 2). Overall, good agreement was observed within the population mean parameters and bootstrap median estimates across all models. The uncertainty in the IIV parameters was higher in certain cases which can be expected due to limited sample size in some of the studies. Model evaluation was further performed using pcVPC (Bergstrand et al., 2011) which suggested that the model was able to capture the drug effect on all three parameters (CON, HR and MAP) adequately well (Figure 2). Consistent with the bootstrap results, the pcVPC's suggest that IIV in parameters is over‐predicted, potentially due to limited number of animals per study. Global sensitivity analysis was performed using an ANOVA ‘Sobol's method’ (Zhang et al., 2015) to identify the most influential parameter for each outcome measurement (i.e., dPdtmax, HR and MAP) in the model (Figure 4). Results from the sensitivity analysis suggest that baseline and diurnal rhythm parameters were the most sensitive primary parameters influencing the model fits. The slope of the covariate model was found to be an important parameter for dPdtmax measurement. FB and drug effect‐related parameters were also sensitive, though its effect was lesser than the primary ones.
FIGURE 4.
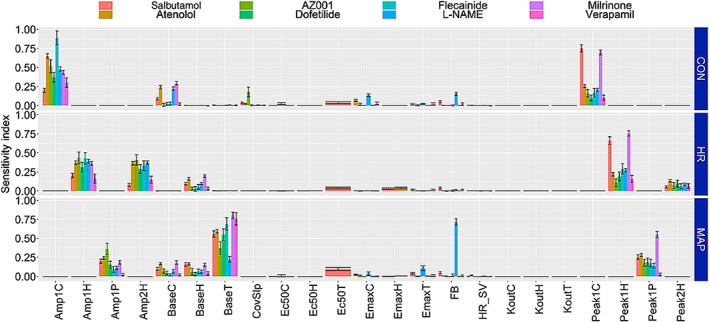
Sobol sensitivity indices for parameters from the contractility models. The displayed total order sensitivity indices represent the relative importance of parameters with critical parameters having higher indices. The importance of each of the parameters was evaluated with respect to each of the three desired outputs contractility (CON), heart rate (HR) and mean arterial pressure (MAP)
4. DISCUSSION
The developed contractility and haemodynamics semi‐mechanistic modelling platform is an extension of the initial efforts (Francheteau et al., 1993; Snelder et al., 2013, 2014) using a semi‐mechanistic modelling framework to simultaneously capture trends of commonly measured cardiovascular parameters dPdtmax, HR and MAP measured routinely in dog telemetry studies and therefore demonstrates a potential refinement in the analysis of such data.
The developed modelling framework accounts for diurnal variation, physiological feedback and pharmacological effects and adequately predicts outcomes of different drug classes including atenolol (β‐adenoceptor antagonist ), verapamil (calcium channel blocker), salbutamol (β‐agonist), L‐NAME (NOS inhibitor), milrinone (PDE inhibitor) and flecainide (class 1C arrhythmic) with a range of pharmacological activities on the cardiovascular system. Pharmacological effects are often mediated via physiological feedbacks helping to maintain homeostasis, a factor that can lead to misinterpretation of the mechanism of action when drug effects are analysed. A retrospective analysis of dog telemetry studies done over a 5‐year period found 66% of NME to have an effect of dPdtmax (Skinner et al., 2012). A similar retrospective analysis performed over a period of 10 (Buchanan et al., 2016) years found that only 27% of NME's in development across different therapeutic areas altered dPdtmax. Further analysis (Buchanan et al., 2016) of the effects of these 27% NME's revealed that the effects were mediated directly through CON for 9% of the NME's while the remaining 18% NME's were indirect effects from alterations in HR and/or BP. Simultaneous fitting of dPdtmax, HR and MAP enables one to develop a more holistic understanding of the drug effect on the system thereby helping to delineate the direct drug effects from the indirect drug effects.
The model developed by Snelder et al. (2013, 2014) was used as a starting point and adjusted throughout the model development to account for specific key differences driven by the input data. Key differences between the models are as follows: (i) the model developed by Snelder et al. used data from rat models which have been known to have different cardiac electrophysiology than humans (Olson et al., 2000). Dogs are a frequently used species to investigate cardiovascular safety events during drug developmen and the exposure–response relationship for dPdtmax observed between dogs and humans has been reported to be well correlated (Guth et al., 2015). (ii) The Snelder model was built using experimental data where SV was measured directly, thereby making direct measurements of peripheral resistance possible. The focus of this effort was to use routine dog telemetry data where SV is not routinely measured and the frequency of such measurements is much lower and can be very noisy. (iii) The developed model is further adapted to capture dPdtmax, which is a representative of the cardiac inotropic state. dPdtmax is the most widely used preclinical marker for cardiac contractility and has been known to be correlated to other inotropic markers such as LVEF and QA interval (Adeyemi et al., 2009; Feneley, 2013; Guth et al., 2015; Hamlin & del Rio, 2010, 2012; Wallis, Gharanei, & Maddock, 2015). Finally, the diurnal model was altered to allow the model to decompose the measured quantity into two factors: one accounting for diurnal variations and the second factor representing the core physiological state which can be altered by other physiological variables and by the drug's action. In our opinion, the change in the structure compared to the Snelder model made the interpretation of diurnal variation easier and more physiologically intuitive. While there are key differences, it is important to contrast the similarities between the two models in common parameter estimates. The estimates for baseline parameters were comparable given species differences. The estimates for feedback parameters across different models in this effort were very similar to those reported by Snelder et al. For example, the estimates of K out's for TPR and HR were similar, though the K out for SV was 2 orders of magnitude lower than the one used for dPdtmax. This difference could be due to differences in biomarkers as well as species differences and warrants further investigation.
The current semi‐mechanistic modelling platform can be used in drug development settings to understand the effect of a single dose resulting in multiple measured contractility and haemodynamic outcomes and to hypothesize and evaluate pharmacological effects of NME's. This is an important consideration as a large fraction of drugs included in this analysis altered multiple contractility and haemodynamic states. The developed contractility and haemodynamics semi‐mechanistic modelling platform can be utilized to explore a holistic understanding of multiple system level effects of new drugs, thereby triggering potential follow‐up experiments in order to better understand and characterize safety pharmacology. Assuming similarities in cardiovascular physiology between dogs and humans, this modelling platform can be used to predict drug‐induced changes in humans by altering the PK models and baseline PD parameters. Further investigations are required to evaluate the translational potential of this model.
To our knowledge, this is the first time a preload measure (LVEDP) has been used as a predictive time‐varying covariate for contractility (dPdtmax) in a PK/PD setting. This covariate relationship is consistent with the Starling's law, a physiological relationship well established at cellular and organ levels (Konhilas, Irving, & de Tombe, 2002). Across different models presented here, the correction of dPdtmax accounted for about 8%–13%, except for the AZ001 model where it accounted for a correction of around 30% in dPdtmax. This could also be an artefact of moderate decreases observed in dPdtmax in other studies with negative inotropes, while in the case of AZ001, high doses used resulted in very low dPdtmax measures (<1,000 mmHg). While it is well known that dPdtmax measurements are affected by preload and afterload (Anrep effect), the extent of it is not yet well understood. Our results show that dPdtmax is moderately affected by preload as it accounts for up to 10% variation in the signal. These findings are consistent with earlier reports that show a moderate effect of preload on contractility (Zimpfer & Vatner, 1981).
While there are novel elements in this research, there are a few limitations which need to be taken into consideration. While this model has a mechanistic basis and captures the trends between preload and dPdtmax, it does not capture a correlation between HR and dPdtmax directly (Bowditch effect) which has been reported for placebo data previously (Markert et al., 2007). In the model, CON and HR account for independent observable states that are maintained independently. While the model includes CON, HR and TPR as independent states of the haemodynamic system (altered by drugs), further model adaptation might be required to adequately describe drugs that affect blood volume or drugs that alter venous compliance only (e.g. diuretics). Further, the model currently focuses on developing a mechanistic understanding of the routine safety data collected during dog telemetry studies which are focusing only on acute affects after a single dose and might not account for long‐term trends. For example, atenolol is used as a medication for hypertension (Carlberg, Samuelsson, & Lindholm, 2004), though lowering of BP is not observed in any of our studies in the dog after a single dose. This is because chronic dosing of atenolol (Amer, 1977; Heel, Brogden, Speight, & Avery, 1979) results in a shift in the physiological state that cannot be captured in experiments after single doses. Finally, the translational link between dPdtmax and clinical measures of contractility such as LVEF is not fully understood. One way to achieve quantitative translation between dog and human would be to build a systems model with a similar structure based on clinical data and endpoints such as LVEF, utilizing the same drugs or those acting via the same or similar mechanisms. In this manuscript, we have developed a semi‐mechanistic mathematical description of the cardiovascular system that enables us to capture the trends across multiple haemodynamic endpoints from routine preclinical safety pharmacology studies performed during drug development.
5. CONCLUSIONS
In the present study, we have extended early work on cardiovascular activity in rats to include cardiac contractility in dogs, the most common species employed for cardiovascular safety studies (Guth et al., 2015). To our knowledge, this is the first report where a single model was used to capture trends across multiple haemodynamic endpoints from routine preclinical safety pharmacology studies performed during drug development. Using the known mechanism of action of the drug, the developed contractility and haemodynamics semi‐mechanistic modelling platform was able to capture trends reasonably well for multiple drugs. Further, this platform was used to capture trends for a novel compound, which was known to significantly alter cardiac contractility. The modelling platform further incorporates a description of the Starling's law by the inclusion of a covariate to correct for the effect of preload on the measure of contractility (dPdtmax). Overall, the developed semi‐mechanistic modelling platform simultaneously captures drug‐induced changes in dPdtmax along with other haemodynamic end‐points, HR and MAP, for multiple drugs in order to assess haemodynamic safety profiles.
ACKNOWLEDGEMENT
The project was funded by AstraZeneca.
AUTHOR CONTRIBUTIONS
R.V., T.A.C., J.T.M. and M.N.T. analysed and interpreted the data. T.A.C., L.J.L., J.T.M. and M.N.T. contributed to the concept and the design of this research plan. R.V., T.A.C., L.J.L., J.T.M. and M.N.T. wrote the manuscript.
CONFLICT OF INTEREST
The authors have no conflicts of interest.
DECLARATION OF TRANSPARENCY AND SCIENTIFIC RIGOUR
This Declaration acknowledges that this paper adheres to the principles for transparent reporting and scientific rigour of preclinical research as stated in the BJP guidelines for Design & Analysis and Animal Experimentation, and as recommended by funding agencies, publishers and other organizations engaged with supporting research.
Supporting information
Data S1: Supporting Information
Venkatasubramanian R, Collins TA, Lesko LJ, Mettetal JT, Trame MN. Semi‐mechanistic modelling platform to assess cardiac contractility and haemodynamics in preclinical cardiovascular safety profiling of new molecular entities. Br J Pharmacol. 2020;177:3568–3590. 10.1111/bph.15079
REFERENCES
Safety Pharmacology Studies for Human Pharmaceuticals: ICH.
Verapamil ‐ FDA prescribing information, side effects and uses.
- Adeyemi, O. , Roberts, S. , Harris, J. , West, H. , Shome, S. , & Dewhurst, M. (2009). QA interval as an indirect measure of cardiac contractility in the conscious telemeterised rat: Model optimisation and evaluation. Journal of Pharmacological and Toxicological Methods, 60, 159–166. 10.1016/j.vascn.2009.03.006 [DOI] [PubMed] [Google Scholar]
- Amer, M. S. (1977). Mechanism of action of beta‐blockers in hypertension. Biochemical Pharmacology, 26, 171–175. 10.1016/0006-2952(77)90298-2 [DOI] [PubMed] [Google Scholar]
- Auclair, B. , Wainer, I. W. , Fried, K. , Koch, P. , Jerussi, T. P. , & Ducharme, M. P. (2000). A population analysis of nebulized (R)‐albuterol in dogs using a novel mixed gut‐lung absorption PK‐PD model. Pharmaceutical Research, 17, 1228–1235. 10.1023/a:1026466730347 [DOI] [PubMed] [Google Scholar]
- Bauer, R. J. (2019). NONMEM tutorial part I: Description of commands and options, with simple examples of population analysis. CPT: Pharmacometrics & Systems Pharmacology, 8(8), 525–537. 10.1002/psp4.12404 [DOI] [PMC free article] [PubMed] [Google Scholar]
- Bergenholm, L. , Collins, T. , Evans, N. D. , Chappell, M. J. , & Parkinson, J. (2016). PKPD modelling of PR and QRS intervals in conscious dogs using standard safety pharmacology data. Journal of Pharmacological and Toxicological Methods, 79, 34–44. 10.1016/j.vascn.2016.01.002 [DOI] [PubMed] [Google Scholar]
- Bergstrand, M. , Hooker, A. C. , Wallin, J. E. , & Karlsson, M. O. (2011). Prediction‐corrected visual predictive checks for diagnosing nonlinear mixed‐effects models. The AAPS Journal, 13, 143–151. 10.1208/s12248-011-9255-z [DOI] [PMC free article] [PubMed] [Google Scholar]
- Borow, K. M. , Come, P. C. , Neumann, A. , Baim, D. S. , Braunwald, E. , & Grossman, W. (1985). Physiologic assessment of the inotropic, vasodilator and afterload reducing effects of milrinone in subjects without cardiac disease. The American Journal of Cardiology, 55, 1204–1209. 10.1016/0002-9149(85)90664-2 [DOI] [PubMed] [Google Scholar]
- Brady, A. J. , Poole‐Wilson, P. A. , Harding, S. E. , & Warren, J. B. (1992). Nitric oxide production within cardiac myocytes reduces their contractility in endotoxemia. The American Journal of Physiology, 263, H1963–H1966. 10.1152/ajpheart.1992.263.6.H1963 [DOI] [PubMed] [Google Scholar]
- Buchanan, L. V. , Warner, W. A. , Arthur, S. R. , Gleason, C. R. , Lewen, G. , Levesque, P. C. , & Gill, M. W. (2016). Evaluation of cardiac function in unrestrained dogs and monkeys using left ventricular dP/dt. Journal of Pharmacological and Toxicological Methods, 80, 51–58. 10.1016/j.vascn.2016.03.006 [DOI] [PubMed] [Google Scholar]
- Carlberg, B. , Samuelsson, O. , & Lindholm, L. H. (2004). Atenolol in hypertension: Is it a wise choice? Lancet Lond. Englera, 364, 1684–1689. [DOI] [PubMed] [Google Scholar]
- Cavero, I. , & Holzgrefe, H. (2014). Comprehensive in vitro Proarrhythmia Assay, a novel in vitro/in silico paradigm to detect ventricular proarrhythmic liability: A visionary 21st century initiative. Expert Opinion on Drug Safety, 13, 745–758. 10.1517/14740338.2014.915311 [DOI] [PubMed] [Google Scholar]
- Chou, J. , & Rinehart, J. B. (2018). Computer simulated modeling of healthy and diseased right ventricular and pulmonary circulation. J Clin Monit Comput, 32(6), 1015–1024. 10.1007/s10877-018-0099-2 [DOI] [PubMed] [Google Scholar]
- Colatsky, T. , Fermini, B. , Gintant, G. , Pierson, J. B. , Sager, P. , Sekino, Y. , … Stockbridge, N. (2016). The Comprehensive in vitro Proarrhythmia Assay (CiPA) initiative—Update on progress. Journal of Pharmacological and Toxicological Methods, 81, 15–20. 10.1016/j.vascn.2016.06.002 [DOI] [PubMed] [Google Scholar]
- Cook, D. , Brown, D. , Alexander, R. , March, R. , Morgan, P. , Satterthwaite, G. , & Pangalos, M. N. (2014). Lessons learned from the fate of AstraZeneca's drug pipeline: A five‐dimensional framework. Nature Reviews. Drug Discovery, 13, 419–431. 10.1038/nrd4309 [DOI] [PubMed] [Google Scholar]
- Curtis, M. J. , Ashton, J. C. , Moon, L. D. F. , & Ahluwalia, A. (2018). Clarification of the basis for the selection of requirements for publication in the British Journal of Pharmacology . British Journal of Pharmacology, 175, 3633–3635. 10.1111/bph.14443 [DOI] [PMC free article] [PubMed] [Google Scholar]
- Ueyama, Y. , Rio, C. , & Hamlin, R. (2013). Dofetilide increases load‐independent indices of contractility in closed‐chest anesthetized guinea pigs. Journal of Pharmacological and Toxicological Methods, 68, e17. [Google Scholar]
- Edelson, J. , Koss, R. F. , Baker, J. F. , & Park, G. B. (1983). High‐performance liquid chromatographic analysis of milrinone in plasma and urine: Intravenous pharmacokinetics in the dog. Journal of Chromatography, 276, 456–462. 10.1016/s0378-4347(00)85117-8 [DOI] [PubMed] [Google Scholar]
- Feneley, M. (2013). Contractility: Still searching after all these years. JACC: Cardiovascular Imaging, 6, 429–431. 10.1016/j.jcmg.2012.12.009 [DOI] [PubMed] [Google Scholar]
- Francheteau, P. , Steimer, J. L. , Merdjan, H. , Guerret, M. , & Dubray, C. (1993). A mathematical model for dynamics of cardiovascular drug action: Application to intravenous dihydropyridines in healthy volunteers. Journal of Pharmacokinetics and Biopharmaceutics, 21, 489–514. 10.1007/bf01059111 [DOI] [PubMed] [Google Scholar]
- Gotta, V. , Cools, F. , Van Ammel, K. , Gallacher, D. J. , Visser, S. A. , Sannajust, F. , … van der Graaf, P. H. (2015). Inter‐study variability of preclinical in vivo safety studies and translational exposure‐QTc relationships—A PKPD meta‐analysis. British Journal of Pharmacology, 172, 4364–4379. 10.1111/bph.13218 [DOI] [PMC free article] [PubMed] [Google Scholar]
- Guth, B. D. , Chiang, A. Y. , Doyle, J. , Engwall, M. J. , Guillon, J.‐M. , Hoffmann, P. , … Sarazan, R. D. (2015). The evaluation of drug‐induced changes in cardiac inotropy in dogs: Results from a HESI‐sponsored consortium. Journal of Pharmacological and Toxicological Methods, 75, 70–90. 10.1016/j.vascn.2015.02.002 [DOI] [PubMed] [Google Scholar]
- Hamlin, R. L. , & del Rio, C. (2010). An approach to the assessment of drug‐induced changes in non‐electrophysiological properties of cardiovascular function. Journal of Pharmacological and Toxicological Methods, 62, 20–29. 10.1016/j.vascn.2010.05.010 [DOI] [PubMed] [Google Scholar]
- Hamlin, R. L. , & del Rio, C. (2012). dP/dt max—A measure of ‘baroinometry’. Journal of Pharmacological and Toxicological Methods, 66, 63–65. 10.1016/j.vascn.2012.01.001 [DOI] [PubMed] [Google Scholar]
- Heel, R. C. , Brogden, R. N. , Speight, T. M. , & Avery, G. S. (1979). Atenolol: A review of its pharmacological properties and therapeutic efficacy in angina pectoris and hypertension. Drugs, 17, 425–460. 10.2165/00003495-197917060-00001 [DOI] [PubMed] [Google Scholar]
- Hoffmeister, H. M. , Hepp, A. , & Seipel, L. (1987). Negative inotropic effect of class‐I‐antiarrhythmic drugs: Comparison of flecainide with disopyramide and quinidine. European Heart Journal, 8, 1126–1132. 10.1093/oxfordjournals.eurheartj.a062178 [DOI] [PubMed] [Google Scholar]
- Howgate, E. , & Aarons, L. (2013). Cross‐species scaling of cardiovascular safety pharmacology using PKPD modelling and simulation. University of Manchester: https://www.research.manchester.ac.uk/portal/files/54537077/FULL_TEXT.PDF [Google Scholar]
- Kamendi, H. , Barthlow, H. , Lengel, D. , Beaudoin, M.‐E. , Snow, D. , Mettetal, J. T. , & Bialecki, R. A. (2016). Quantitative pharmacokinetic‐pharmacodynamic modelling of baclofen‐mediated cardiovascular effects using BP and heart rate in rats. British Journal of Pharmacology, 173, 2845–2858. 10.1111/bph.13561 [DOI] [PMC free article] [PubMed] [Google Scholar]
- Kilkenny, C. , Browne, W. , Cuthill, I. C. , Emerson, M. , & Altman, D. G. (2010a). Animal research: Reporting in vivo experiments: the ARRIVE guidelines. British Journal of Pharmacology, 160, 1577–1579. [DOI] [PMC free article] [PubMed] [Google Scholar]
- Kilkenny, C. , Browne, W. J. , Cuthill, I. C. , Emerson, M. , & Altman, D. G. (2010b). Improving bioscience research reporting: The ARRIVE guidelines for reporting animal research. PLoS Biology, 8, e1000412 10.1371/journal.pbio.1000412 [DOI] [PMC free article] [PubMed] [Google Scholar]
- Kola, I. , & Landis, J. (2004). Can the pharmaceutical industry reduce attrition rates? Nature Reviews. Drug Discovery, 3, 711–715. 10.1038/nrd1470 [DOI] [PubMed] [Google Scholar]
- Konhilas, J. P. , Irving, T. C. , & de Tombe, P. P. (2002). Frank‐Starling law of the heart and the cellular mechanisms of length‐dependent activation. Pflügers Archiv, 445, 305–310. 10.1007/s00424-002-0902-1 [DOI] [PubMed] [Google Scholar]
- Markert, M. , Klumpp, A. , Trautmann, T. , Mayer, K. , Stubhan, M. , & Guth, B. (2007). The value added by measuring myocardial contractility ‘in vivo’ in safety pharmacological profiling of drug candidates. Journal of Pharmacological and Toxicological Methods, 56, 203–211. 10.1016/j.vascn.2007.03.004 [DOI] [PubMed] [Google Scholar]
- McAinsh, J. , & Holmes, B. F. (1983). Pharmacokinetic studies with atenolol in the dog. Biopharmaceutics & Drug Disposition, 4, 249–261. 10.1002/bdd.2510040306 [DOI] [PubMed] [Google Scholar]
- McGrath, J. C. , & Lilley, E. (2015). Implementing guidelines on reporting research using animals (ARRIVE etc.): New requirements for publication in BJP. British Journal of Pharmacology, 172, 3189–3193. 10.1111/bph.12955 [DOI] [PMC free article] [PubMed] [Google Scholar]
- Munos, B. (2009). Lessons from 60 years of pharmaceutical innovation. Nature Reviews. Drug Discovery, 8, 959–968. 10.1038/nrd2961 [DOI] [PubMed] [Google Scholar]
- Ollerstam, A. , Persson, A. H. , Visser, S. A. G. , Fredriksson, J. M. , Forsberg, T. , Nilsson, L. B. , … al‐Saffar, A. (2007). A novel approach to data processing of the QT interval response in the conscious telemetered beagle dog. Journal of Pharmacological and Toxicological Methods, 55, 35–48. 10.1016/j.vascn.2006.02.009 [DOI] [PubMed] [Google Scholar]
- Olson, H. , Betton, G. , Robinson, D. , Thomas, K. , Monro, A. , Kolaja, G. , … Heller, A. (2000). Concordance of the toxicity of pharmaceuticals in humans and in animals. Regulatory Toxicology and Pharmacology, 32, 56–67. 10.1006/rtph.2000.1399 [DOI] [PubMed] [Google Scholar]
- Parkinson, J. , Visser, S. A. G. , Jarvis, P. , Pollard, C. , Valentin, J.‐P. , Yates, J. W. T. , & Ewart, L. (2013). Translational pharmacokinetic‐pharmacodynamic modeling of QTc effects in dog and human. Journal of Pharmacological and Toxicological Methods, 68, 357–366. 10.1016/j.vascn.2013.03.007 [DOI] [PubMed] [Google Scholar]
- Pérez, J. E. , Borda, L. , Schuchleib, R. , & Henry, P. D. (1982). Inotropic and chronotropic effects of vasodilators. The Journal of Pharmacology and Experimental Therapeutics, 221, 609–613. [PubMed] [Google Scholar]
- Pfeiffer, S. , Leopold, E. , Schmidt, K. , Brunner, F. , & Mayer, B. (1996). Inhibition of nitric oxide synthesis by NG‐nitro‐L‐arginine methyl ester (L‐NAME): Requirement for bioactivation to the free acid, NG‐nitro‐L‐arginine. British Journal of Pharmacology, 118, 1433–1440. 10.1111/j.1476-5381.1996.tb15557.x [DOI] [PMC free article] [PubMed] [Google Scholar]
- Prior, H. , McMahon, N. , Schofield, J. , & Valentin, J.‐P. (2009). Non‐invasive telemetric electrocardiogram assessment in conscious beagle dogs. Journal of Pharmacological and Toxicological Methods, 60, 167–173. 10.1016/j.vascn.2009.06.001 [DOI] [PubMed] [Google Scholar]
- Pugsley, M. K. , & Curtis, M. J. (2012). Methodological innovations expand the safety pharmacology horizon. Journal of Pharmacological and Toxicological Methods, 66, 59–62. 10.1016/j.vascn.2012.05.004 [DOI] [PubMed] [Google Scholar]
- Redfern, W. S. , Carlsson, L. , Davis, A. S. , Lynch, W. G. , MacKenzie, I. , Palethorpe, S. , … Hammond, T. G. (2003). Relationships between preclinical cardiac electrophysiology, clinical QT interval prolongation and torsade de pointes for a broad range of drugs: Evidence for a provisional safety margin in drug development. Cardiovascular Research, 58, 32–45. 10.1016/s0008-6363(02)00846-5 [DOI] [PubMed] [Google Scholar]
- Sarazan, R. D. , Mittelstadt, S. , Guth, B. , Koerner, J. , Zhang, J. , & Pettit, S. (2011). Cardiovascular function in nonclinical drug safety assessment: Current issues and opportunities. International Journal of Toxicology, 30, 272–286. 10.1177/1091581811398963 [DOI] [PubMed] [Google Scholar]
- Scott, C. W. , Zhang, X. , Abi‐Gerges, N. , Lamore, S. D. , Abassi, Y. A. , & Peters, M. F. (2014). An impedance‐based cellular assay using human iPSC‐derived cardiomyocytes to quantify modulators of cardiac contractility. Toxicological Sciences, 142, 331–338. 10.1093/toxsci/kfu186 [DOI] [PubMed] [Google Scholar]
- Skinner, M. , Lainee, P. , Valentin, J.‐P. , & Moors, J. (2012). Assessment of left ventricular dP/dtmax in telemetry studies: Essential or excessive? Journal of Pharmacological and Toxicological Methods, 66, 175 10.1016/j.vascn.2012.08.057 [DOI] [Google Scholar]
- Snelder, N. , Ploeger, B. A. , Luttringer, O. , Rigel, D. F. , Fu, F. , Beil, M. , … Danhof, M. (2014). Drug effects on the CVS in conscious rats: Separating cardiac output into heart rate and stroke volume using PKPD modelling. British Journal of Pharmacology, 171, 5076–5092. 10.1111/bph.12824 [DOI] [PMC free article] [PubMed] [Google Scholar]
- Snelder, N. , Ploeger, B. A. , Luttringer, O. , Rigel, D. F. , Webb, R. L. , Feldman, D. , … Danhof, M. (2013). PKPD modelling of the interrelationship between mean arterial BP, cardiac output and total peripheral resistance in conscious rats. British Journal of Pharmacology, 169, 1510–1524. 10.1111/bph.12190 [DOI] [PMC free article] [PubMed] [Google Scholar]
- Upton, R. N. , & Ludbrook, G. L. (2005). Pharmacokinetic‐pharmacodynamic modelling of the cardiovascular effects of drugs—Method development and application to magnesium in sheep. BMC Pharmacology, 5, 5 10.1186/1471-2210-5-5 [DOI] [PMC free article] [PubMed] [Google Scholar]
- Wallis, R. , Gharanei, M. , & Maddock, H. (2015). Predictivity of in vitro non‐clinical cardiac contractility assays for inotropic effects in humans—A literature search. Journal of Pharmacological and Toxicological Methods, 75, 62–69. 10.1016/j.vascn.2015.05.009 [DOI] [PubMed] [Google Scholar]
- Zhang, X.‐P. , Wu, B.‐W. , Yang, C.‐H. , Wang, J. , Niu, S.‐C. , & Zhang, M.‐S. (2009). Dofetilide enhances the contractility of rat ventricular myocytes via augmentation of Na+‐Ca 2+ exchange. Cardiovascular Drugs and Therapy, 23, 207–214. 10.1007/s10557-009-6163-x [DOI] [PubMed] [Google Scholar]
- Zhang, X.‐Y. , Trame, M. , Lesko, L. , & Schmidt, S. (2015). Sobol sensitivity analysis: A tool to guide the development and evaluation of systems pharmacology models. CPT: Pharmacometrics & Systems Pharmacology, 4, 69–79. 10.1002/psp4.6 [DOI] [PMC free article] [PubMed] [Google Scholar]
- Zimpfer, M. , & Vatner, S. F. (1981). Effects of acute increases in left ventricular preload on indices of myocardial function in conscious, unrestrained and intact, tranquilized baboons. The Journal of Clinical Investigation, 67, 430–438. 10.1172/JCI110051 [DOI] [PMC free article] [PubMed] [Google Scholar]
Associated Data
This section collects any data citations, data availability statements, or supplementary materials included in this article.
Supplementary Materials
Data S1: Supporting Information