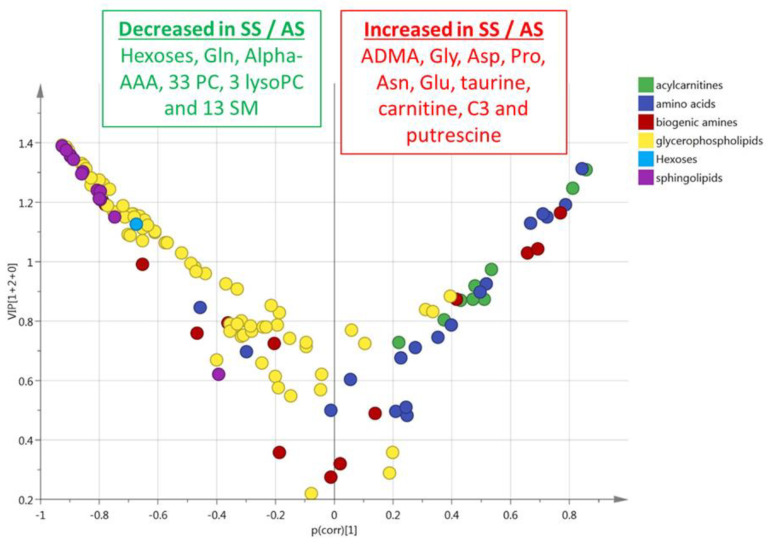
Figure 4.
(RBC). Volcano plot (pcorr vs. VIP) from the OPLS-DA model shown in Figure 3B (red blood cells from HbSS vs. HbAS). Only the most discriminating metabolites with high VIP values ≥ 1 are listed in the boxes. Negative pcorr values (left) indicate diminished metabolite concentrations in HbSS versus HbAS genotypes, whereas positive pcorr values (right) indicate increased metabolite concentrations in HbSS versus HbAS genotypes.

