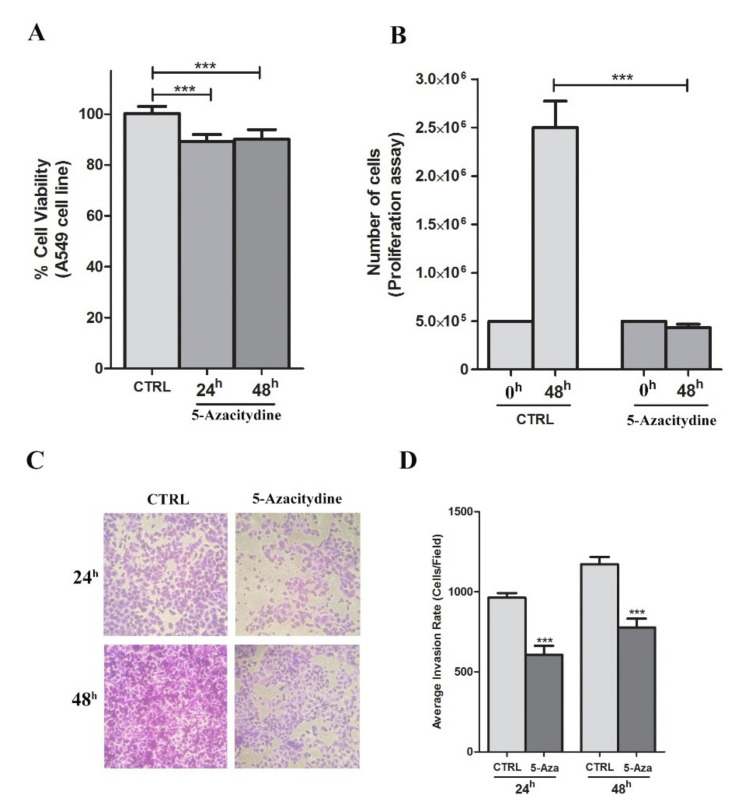
Figure 6.
The effects of 5-Aza-Cdr treatment on viability, proliferation and migration of A549 cell line. (A) Results from the viability assay performed using PrestoBlue assay after 5-Aza-Cdr treatment. Data are expressed as mean ± SEM vs. ctrl. (B) Results from the proliferation assay after 5-Aza-Cdr treatment. Data are expressed as mean ± SEM (n = 4). *** p < 0.001 vs. untreated samples (t-test). (C) Photographs of representative fields of stained cells that migrated through the membrane during the invasion assay after 24 and 48 h of incubation. (D) Columns represent the average of the number of cells per field of at least ten fields in three independent experiments of invasion assay. Data are expressed as mean ± SEM. *** p < 0.001 vs. untreated samples (t-test).

