

Abstract
Objectives. To examine abortion utilization in Ohio from 2010 to 2018, a period when more than 15 abortion-related laws became effective.
Methods. We evaluated changes in abortion rates and ratios examining gestation, geographic distribution, and abortion method in Ohio from 2010 to 2018. We used data from Ohio’s Office of Vital Statistics, the Centers for Disease Control and Prevention’s Abortion Surveillance Reports, the American Community Survey, and Ohio’s Public Health Data Warehouse.
Results. During 2010 through 2018, abortion rates declined similarly in Ohio, the Midwest, and the United States. In Ohio, the proportion of early first trimester abortions decreased; the proportion of abortions increased in nearly every later gestation category. Abortion ratios decreased sharply in most rural counties. When clinics closed, abortion ratios dropped in nearby counties.
Conclusions. More Ohioans had abortions later in the first trimester, compared with national patterns, suggesting delays to care. Steeper decreases in abortion ratios in rural versus urban counties suggest geographic inequity in abortion access.
Public Health Implications. Policies restricting abortion access in Ohio co-occur with delays to care and increasing geographic inequities. Restrictive policies do not improve reproductive health.
Abortion care in many US states has become increasingly regulated. For example, since 2010, there have been more than 15 legislative changes related to abortion in Ohio. (Selected laws likely to affect abortion access, labeled with the year they became effective, are shown in Figure 1.) Legislative changes in Ohio are wide-ranging and include both patient-level and provider-level regulations. Patient-level regulations include rules that ban abortion after 20 weeks gestation, directives about how abortion can be funded (state and Affordable Care Act marketplace insurance plans ban abortion coverage), and judicial bypass requirements for minors. A mandatory 24-hour waiting period between provision of consent and the abortion has been in place since 1998. Provider-level regulations include bans on performing nontherapeutic abortions in public facilities (where “therapeutic” is defined as an abortion performed because the woman’s life is endangered and “public facilities” include all facilities that receive any funding from the state, including the state’s large university-affiliated medical systems), requirements for viability testing, and requirements that clinics have transfer agreements with nonpublic hospitals within 30 miles of the abortion clinic. Another Ohio law that directly affects abortion provision, which went into effect in 2011, requires physicians to provide medication abortion according to an on-label protocol, as approved by the Food and Drug Administration (FDA). In 2011, the on-label protocol limited medication abortion to maximal gestation of 7 weeks and required 4 visits. By contrast, most states are silent on this matter and permit the evidence-based (off-label) protocol to be followed that indicates use of medication abortion up to 10 weeks of gestation and administered in 1 visit. In 2016, the FDA protocol for medication abortion was updated to match the evidence-based protocol. In combination, these regulations affect the patient experience by making it more difficult to access timely care, more challenging to pay for abortion, and more logistically complicated by increasing the number of required clinic visits.
FIGURE 1—
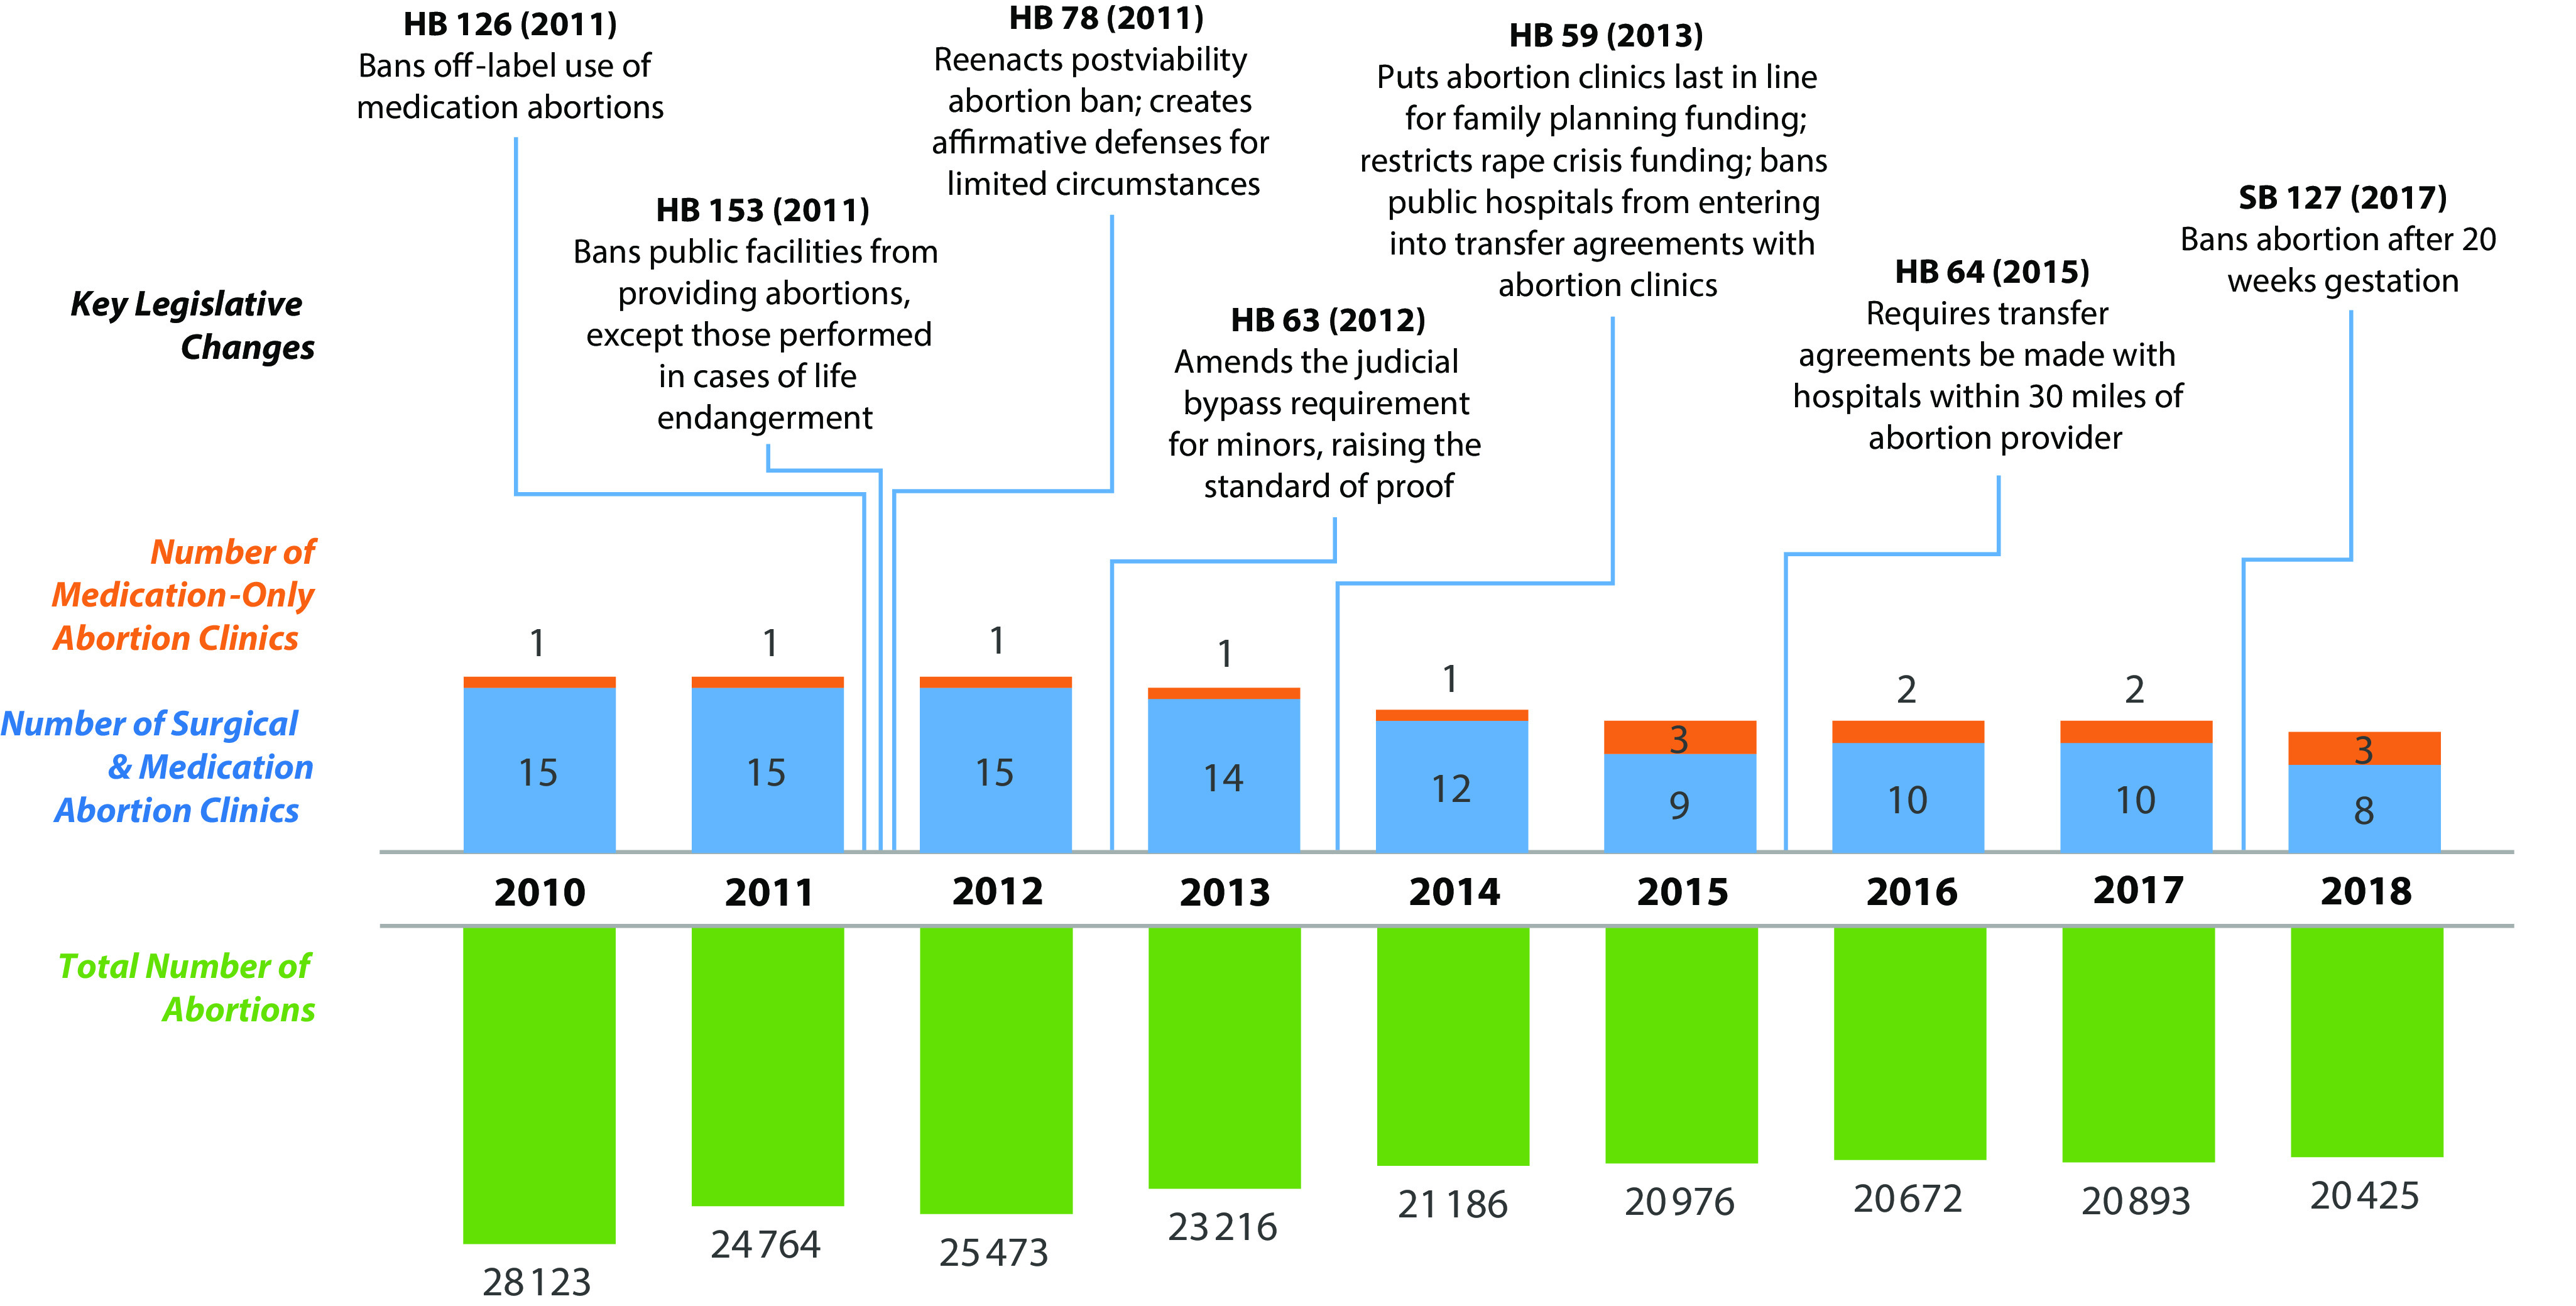
Select Legislative and Clinic Changes and Number of Abortions per Year: Ohio, 2010–2018
Note. HB = House Bill; SB = Senate Bill. Dates are the years in which laws became effective. Total numbers of abortions in Ohio were obtained from the Ohio Department of Health’s “Induced Abortions in Ohio” report and include all abortions that took place in Ohio. The number of abortion clinics is the count as of June 1 of the given year. Abortion clinics were categorized on the basis of the type of abortions (surgical or medication only) they provided for most of that year. Several of more than 15 legislative changes from 2010 to 2018 are represented.
Many of these regulations affect facilities’ ability to offer abortion care by making it more difficult for clinics and providers to operate in Ohio. Between 2010 and 2018, Ohio saw 5 of 16 abortion clinics close; others have given up their surgical license, or have been engaged in litigation and have been at risk for closure. These changes may have made it more difficult for some people to obtain abortions. Although the scope of analysis in this report ends in 2018, new legislation aimed to restrict abortion continues to move its way through the legislative process and court system. In this article, we describe trends in abortion in Ohio over the period 2010 to 2018 as these legislative and regulatory changes were taking place.
Ohio serves as an excellent case study to examine the impact of state reproductive health care–related laws and policies on abortion utilization. The legislative context in Ohio is similar to that of many other US states in which legislatures are passing restrictive abortion laws, and Ohioans are considered to be representative of the larger US population.1 Ohio is the seventh most populous state in the United States, with both a racially diverse population and a diversity of economic infrastructures and community identities. The Ohio experience thus serves as an illustration of the broader landscape of abortion access in the United States and provides insights into areas of analysis that other scholars could similarly use to investigate changes in their own state.
Currently, there is limited empirical evidence about the impacts of abortion legislation on people seeking abortion in Ohio. In this study, we sought to understand changes in abortion utilization in Ohio from 2010 to 2018 in the context of laws and policies that may have influenced abortion access and outcomes, with particular attention to changes over time in the number of abortions, gestation at which abortion takes place, method of abortion (surgical vs medication), and the regional distribution of abortions within Ohio. To understand trends in Ohio, we made comparisons with the Midwestern region and United States as a whole. To assess changes in abortion use following law and policy changes, we examined compiled findings from Ohio’s Confidential Abortion Reports.
METHODS
We analyzed data from several publicly available sources to evaluate changes in abortion use over time as well as distribution of abortion by gestation, procedure type, and region.
Sources of Data
All data used in this analysis are publicly available aggregate-level data.
Confidential abortion reports.
The Ohio Confidential Abortion Report forms are state-mandated reports filled out by physicians for every abortion that takes place in Ohio. Put together, they represent a complete census of all induced abortions in Ohio over an extended period of time. The forms collect information such as race, education, age, and county of residence of the person who had the abortion; gestation; method of abortion; county where the abortion was performed; and complications. The Ohio Department of Health produces a public report, “Induced Abortions in Ohio,” summarizing each year’s compiled data. Our analysis was derived from a data set we constructed based on the aggregate information present in these publicly available reports.
For this study, we extracted data from published “Induced Abortions in Ohio” reports from 2010 to 2018 to assess the number of abortions in Ohio by county of residence and method of abortion (surgical vs medication). Surgical methods include curettage, dilation and extraction, dilation and evacuation, hysterotomy, and hysterectomy. Medication methods include mifepristone, methotrexate, and misoprostol.
According to the “Induced Abortions in Ohio” reports, approximately 5% to 6% of abortions annually were for people who were not residents of Ohio. For the most part, our rates and proportions pertain to all abortions in Ohio; we limited the county-level analyses to abortions obtained in Ohio by Ohio residents. There was no strong or consistent trend in the proportion of Ohio abortions to out-of-state residents over the period of study. Thus, although it is possible that out-of-state residents contributed to the trends we report in this article, it is unlikely that abortions provided to nonresidents were a primary driver of trends. Some Ohio residents obtained abortions outside of Ohio during the period of study; these abortions were not recorded in the “Induced Abortions in Ohio” reports data.
Centers for Disease Control and Prevention Abortion Surveillance Reports.
The Centers for Disease Control and Prevention (CDC) publishes annual Abortion Surveillance Reports, which are compiled from various states and 2 additional reporting areas (New York City and the District of Columbia). We obtained the number of abortions per region from the 2010–2016 CDC Abortion Surveillance Reports (2016 is the latest year for which the CDC reports are available).2–8 We also obtained the number of abortions by gestation from 2010 to 2016 from these CDC reports. For those years, a total of 37, 39, 38, 40, 40, 40, and 41 states, respectively, reported gestation at the time of abortion. The CDC Abortion Surveillance Reports classify the number of abortions in each of the following categories of gestation: less than 9 weeks, 9 to 13 weeks, 14 to 15 weeks, 16 to 17 weeks, 18 to 20 weeks, and 21 weeks or more. States and reporting areas were included in the CDC report if they reported gestation and met the CDC’s reporting standards for gestation.
Other data sources.
To calculate abortion rates, we obtained state-level numbers of women 15 to 49 years old from US Census Bureau data based on the American Community Survey from 2010 to 2016. The number of surgical abortion clinics was confirmed by Ohio Department of Health reporting of ambulatory surgical clinic licenses issued to abortion clinics.
We obtained the number of live births per county per year from the Ohio Department of Health’s public health information warehouse.9 This data set contains counts of births among Ohio residents from 2006 to the present and is updated on a weekly basis. Live birth resident records are compiled from birth certificates filed with the Ohio Department of Health through the Integrated Perinatal Health Information System application.
Data Analysis
Abortion rate in Ohio, Midwest, and the United States.
We estimated the abortion rate for each year by dividing the number of abortions in the region of interest (Ohio, Midwest, or United States) by the number of women of reproductive age (15–49 years old) per region. The “Midwestern states” category is made up of data from Illinois, Indiana, Iowa, Kansas, Michigan, Minnesota, Missouri, Nebraska, North Dakota, Ohio, South Dakota, and Wisconsin. We grouped estimates by data from Ohio, Midwest, and the United States. For the US total, we included only the areas that had mandatory reporting for all abortions. We did not include in the analysis data from the District of Columbia and New Jersey from 2010 to 2016, or data from Maine from 2012, because the counts presented did not include all abortions in the reporting area. Because California, Maryland, and New Hampshire did not report abortions to the CDC, we excluded them from the analysis.
Distribution of abortion by gestation in Ohio and the United States.
We calculated the proportion of abortions in each gestation category by dividing the number of abortions in each category by the total number of abortions, using data from the CDC Abortion Surveillance Reports.
Abortion ratio by county over time.
The abortion ratio is the number of abortions per 1000 live births per year. We calculated county-level abortion ratios using counts of abortions by county of residence from the “Induced Abortions in Ohio” reports and counts of live births as described in the “Sources of Data” subsection, dividing the number of abortions by the number of live births and standardizing the ratio to 1000 live births. We mapped county-level abortion ratios using ArcGIS (Esri, Redlands, CA) and county-level Federal Information Processing Standards (FIPS) codes. The number of clinics open in a given year is determined as of June 1 of that year. We examined the change in abortion ratios over time between rural and urban counties. Using 2010 US Census criteria, we designated counties with 50% or more of their population living in rural areas as rural and counties with less than 50% of their population living in rural areas as urban. In Figure A (available as a supplement to the online version of this article at http://www.ajph.org), for each map starting in 2011, we quantified the change in the abortion ratio from the previous year. We were interested in sizable changes from year to year, rather than small fluctuations, so we note changes of 25% or more.
RESULTS
Overall, the abortion rate in Ohio has declined over time, similar to national trends. However, pregnant Ohioans had procedures at relatively later gestation, and those living in rural areas had lower use of abortion compared with those living in urban areas, a disparity that increased with time alongside the closure of clinics. Additionally, the effects of policy regulation of medication abortion during the study period was reflected in a gap in use of medication abortion services.
Abortion Rate in Ohio, Midwest, and the United States
The abortion rate (abortions per woman of reproductive age) declined nationally during the period 2010 to 2016, as depicted for the US states that had mandatory reporting (Figure 2). Rates declined over a relatively short period of time.
FIGURE 2—

Abortion Rate in Ohio, Midwestern States, and US Mandatory Reporting Areas: 2010–2016
Note. Midwestern states include Illinois, Indiana, Iowa, Kansas, Michigan, Minnesota, Missouri, Nebraska, North Dakota, Ohio, South Dakota, and Wisconsin. Numbers of abortions were obtained from the Centers for Disease Control and Prevention’s Abortion Surveillance Reports and include all abortions that occurred in Ohio, the Midwest, and the United States. Numbers of women aged 15 to 49 years were obtained from US Census Bureau data, based on the American Community Survey.
Ohio had slightly lower rates of abortion than the United States overall, and the rates declined in a roughly similar trend. Comparing Ohio with the Midwest as a whole, we found that Ohio’s overall lower abortion rate was largely mirrored in the other Midwestern states, the majority of which had similarly restrictive abortion policies.10 We noted a slight increase in 2012 in the Midwest, including Ohio.
Abortion Proportion by Gestation in Ohio and the United States
Figure 3 presents an examination of the changes in gestation at which abortions were performed. The majority of abortions were in the first trimester of pregnancy, both in Ohio and in the rest of the country. Few abortions (approximately 10%) took place after 14 weeks gestation.
FIGURE 3—
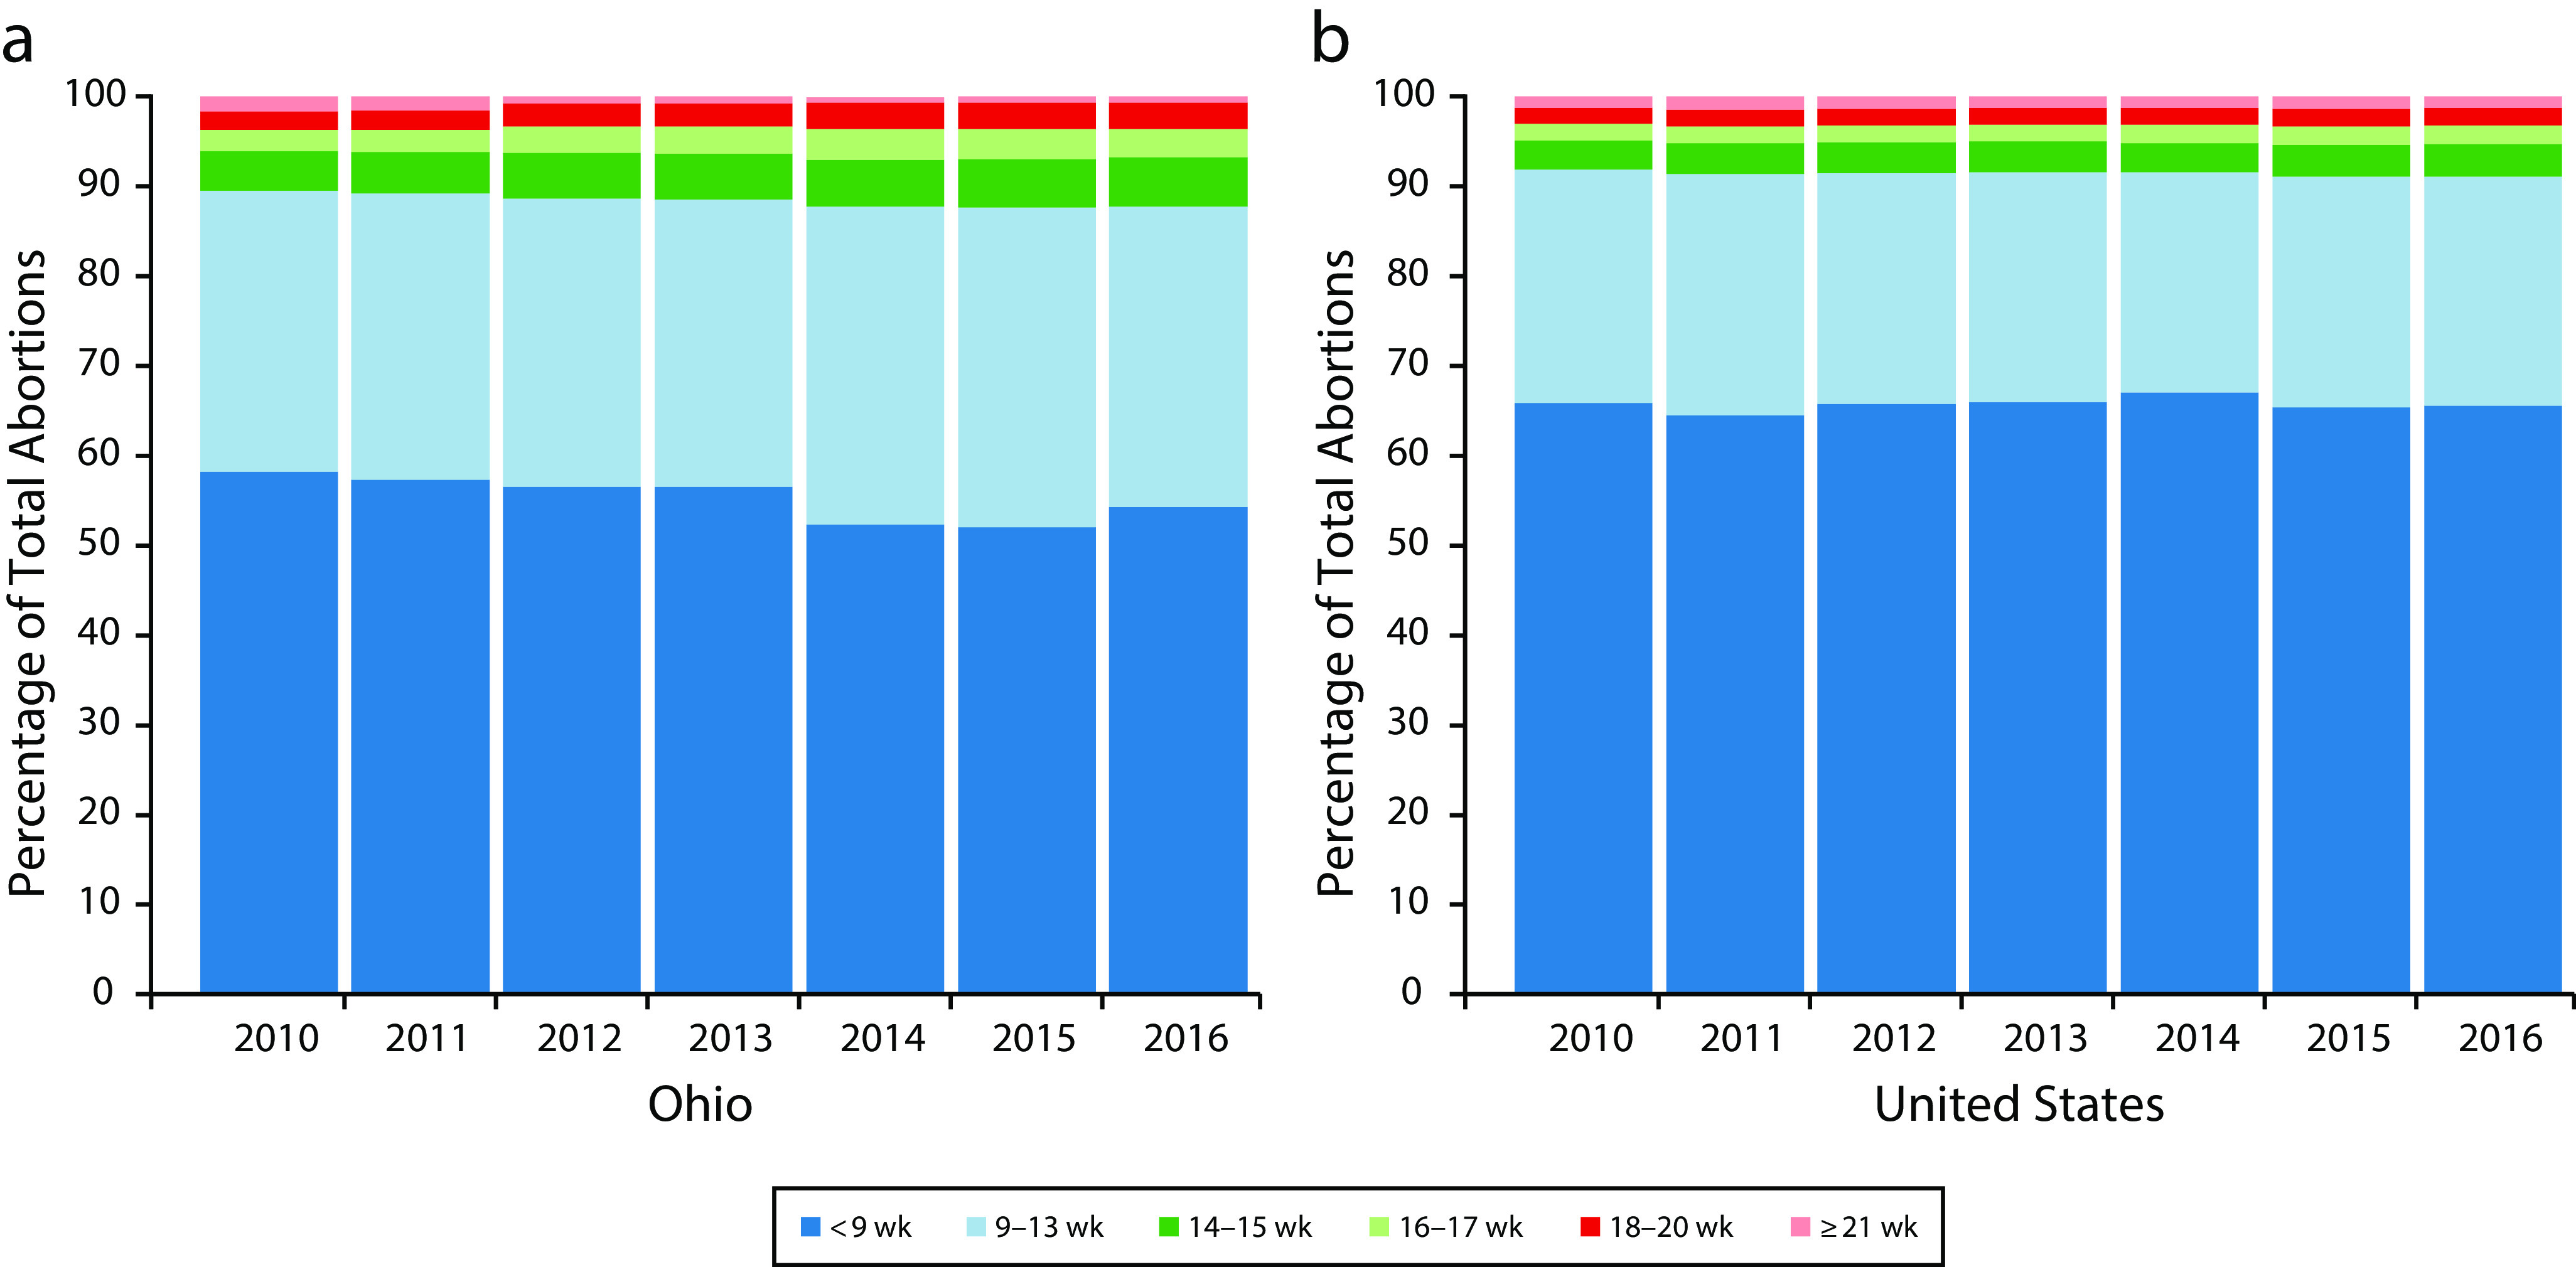
Distribution of Abortions by Gestation Categories in (a) Ohio and (b) the United States: 2010–2016
Note. Data are from the Centers for Disease Control and Prevention’s Abortion Surveillance Reports and include all abortions that occurred in Ohio and the United States.
Although the distribution changed little over time in the United States as a whole, Ohio had a relatively greater proportion of abortions in every gestation category above 9 weeks, except 21 or more weeks, compared with the United States, and that difference increased over time. Considering first trimester abortions, Ohio residents had a notably smaller proportion in the “less than 9 weeks” category and a larger proportion in the “9 to 13 weeks” category, compared with the United States as a whole.
Method of Abortion (Surgical and Medication) in Ohio
We next examined the impact of the regulation requiring physicians to provide medication abortion according to the less-effective, on-label FDA protocol, enforced starting in 2011. For the duration of the restricted protocol, medication abortion rates decreased to approximately 5%, about one quarter of what they were in 2010 (online Figure B). In 2016, the FDA protocol for medication abortion was updated to match the evidence-based protocol. By 2017, rates of medication abortion surpassed the pre-2011 levels and continued to rise in 2018.
Abortion Ratio by County Over Time
The ratio of abortions to births has had a heterogeneous change across Ohio, which can be visualized by a comparison of data from 2010 and 2018 (Figure 4). Most counties in Ohio did not have an abortion clinic. Abortion ratios—which represent the proportion of abortions to live births, and are thus not a consequence of differences in population density—were generally highest in the state’s urban areas (Toledo, Cleveland, Akron, Columbus, Dayton, Cincinnati) and much lower in the state’s rural areas. Quantifying this change over time, between 2010 and 2018, there was an overall 25.0% decline in the abortion ratio in Ohio (Figure 4). In the state’s urban counties, there was a 24.4% decline in the abortion ratio between 2010 and 2018, a number very close to the overall state decline. Across all rural counties, the decline in the abortion ratio from 2010 to 2018 was 32.4%, a much larger drop than in urban areas. The lack of abortion clinics, and the decrease in abortion ratio, was most striking in the Appalachian region in southeastern Ohio.
FIGURE 4—
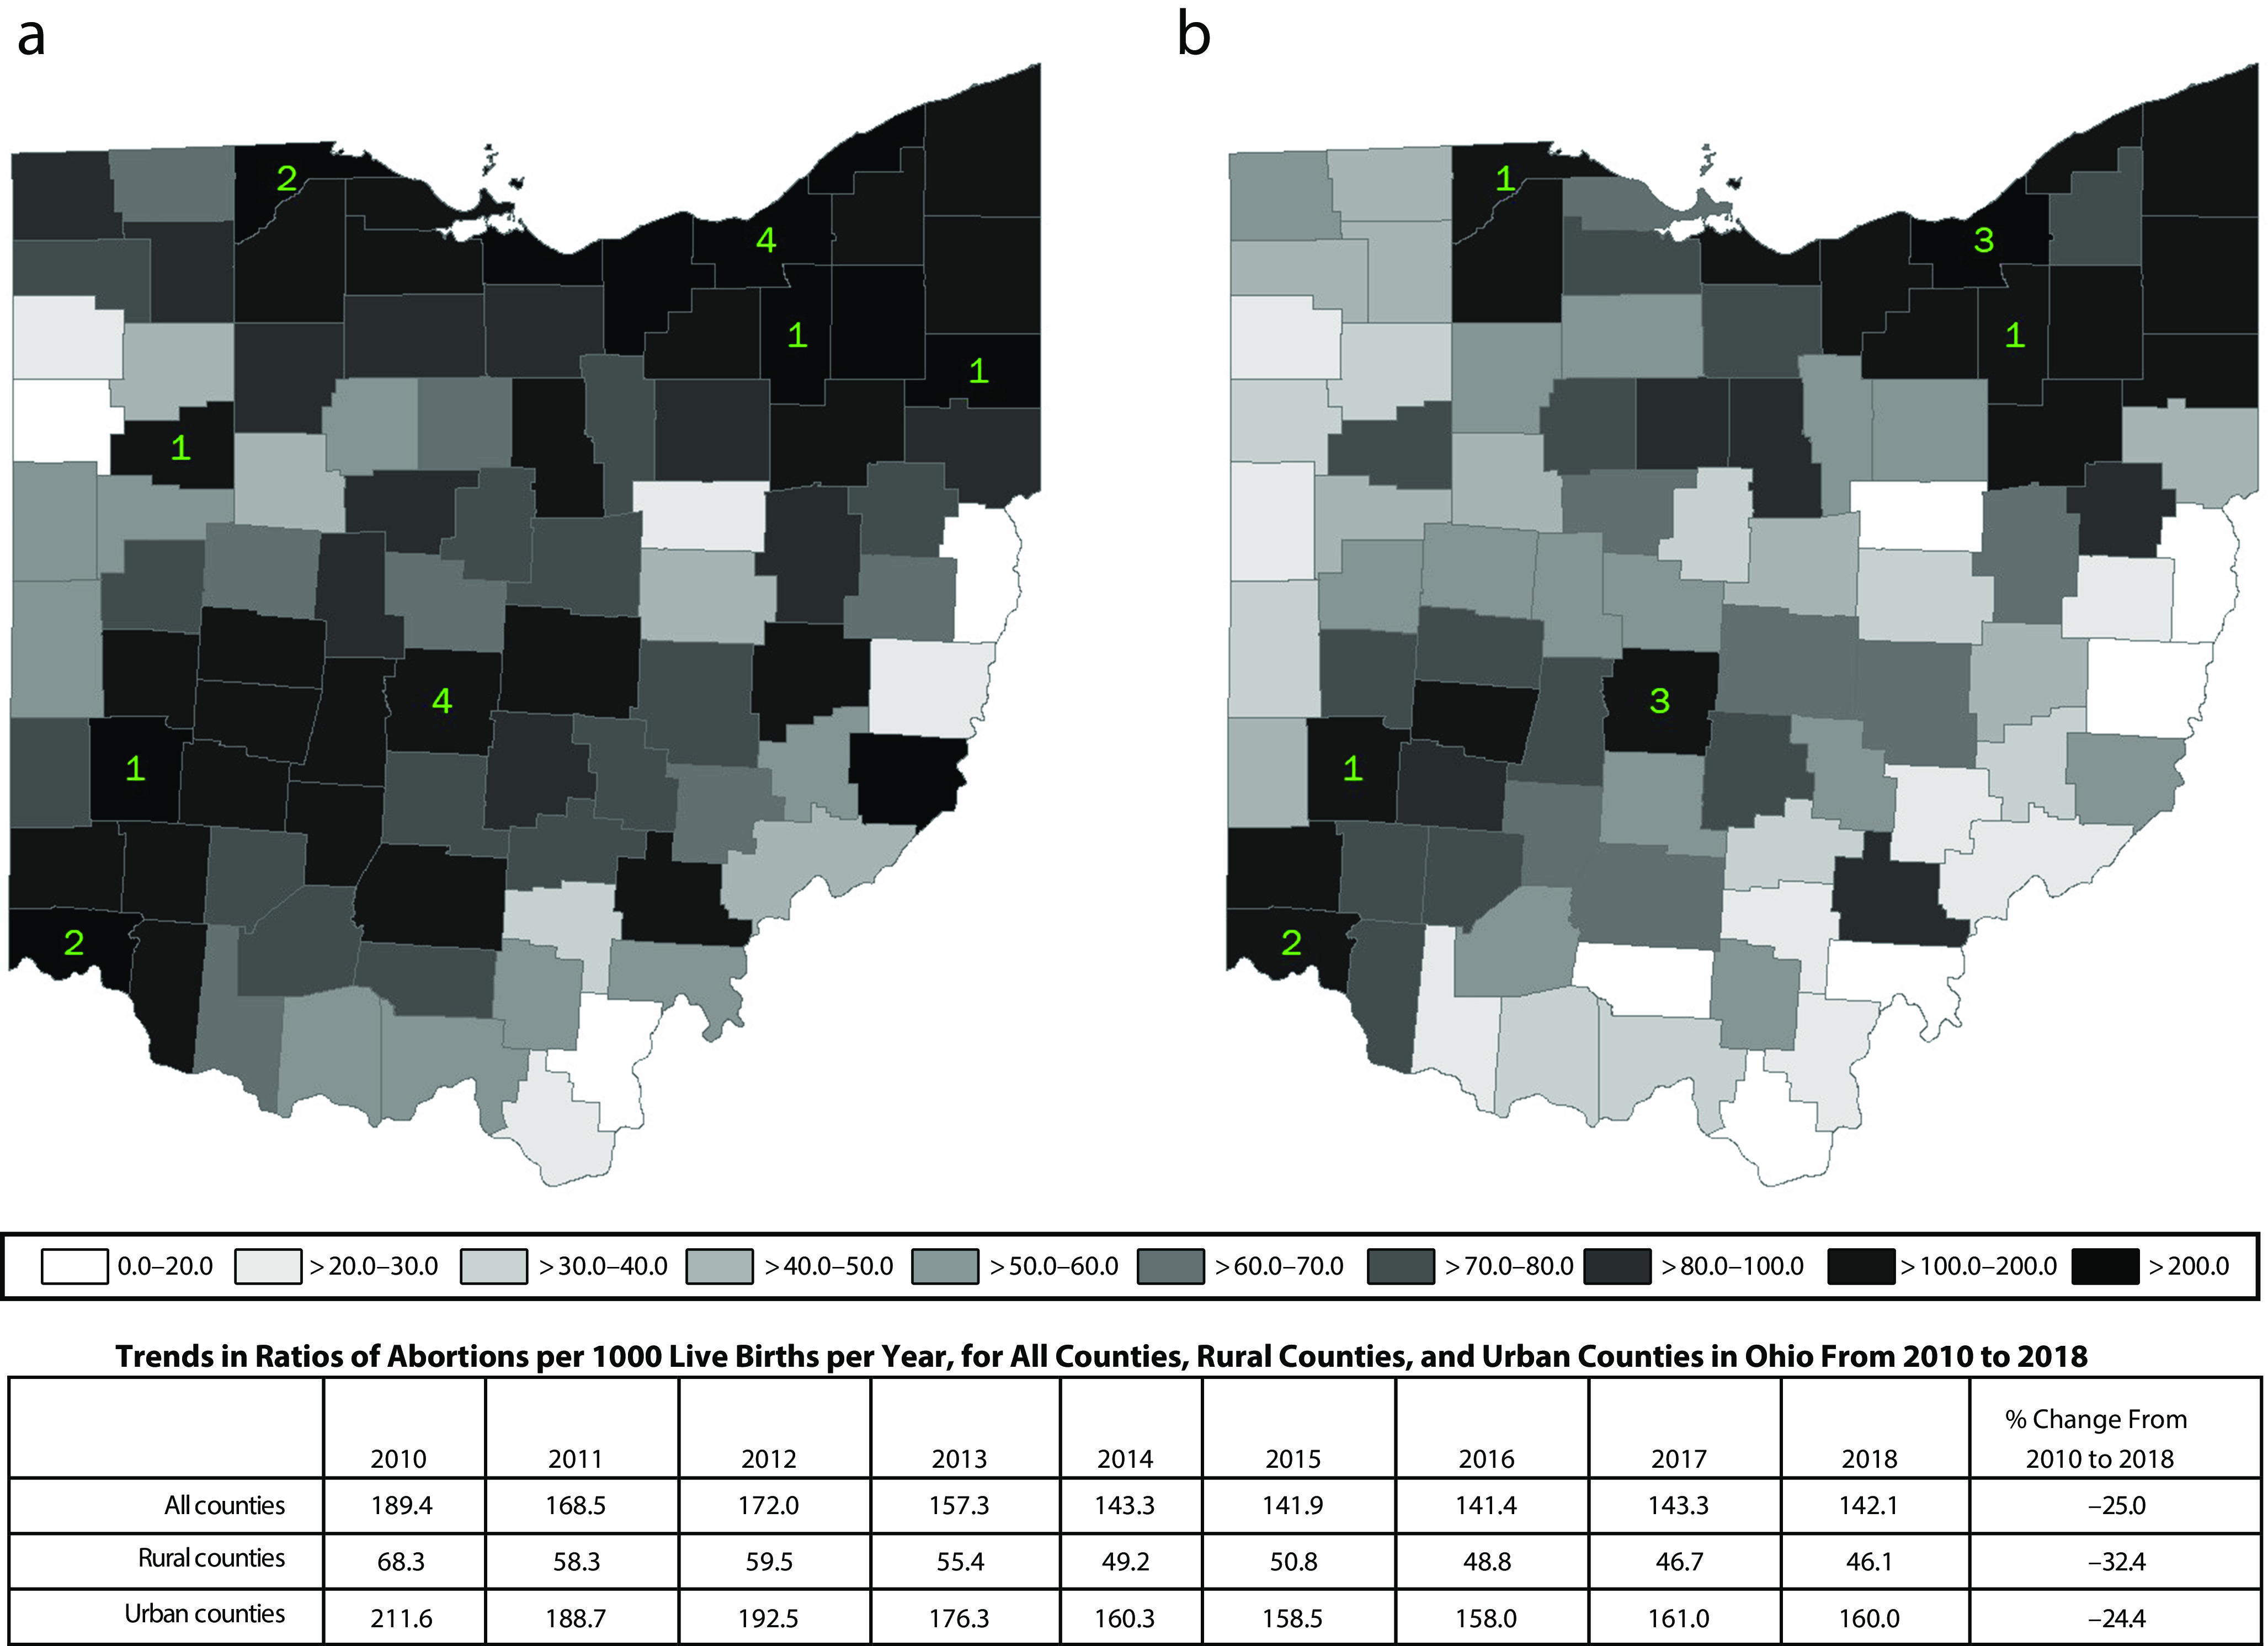
Ratios of Abortions per 1000 Live Births by County of Residence and Number of clinics in Ohio in (a) 2010 and (b) 2018
Note. Shading indicates ratio of abortions per 1000 live births per year by county of residence. The lighter shading of the county represents a lower abortion ratio (fewer abortions per 1000 live births). Green numbers indicate the number of clinics, both surgical and nonsurgical, open on June 1 of the given year. Counts of abortions by county were obtained from Ohio Department of Health’s “Induced Abortions in Ohio” report and live births were obtained from the Ohio Department of Health’s public health information warehouse. In 2010, Ohio had 15 surgical and medication and 1 medication-only abortion clinics. In 2018, Ohio had 8 surgical and medication and 3 medication-only abortion clinics.
County-level changes in abortion ratio were dynamic; online Figure A shows abortion ratios by county for each year from 2010 through 2018, with changes greater than 25% demarcated. These maps show that after abortion clinics in Toledo and Lima closed in 2013, the abortion ratios dropped by 25% or more in the next year in counties throughout northwest and west Ohio, where Toledo and Lima are located. The abortion ratios in those counties rebounded in the following years, but not to the level of preclinic closures. Although patients may have obtained abortions outside of Ohio during the year following the clinic closures, the low ratios likely represent some individuals who faced additional burdens to obtain abortion and some who did not have wanted abortions. A similar pattern of abortion ratio decline following clinic closure is suggested in places where other clinic closures occurred throughout Ohio (e.g., counties near Columbus in 2013); however, such declines are not as clearly apparent, perhaps because the clinics that closed were near to other clinics that remained open.
DISCUSSION
Since 2010, lawmakers in Ohio have established many laws that affect abortion provision and patients in the state. In 2010, the state had 15 surgical abortion clinics; in 2018, it had 8. In this article, we describe trends in abortion in Ohio in the context of these changing laws, drawing on aggregate data compiled from Ohio’s “Induced Abortions in Ohio” reports and from national and regional data used for comparison. Overall, rates of abortion declined in Ohio over the period of study, as they did in the rest of the country. These declines were not evenly distributed geographically—rural counties saw far larger declines in the abortion ratio than did urban counties, and some counties had pronounced declines after clinic closures. Abortions in the first trimester in Ohio shifted to later in that trimester over the period of study. In addition, there were fluctuations in the proportion of abortions using surgical versus medication methods, reflective of regulations regarding the medication abortion protocol.
The pace of decline in Ohio abortion rates was similar to that in the United States overall and in other Midwestern states, suggesting that these declines in abortion are attributable in part to larger national declines in unintended pregnancy (from 2008 to 2011, the United States saw an 18% decline in unintended pregnancy11). Nationally, most abortions occur in the context of unintended pregnancy, so decreases in unintended pregnancy rates will be reflected in decreases in abortion rates. Most of this decline in unintended pregnancy is thought to be attributable to better access to contraception and to increasing use of more effective forms of contraception.11,12 Particularly for adolescents, increases in the use of any method of contraception (compared with using no method) contributes to lower rates of unintended pregnancy.13
However, national and state-level trends may disguise a complex context in which a parallel pattern (decreasing abortion rate or ratio) may have divergent explanations. For example, the declines in unintended pregnancy are not homogenously experienced in the United States. Women with incomes less than 200% of the federal poverty level are more likely to have an unintended pregnancy than women with higher incomes. They are also less likely to have an abortion following an unintended pregnancy, meaning that some poor women have an experience opposite to that of the national trends.11 In Ohio, steep decreases in the abortion ratio in most rural counties, combined with consistently higher abortion ratios in urban counties, show that the overall state-level trend of decline obscures variation in county-level changes. Rural Ohioans may have fewer abortions because of lack of access to abortion or because of differential values regarding abortion, rather than simply because of declines in unintended pregnancy. Our findings, derived from data about abortions obtained, cannot illuminate how many people were forced to carry an unintended pregnancy to term. Our geographic analysis showed immediate declines in abortions in counties where clinics closed and in neighboring counties, suggesting that regulations affecting clinics shaped the experiences of patients and potential patients. Our results show larger declines in abortion in Ohio’s rural counties than in counties near major cities, where most abortion clinics are located, thus identifying possible geographic inequity in the impact of abortion regulations in Ohio. People across the United States experience disparities in reproductive health access as a consequence of rural residence.14,15
Other patterns of change in Ohio are more clearly attributable to the changing legal and regulatory context. For example, the proportion of abortions carried out by medication methods dropped sharply in response to a law that became effective in 2011 limiting evidence-based off-label use of mifepristone.16 Our findings of declines in use of medication abortion in 2011 and increases after 2016 following the FDA’s update to the mifepristone label are consistent with the impact of a similar law in Texas.17 Although many fewer Ohioans used medication abortion during the years 2011 to 2015, those who received the legally mandated, nonevidence-based protocol between 2011 and 2015 (compared with the evidence-based protocol) experienced higher costs and more clinic visits, side effects, and interventions.16 In the United States, the increasing availability and use of medication abortion is indicative of many patients’ preference for this method, and may be responsible for the country’s overall shift to earlier abortion.5 When national-level gestation data become available for 2017, we may see the pattern shifting to earlier abortion in Ohio as a result of increased access to medication abortion. Overall, we saw that a law that prevented evidence-based medication abortion limited the number of people who used the method, reducing access to earlier abortion.
Compared with the United States overall, more Ohioans who obtained first trimester abortions had them later in the first trimester, suggesting delays in access to care. This difference increased over the study period. In addition, Ohioans had a greater proportion of abortions at each gestation category greater than 9 weeks, except for 21 or more weeks, compared with the national proportions. Regulations around abortion facilities, such as those requiring transfer agreements (a requirement that reduces the number of clinics that can offer care), and difficulties in access due to limits on public facilities providing abortion and resulting from clinic closures, may delay people seeking abortion care, and thus these patterns may reflect an impact of the changing regulatory environment. Although all legal abortion in the United States is very safe, earlier abortions have even fewer risks for patients.
This article contributes to a small but growing body of research examining the impact of regulations on the prevalence and experience of abortion, particularly at the state level. For example, in Texas, increased regulations and closed clinics led to longer waiting periods and more abortions after 12 weeks gestation.18 Also, counties in Texas with closed clinics experienced substantial declines in abortion.19 A study of the impact of a 24-hour waiting period in Mississippi found that it delayed abortions by about 4 days on average.20 In Texas, women seeking abortions after regulations and clinic closures faced challenges such as increased cost of travel and travel time, confusion about where to obtain abortion services, and frustration about the inaccessibility of medication abortions.21–23 Clinic closures and abortion regulations impede access to abortions, and our findings indicate that reduced access is experienced inequitably by people living in rural areas.
Our primary goal was to understand how the landscape of abortion access and care has shifted in the context of the changing legislative environment. Because many laws and regulations were passed in a short period of time, it was not possible to identify the impact of individual laws. In addition, because our analysis is limited to abortion utilization in Ohio, we were unable to assess the experiences of those who may have wanted an abortion but were unable to obtain one or had to obtain one in another state. In particular, some of the declines in abortions reported for residents of northwest Ohio and southeast Ohio may be partially offset by residents obtaining abortions at clinics in Michigan and Pennsylvania, respectively.24 Thus, the trends described in this article may overstate changes in abortions received by Ohio residents.
Our analysis relied on publicly available aggregate data; our ability to describe variation in experiences of abortion was limited by the constraints of these data. For example, it was not possible to analyze racial/ethnic differences and their intersection with other social categories such as socioeconomic status or region without having access to the individual-level data. We would have liked to be able to describe county-level variation in the distribution of abortions by gestation—in order to understand how distance to the nearest provider might be related to the timing of abortions—but these data were not available at the county level.
Overall, we have demonstrated geographic variation in abortion use in Ohio, which may represent differences in demand for abortion, but it also suggests differences in access for people in rural areas, possibly exacerbated by Ohio law and regulation. Reduced access and abortion at later gestation within the first trimester have potential adverse effects on women’s health.25 Documentation of abortion utilization in Ohio during this period is important so that citizens and lawmakers understand the impact of law and policy changes. These findings can be used to support efforts by health care providers, health advocates, and lawmakers to advocate for laws that will support equitable access to abortion care in Ohio.
ACKNOWLEDGMENTS
This study was funded by a grant from a philanthropic foundation that makes grants anonymously.
We are grateful for thoughtful discussion during presentation of this work at the California Center for Population Research, University of California at Los Angeles, and at the 2019 Society of Family Planning Annual Meeting.
CONFLICTS OF INTEREST
None of the authors have any potential or actual conflicts of interest to disclose.
HUMAN PARTICIPANT PROTECTION
No protocol approval was necessary because data were obtained from secondary sources.
Footnotes
See also Nash, p. 1115.
REFERENCES
- 1.Health, United States, 2016, With Chartbook on Long-Term Trends in Health. Hyattsville, MD: National Center for Health Statistics; 2017. [PubMed] [Google Scholar]
- 2.Pazol K, Creanga AA, Burley KD, Hayes B, Jamieson DJ Centers for Disease Control and Prevention. Abortion surveillance—United States, 2010 [erratum in MMWR Surveill Summ. 2014;62(51):1053] MMWR Surveill Summ. 2013;62(8):1–44. [PubMed] [Google Scholar]
- 3.Pazol K, Creanga AA, Burley KD, Jamieson DJ. Abortion surveillance—United States, 2011. MMWR Surveill Summ. 2014;63(11):1–41. [PubMed] [Google Scholar]
- 4.Pazol K, Creanga AA, Jamieson DJ Centers for Disease Control and Prevention. Abortion surveillance—United States, 2012. MMWR Surveill Summ. 2015;64(10):1–40. doi: 10.15585/ss6410a1. [DOI] [PubMed] [Google Scholar]
- 5.Jatlaoui TC, Ewing A, Mandel MG et al. Abortion surveillance—United States, 2013. MMWR Surveill Summ. 2016;65(12):1–44. doi: 10.15585/mmwr.ss6512a1. [DOI] [PubMed] [Google Scholar]
- 6.Jatlaoui TC, Shah J, Mandel MG et al. Abortion surveillance—United States, 2014. MMWR Surveill Summ. 2017;66(24):1–48. doi: 10.15585/mmwr.ss6624a1. [DOI] [PubMed] [Google Scholar]
- 7.Jatlaoui TC, Boutot ME, Mandel MG et al. Abortion surveillance—United States, 2015. MMWR Surveill Summ. 2018;67(13):1–45. doi: 10.15585/mmwr.ss6713a1. [DOI] [PMC free article] [PubMed] [Google Scholar]
- 8.Jatlaoui TC, Eckhaus L, Mandel MG et al. Abortion surveillance—United States, 2016. MMWR Surveill Summ. 2019;68(11):1–41. doi: 10.15585/mmwr.ss6811a1. [DOI] [PubMed] [Google Scholar]
- 9.Ohio Dept of Health. ODH—explore data & stats. Available at: https://odh.ohio.gov/wps/portal/gov/odh/explore-data-and-stats. Accessed August 7, 2019.
- 10.NARAL. Who decides? The status of women’s reproductive rights in the United States. 2019. Available at: https://www.prochoiceamerica.org/report/2019-who-decides-the-status-of-womens-reproductive-rights-in-the-united-states. Accessed February 3, 2020.
- 11.Finer LB, Zolna MR. Declines in unintended pregnancy in the United States, 2008–2011. N Engl J Med. 2016;374(9):843–852. doi: 10.1056/NEJMsa1506575. [DOI] [PMC free article] [PubMed] [Google Scholar]
- 12.Frost JJ, Frohwirth LF, Zolna MR. Contraceptive needs and services, 2014 update. Guttmacher Institute. 2016. Available at: https://www.guttmacher.org/report/contraceptive-needs-and-services-2014-update. Accessed May 31, 2019.
- 13.Scott RH, Wellings K, Lindberg L. Adolescent sexual activity, contraceptive use, and pregnancy in Britain and the US: a multidecade comparison. J Adolesc Health. 2020 doi: 10.1016/j.jadohealth.2019.11.310. Epub ahead of print. [DOI] [PMC free article] [PubMed] [Google Scholar]
- 14.Bearak JM, Burke KL, Jones RK. Disparities and change over time in distance women would need to travel to have an abortion in the USA: a spatial analysis. Lancet Public Health. 2017;2(11):e493–e500. doi: 10.1016/S2468-2667(17)30158-5. [DOI] [PMC free article] [PubMed] [Google Scholar]
- 15.Bennett T. MSJAMA. Reproductive health care in the rural United States. JAMA. 2002;287(1):112. [PubMed] [Google Scholar]
- 16.Upadhyay UD, Johns NE, Combellick SL, Kohn JE, Keder LM, Roberts SCM. Comparison of outcomes before and after Ohio’s law mandating use of the FDA-approved protocol for medication abortion: a retrospective cohort study. PLoS Med. 2016;13(8):e1002110. doi: 10.1371/journal.pmed.1002110. [DOI] [PMC free article] [PubMed] [Google Scholar]
- 17.Baum SE, White K, Hopkins K, Potter JE, Grossman D. Rebound of medication abortion in Texas following updated mifepristone label. Contraception. 2019;99(5):278–280. doi: 10.1016/j.contraception.2019.01.001. [DOI] [PMC free article] [PubMed] [Google Scholar]
- 18.White K, Baum SE, Hopkins K, Potter JE, Grossman D. Change in second-trimester abortion after implementation of a restrictive state law. Obstet Gynecol. 2019;133(4):771–779. doi: 10.1097/AOG.0000000000003183. [DOI] [PMC free article] [PubMed] [Google Scholar]
- 19.Grossman D, White K, Hopkins K, Potter JE. Change in distance to nearest facility and abortion in Texas, 2012 to 2014. JAMA. 2017;317(4):437–439. doi: 10.1001/jama.2016.17026. [DOI] [PMC free article] [PubMed] [Google Scholar]
- 20.Joyce T, Kaestner R. The impact of Mississippi’s mandatory delay law on the timing of abortion. Fam Plann Perspect. 2000;32(1):4–13. [PubMed] [Google Scholar]
- 21.Fuentes L, Lebenkoff S, White K et al. Women’s experiences seeking abortion care shortly after the closure of clinics due to a restrictive law in Texas. Contraception. 2016;93(4):292–297. doi: 10.1016/j.contraception.2015.12.017. [DOI] [PMC free article] [PubMed] [Google Scholar]
- 22.Gerdts C, Fuentes L, Grossman D et al. Impact of clinic closures on women obtaining abortion services after implementation of a restrictive law in Texas. Am J Public Health. 2016;106(5):857–864. doi: 10.2105/AJPH.2016.303134. [DOI] [PMC free article] [PubMed] [Google Scholar]
- 23.Baum SE, White K, Hopkins K, Potter JE, Grossman D. Women’s experience obtaining abortion care in Texas after implementation of restrictive abortion laws: a qualitative study. PLoS One. 2016;11(10):e0165048. doi: 10.1371/journal.pone.0165048. [DOI] [PMC free article] [PubMed] [Google Scholar]
- 24.Jerman J, Frohwirth L, Kavanaugh ML, Blades N. Barriers to abortion care and their consequences for patients traveling for services: qualitative findings from two states. Perspect Sex Reprod Health. 2017;49(2):95–102. doi: 10.1363/psrh.12024. [DOI] [PMC free article] [PubMed] [Google Scholar]
- 25.Singh S, Remez L, Sedgh G, Kwok L, Onda T. Abortion worldwide 2017: uneven progress and unequal access. Guttmacher Institute. 2018. Available at: https://www.guttmacher.org/report/abortion-worldwide-2017. Accessed October 7, 2019.