Abstract
The elusive nature of assessing immunological processes in situ in organ transplantation is one of the major impediments to improve diagnostics and treatment. Here, we present a proof-of-concept study using multiplexed in situ hybridization (ISH) (RNAscope) to detect low-abundance cytokines in formalin-fixed paraffin-embedded (FFPE) human transplant kidney biopsies in combination with immunofluorescence (IF) for cell phenotyping. We show that a multiplex IF and ISH (mIFISH) assay is feasible to identify the cellular source of cytokines and chemokines (tumor necrosis factor-α, interferon-γ, and CXCL9) in FFPE transplant kidney biopsies and that quantification of the mRNA and protein signal is also possible at single-cell resolution in the context of tissue complexity. Furthermore, the mIFISH assay allows precise quantitative assessment of tubulitis, one of the key morphological correlates of alloimmune injury. Simultaneous in situ identification and quantification of multiple cellular phenotypes and mRNA expression of proinflammatory cytokines in FFPE tissues offer a novel insight into the biology of alloimmune injury in kidney transplantation and may contribute to improved diagnostic accuracy and patient care.
Keywords: acute cellular rejection, kidney transplantation, mIFISH, whole-slide digital image analysis
Introduction
The Banff classification is the gold standard for assessing kidney transplant pathologies.1,2 Banff is based on consensus guidelines with light microscopic evaluation of biopsies aided by semiquantitative scoring in combination with limited immunophenotypical and electron microscopic analysis.2 However, due to the complexity of the immune system with its orchestrated communication and networks of immune mediators and effectors, the Banff classification provides only a superficial glimpse at the mechanisms underlying transplant alloimmune injury. Although the advent of gene expression profiling of transplant kidney biopsies3,4 has greatly advanced our understanding of the molecular underpinnings of alloimmune injury, this approach has its own limitations due to loss of spatial context information. Platforms that can detect mRNA from formalin-fixed paraffin-embedded (FFPE) tissues have also evolved; however, they are not yet able to deconvolute signals in the context of cellular phenotype.5–7
In situ phenotypical assays such as immunohistochemistry (IHC) retain spatial context; however, cytokines that regulate the inflammatory responses cannot be reliably detected in FFPE tissues with IHC. Furthermore, the small volume of biopsy tissue is one of the major limitations for more comprehensive studies on kidney allografts. These have led to the increasing importance to develop multiplexed assays that can profile molecular biomarkers within the structural context of the pathological changes. However, various multiplexing technologies that have been described (Multiplexed Immunohistochemical Consecutive Staining on Single Slide [MICSSS], Proximity Ligation Assay for RNA [PLAYR], etc.) focus exclusively on protein expression without detailed information on gene expression or do not work on standard FFPE tissues.8,9 Assays detecting mRNA via in situ hybridization (ISH) using RNAscope and proteins via IHC in FFPE tissues have been described but may not be able to colocalize the mRNA signal within a specific cell type because the IHC signal blocks the ISH signal.10 The aim of this study was to detect the mRNA of low-abundance immune modulators using commercially available ISH (RNAscope) technology11 and to determine the cellular source of the immune modulators in FFPE human transplant kidney biopsies. Here, we show that using a multiplexed immunofluorescence (IF) and ISH (mIFISH) protocol, we can detect, quantitate, and identify the cellular source of cytokines (e.g., tumor necrosis factor-α [TNF-α] and interferon-γ [IFN-γ]) in FFPE transplant kidney biopsies.
Materials and Methods
Patients
FFPE human tonsils and transplant kidney biopsies (6 months protocol and for cause) were identified from the Department of Pathology tissue bank at the University of California, San Francisco (UCSF). The work on human tissue samples was performed in accordance with the principles of the Helsinki Declaration of 1975 and was approved by the UCSF Committee on Human Subjects Research, and all patients provided informed consent to an institutional review board (IRB)-approved correlative research protocol before the collection of tissue (UCSF IRB P0540542). Transplant kidney biopsies diagnosed with acute cellular rejection (ACR) and no signs of rejection based on the most current Banff criteria were selected for the study.12
In Situ Hybridization
Single ISH Pretreatment
FFPE tissue sections (2 µm) were deparaffinized in xylene and rehydrated in decreasing concentrations of ethanol (100% and 80% and distilled water, 5 min each). Rehydrated tissue sections were incubated with Bloxxall (SP-6000; Vector Laboratory, Burlingame, CA) at room temperature (RT) for 15 min. Tissue sections were incubated in RNAscope Target Retrieval Solution (Advanced Cell Diagnostics, Inc.; Newark, CA) for antigen retrieval at 100C for 15 min. FFPE tissue was digested with RNAscope Protease Plus 1:5 diluted in cold 1× PBS at 40C for 15 min.
Hybridization and Amplification
After probe hybridization for 2 hr at 40C, amplification steps were performed as described in the RNAscope 2.5 HD red or brown user manual with the exception that Amp5 was performed for 1 hr. Amp 6 includes alkaline phosphatase (AP) or horseradish peroxidase (HRP) labels for red or brown kits, respectively.
Chromogenic Signal Development
After the last TBST wash step, AP-labeled probes were developed using RNAscope Fast Red according to the manufacture’s recommendation for 10 min. Fast Red–stained slides were washed once for 2 min in distilled water and then directly counterstained in hematoxylin and cover-slipped as described below.
Fluorescent Signal Development
HRP-labeled probes were then developed with tyramide signal amplification (TSA) fluorescence. For our experiments, probes were visualized using TSA-Cy3 (NEL744E001KT; PerkinElmer, Waltham, MA) at a dilution of 1:3000, according to the manufacturer’s instructions, and incubated for 15 min at RT. Dilutions and incubation times of TSA fluorescence may vary by protocol. At this point, samples either move on to IF staining for mIFISH or were directly counterstained. Sections containing fluorescent ISH signal were counterstained with spectral 4′,6-diamidino-2-phenylindole (DAPI) (FP1490; PerkinElmer) according to the manufacturer’s instructions and cover-slipped in fluorescent mounting medium (S3023; Dako, Carpinteria, CA).
Duplex ISH: Custom-made Dual HRP Endpoint Pretreatment
As described above.
Probe Hybridization
C2 probe was diluted 1:50 in C1 probe and hybridized for 2 hr at 40C.
Amplification
Amp1 to Amp6 were performed as described in the section above.
Development of C2-HRP-labeled Probe
HRP-labeled probes were visualized using TSA-Cy3 or TSA-Cy5 (NEL705A001KT; PerkinElmer) at a dilution of 1:3000. Next, two to four drops of HRP blocker were added to the sections and incubated for 15 min at 40C in the HybEZ oven. Slides then move on to Amp7–10.
Development of C1-HRP-labeled probe
After Amp7–10, C1-HRP-labeled probes were visualized with TSA-Cy3 or TSA-Cy5 at a dilution of 1:3000 according to the manufacturer’s instructions and incubated for 15 min at RT. At this point, samples were moved on to IF staining for mIFISH. After TSA fluorescence detection, slides were washed for 2 min in 1× RNAscope Washing Buffer before proceeding with the next step (Supplemental Table 1).
Counterstain Red Chromogenic ISH
Sections containing Fast Red chromogenic label were counterstained in Gill’s hematoxylin (HXGHE1LT; American Master Tech, Lodi, CA) for 2 min, rinsed in deionized water, and then blued for 15 sec in 1× TBST, followed by a final rinse in deionized water. Slides were then air-dried at 60C and then cover-slipped with VectaMount (H-5000; Vector Laboratory, Burlingame, CA).
mIFISH
The mIFISH assay consists of manual fluorescent ISH (single or duplex), followed by automated IF staining using an autostainer (Leica Bond RX; Leica Biosystems, Wetzlar, Germany) with one or two markers. After ISH and the final wash step, the slides were placed in 1× TBS and transferred to Leica Bond RX and were washed with Leica Bond Wash Buffer. A cocktail of primary antibodies was incubated for 1 hr at RT. All antibodies were diluted at 1:100 and all slides underwent standard AgRT for IHC and ISH AgRT when the methods were combined (for antibodies and clones, see Table 1). After washing, a cocktail of secondary antibodies labeled with fluorophores were incubated for 30 min at RT at 1:200 dilution (for antibodies and fluorophores, see Supplemental Table 2). Counterstain was performed as above. The entire procedure of mIFISH including image acquisition could be accomplished in 15 hr. The reagent cost for a 3-plex mIFISH assay is approximately $120 per slide.
Table 1.
Primary Antibodies Tested for mIFISH Compatibility.
| Antibody/Target | Species | Isotype | Clone | Cat. No. | Vendor | Standard AgRT (Heat-induced) | Target |
|---|---|---|---|---|---|---|---|
| Cytokeratin-7 | Mouse | IgG | EPR1619Y | ab68459 | Abcam | pH6 | Tubular cell—cytoplasmic |
| Aquaporin-1 | Mouse | IgG2Bκ | 1/22 | ab9566 | Abcam | pH6 | Tubular cell—cytoplasmic |
| panCytokeratin | Rabbit | IgG1κ | AE1/AE3 | bs-1712R | Bioss | pH6 | Tubular cell—cytoplasmic |
| Lotus, Biotylated Lectin | NA | N/A | N/A | B-1325 | Vector | pH9 | Tubular cell—cytoplasmic |
| WilmsTumor-1 | Mouse | IgG1κ | 6F-H2 | ab96792 | Abcam | pH9 | Podocytes—nuclear/cytoplasmic |
| Synaptopodin | Rabbit | C-Terminus | Polyclonal | LS-B5353 | LSBio | pH9 | Podocytes—nuclear/cytoplasmic |
| CD34 | Mouse | IgG1κ | QBEnd-10 | M7165 | Dako | pH6 | Endothelial, smooth muscle |
| CD34 | Rabbit | IgG | EP373Y | ab81289 | Abcam | pH6 | Endothelial, smooth muscle |
| CD31 | Mouse | IgG1 kappa | JC70A | M0823 | Dako | pH6 | Endothelial |
| CD45 | Mouse | IgG1κ | 2B11+PD7/26 | M0701 | Dako | pH6 | Immune cell—membrane |
| CD20 | Mouse | IgG2a K | L26 | M0755 | Dako | pH6 | B-cell—membrane |
| CD3 | Rabbit | N/A | Polyclonal | A0452 | Dako | pH6 | T-cell—membrane |
| CD3 | rat | IgG | CD3-12 | ab11089 | Abcam | pH6 | T-cell—membrane |
| CD4 | Rabbit | IgG | EPR6855 | ab133616 | Abcam | pH6 | T-cell—membrane |
| CD8 | Mouse | IgG1 K | C8/144B | M7103 | Dako | pH6 | T-cell—membrane |
| CD8 | Mouse | IgG2b | 4B11 | NCL-CD8 | Leica/Novocastra | pH6 | T-cell—membrane |
| CD68 | Mouse | IgG1 K | KP1 | M0814 | Dako | pH6 | Macrophages—membrane |
| CD68 | Rabbit | IgG | Polyclonal | ab125047 | Abcam | pH6 | Macrophages—membrane |
| CD21 | Mouse | IgG2A | 2G9 | PA0171 | Leica/Novocastra | pH6 | Follicular dendritic cell—cytoplasmic |
Abbreviation: mIFISH, multiplex immunofluorescence and in situ hybridization.
Microscopy and Automated Image Analysis
Image Acquisition and Processing
Images were acquired using a Zeiss AxioScan (Carl Zeiss; Oberkochen, Germany) whole-slide scanner with ZEN Zeiss software. As focus strategy, we used Zeiss software autofocus with support points with a Z-stack of 9 µm and 10 slices with an interval of 1 µm. Orthogonal projection was used for postprocessing to reduce image size from 10–20 GB to 1–2 GB. As the last processing step, individual tiles were fused using the Zeiss application Stitching.
IF Image Analysis
Quantification of the mRNA signal was assessed by automated whole-slide digital image analysis using Definiens Tissue Studio image analysis software (Definiens AG; Munich, Germany). After image acquisition and processing (see above), whole-slide images (czi-format) were uploaded to Tissue Studio IF, DAPI (blue), CK.AE1AE3.Lotus (green), CD45 (red), and TNF-α (white dots) (Fig. 1A). We manually identified the region of interest (e.g., the entire biopsy), and an algorithm was used to identify nuclei, cells, and IF and ISH signals. The software identified the nuclei on hematoxylin- or DAPI-stained images, simulated and highlighted in blue in the original image (Fig. 1B). Cellular segmentation was carried out using the simulation mode “grow from nuclei at 3 µm,” simulated and highlighted in red (Fig. 1C). Then, the ISH signal was detected within the cells and highlighted as turquois dots in the original image (Fig. 1D). Our multiplexing mIFISH approach allowed us to classify different cell phenotypes with mRNA ISH signal as CD45+ (yellow), CK.AE1AE3.Lotus+ (pink), CD45+ cells infiltrating tubular structures (white), and CD45+ cells infiltrating tubular structures without ISH signal (turquois) (Fig. 1E). To validate the solution and as a quality control (QC) measure, for each case we visually assessed 12 randomly selected high-power fields at 20× before and after the application of the solution for the accuracy of nuclear detection, cell simulation, IF and ISH signal detection, and cell classification. Although a strict fixation, hybridization, staining, and scanning protocol was followed, we noticed that the IF signal intensity of the antibody staining differs between individual cases. Therefore, algorithm for the IF signal detection was adjusted according to the visual QC. It has to be mentioned that kidney tissues often show protein deposits (“protein resorption droplets”) with strong autofluorescence in the tubular compartment that interferes with the analysis and thus need to be excluded manually.
Figure 1.
Workflow of ISH signal detection and cell phenotyping on whole-slide images using Definiens Tissue Studio. (A) Whole-slide images are uploaded in Definiens Tissue Studio, DAPI (blue), CK.AE1AE3.Lotus (green), CD45 (red), and TNF-α (white dots). (B) Nuclei (deep blue) are identified by DAPI counterstain, and (C) individual cells (red) are simulated based on the nuclei. (D) Identification of individual ISH signal (turquois). (E) Based on the ISH and immunofluorescent signal (CD45+ [red] and CK.AE1AE3.Lotus+ [green]) coexpression by individual cells, the ISH signal can be quantified at a single-cell level. Cell classification: mRNA ISH and CD45 double-positive cells (yellow), mRNA ISH and CK.AE1AE3.Lotus double-positive cells (pink), mRNA ISH and CD45 double-positive cells infiltrating tubular structures (white), and CD45-positive cells infiltrating tubular structures without mRNA ISH signal (turquois). Abbreviations: DAPI, 4′,6-diamidino-2-phenylindole; ISH, in situ hybridization; TNF-α, tumor necrosis factor-α.
ISH Signal Analysis
First, we quantified ISH-positive and ISH-negative cells and expressed the ISH-positive cells as a percentage of all cells on the entire biopsy. As the ISH signal can appear as small individual dots (“punctate”) or multiple single dots and larger irregular clusters (fused dots) in the cells, we decided to characterize the mRNA expression level of a gene of interest as ISH signal area (µm2) per biopsy area (1000 µm2). Next, we used the cell phenotype classifier and quantified the ISH signal per defined cell phenotype and presented the signal area (µm2) per 1000 µm2 within the defined cell phenotype.
Quantitative Tubulitis Score
Our multiplexing mIFISH assay allowed classification and quantification of CD45+ leukocytes infiltrating the CK.AE1AE3.Lotus+ tubular structures, referred to as cells. To calculate the quantitative tubulitis score (QTS) (the average number of proximal tubule infiltrating leukocytes per 100 tubular epithelial cells), the total number of cells was divided by the total number of tubular epithelial cells (i.e., CK.AE1AE3.Lotus+ cells) and multiplied with 100 (QTS = [ /all CK.AE1AE3.Lotus+] × 100).
Tissue Quality and Assay Control
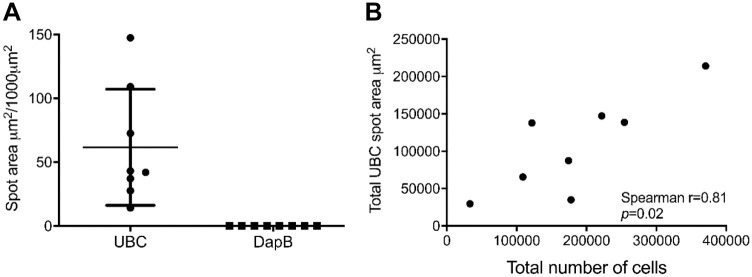
The tissue type (e.g., tonsil vs kidney) and preanalytical variables such as tissue fixation may have an impact on the mIFISH assays. Therefore, we performed tissue and assay QC stains using a positive control gene (UBC) and a negative control gene (bacterial DapB) for all cases enrolled in the study. These QC steps ensure appropriate tissue quality for RNA preservation (UBC) and help to identify false-positive and false-negative signal. We found a good UBC (14–150 µm2/1000 µm2) signal and a very low DapB (0.2 µm2/1000 µm2) signal within the study cases, indicating a good tissue and mRNA quality and low false-positive signal in our study set (Fig. 2A). Interestingly, we observed a 10-fold difference between the highest and lowest UBC signal. Therefore, we tested whether this is due to differences in mRNA quality or due to differences in the cellularity between the samples. A good correlation was observed between the total UBC spot area (µm2) and the total number of cells based on the DAPI signal (Spearman r = 0.81) (Fig. 2B). This became obvious with a visual assessment of the images.
Figure 2.
In situ assessment of mRNA preservation quality in FFPE kidney biopsies. Immunofluorescent in situ hybridization on transplant kidney biopsies (n=8) for ubiquitin (UBC, positive control) and bacterial gene DapB (negative control) was performed. (A) A strong UBC (+) mRNA signal and a very low DapB (−) signal were observed. (B) The total UBC signal correlates strongly with the total cellular load in the biopsy (r = 0.86, p=0.02). Abbreviation: FFPE, formalin-fixed paraffin-embedded.
Statistics
Values were displayed as mean ± SD. Comparisons between values were performed using the Mann–Whitney test. To evaluate correlations between chromogenic and IF ISH signal, Spearman’s correlation was used. For all tests, the level of significance was set at 0.05.
Cell Culture and Flow Cytometry
Normal donors were consented for whole blood donation. Peripheral blood mononuclear cells (PBMCs) were isolated as described previously.13 Twelve million cells were stimulated for 1 hr with 20 ng/ml phorbol 12-myristate 13-acetate (PMA) and 1 µg/ml ionomycin or incubated for the same duration without stimulation. Two million stimulated and unstimulated PBMCs were then analyzed via flow cytometry for TNF-α and IFN-γ production. The stained cells were analyzed on an FACSCalibur or AccuriC6 (BD Biosciences; San Diego, CA). All antibodies were from BD Biosciences unless otherwise noted. Stimulated and unstimulated PBMCs (10 million cells in each group) were fixed in 4% paraformaldehyde at 4C for 24 hr. Stimulated PBMCs and unstimulated PBMCs were then mixed in a ratio of 100:0, 50:50, 25:75, and 0:100. Cells were then pelleted in Histogel (HG-4000-144; FisherScientific, Newington, NH) as previously described by Deleage et al.14
Results
ISH Probe Validation on FFPE Cells and Tissue
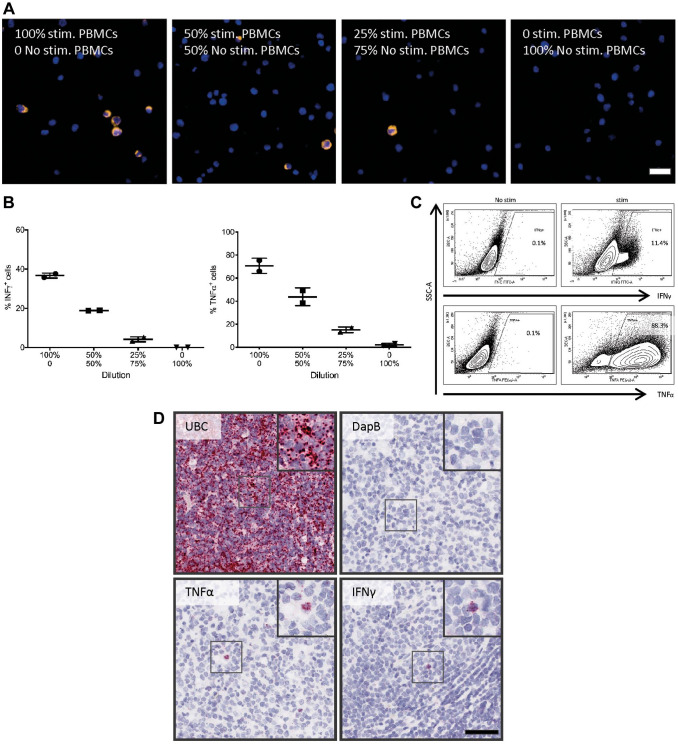
TNF-α and IFN-γ were detected on human FFPE PBMC cell blocks using IF RNAscope ISH technology followed by quantitative whole-slide digital image analysis (Fig. 3A). Stimulation of PBMCs led to an increased number of TNF-α+ (70.1 ± 6.6%) and IFN-γ+ cells (36.7 ± 1.3%) compared with PBMCs without stimulation (1.2 ± 3.1% and 0.02 ± 0.03%). To further test the quantitative capabilities of the assay, we mixed stimulated and unstimulated PBMCs. As expected, the percentage of TNF-α mRNA+ and IFN-γ mRNA+ cells decreased in line with the diminishing ratios of stimulated cells (43.8%, 18.9% and 15.2%, 4.3%; Fig. 3B). As a control, we analyzed PBMCs from the same experiment by flow cytometry. The protein-based detection revealed a similar trend for the TNF-α+ (88.3%) and IFN-γ+ (11.4%) cells after PBMC stimulation to that seen with the ISH assay (Fig. 3C).
Figure 3.
Probe validation on FFPE cells and tissue. PBMCs were either stimulated (PMA 500 ng/mL, ionomycin 1 µg/mL for 4 hr) or not stimulated. (A) ISH was performed on FFPE PBMC cell blocks with a ratio of 100:0, 50:50, 25:75, and 0:100 of stimulated to unstimulated PBMCs. Representative microphotographs: after stimulation, the TNF-α ISH signal was very strong and formed clusters with a cytoplasmic-like signal. Scale bar = 20 µm. Therefore, (B) ISH signal was quantified and expressed as the percentage of TNF-α+ and IFN-γ+ cells. The percentage of TNF-α+ and IFN-γ+ cells decreased with the decreased ratios of stimulated to unstimulated PBMCs. (C) Stimulated and unstimulated PBMCs were analyzed by flow cytometry for TNF-α and IFN-γ; stimulation leads to increased number of TNF-α+ and IFN-γ+ cells. (D) ISH assay validation on human FFPE tonsil tissue and chromogenic ISH for UBC, DapB, TNF-α, and IFN-γ were performed on 2-µm-thick human FFPE tonsil sections. UBC (positive control) has a high-abundance signal, whereas no signal for the bacterial gen DapB was observed in human FFPE tonsil tissue. Besides cells with low mRNA expression of TNF-α and IFN-γ, we also observed cells with high amount of mRNA signal (black box) in the tonsil. Scale bar = 50µm. Abbreviations: FFPE, formalin-fixed paraffin-embedded; IFN-γ, interferon-γ; ISH, in situ hybridization; PBMCs, peripheral blood mononuclear cells; PMA, phorbol 12-myristate 13-acetate; TNF-α, tumor necrosis factor-α.
To examine whether the target ISH probes (TNF-α and IFN-γ) are working on human FFPE tissue, we performed a chromogenic ISH on 2-µm-thick human tonsil tissue sections. UBC (positive control) showed very high expression, and the bacterial gen DapB (negative control) had no signal. The probes of interest showed crisp signal in scattered cells for both cytokines (TNF-α and IFN-γ) while the majority of the cells were completely negative (Fig. 3D).
Cross-validation of ISH for Chromogenic and IF Assay in Human FFPE Transplant Kidney Biopsies
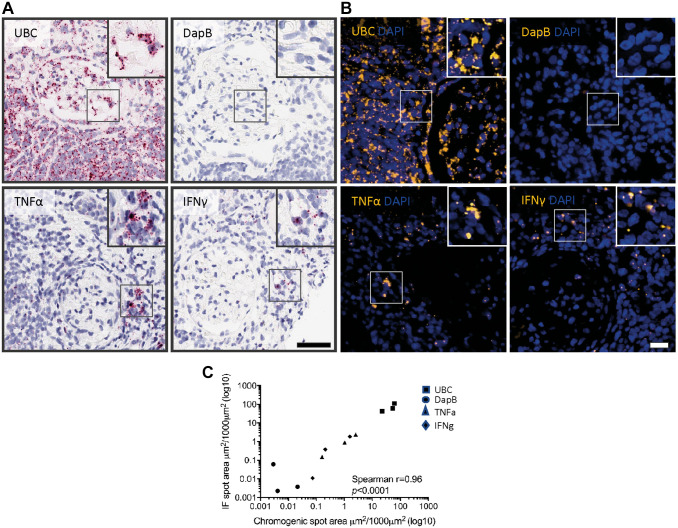
For multiplexing assays, fluorescent visualization of the ISH signal is preferred to chromogenic detection for better quantification. Because the red chromogenic (AP) and immunofluorescent (HRP and tyramide) ISH assays use different catalytic signal amplification/detection methods, we tested how these assays correlate. Thus, two consecutive sections from human FFPE transplant kidney biopsies from three patients with the diagnoses of Banff normal, ACR, and acute-mediated rejection (AMR) were used for chromogenic (red, AP) (on section 1) or immunofluorescent (HRP, tyramide Cy3) (on section 2) ISH to detect UBC, DapB, TNF-α, and IFN-γ (Fig. 4A and B). We observed that the very-high-abundance (UBC, positive control), intermediate-abundance (TNF-α, IFN-γ), and very-low-abundance (DapB, negative control) signals showed a high correlation (r = 0.96, p<0.0001) between the chromogenic and immunofluorescent ISH assays (Fig. 4C).
Figure 4.
Cross-validation of ISH for chromogenic and IF assay in human FFPE transplant kidney biopsies. Six-month FFPE transplant kidney protocol biopsies (n=3) were cut into 2-µm-thick sections. (A) Either chromogenic ISH (scale bar = 50 µm) or (B) IF ISH was performed on two consecutive sections of each case for UBC, DapB, TNF-α, and IFN-γ (scale bar = 20 µm). Whole-slide scans were acquired on Aperio Scanner (chromogenic) and Zeiss AxioScanner (IF); digital image analysis was performed with Definiens Tissue Studio (ISH spot area in µm2/1000 µm2). (C) ISH signal for the chromogenic (x-axis) and immunofluorescent (y-axis) assay for high-abundance signal (UBC, positive control), intermediate-abundance signal (TNF-α, IFN-γ), and very-low-abundance signal (DapB, negative control) shows a high correlation (r = 0.96, p<0.0001) between the chromogenic and immunofluorescent ISH assay. For better visual presentation, data are presented as log10. Abbreviations: FFPE, formalin-fixed paraffin-embedded; IF, immunofluorescence; IFN-γ, interferon-γ; ISH, in situ hybridization; TNF-α, tumor necrosis factor-α.
ISH Antigen Retrieval Is Compatible With Indirect Immunofluorescence
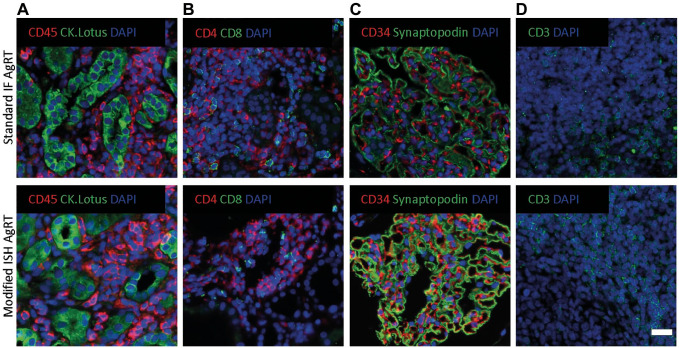
One potential caveat of combining ISH with indirect antibody immunofluorescent staining (mIFISH assay) is the potential alteration of tissue integrity and antigen expression by the more aggressive antigen retrieval for ISH. To address this question, FFPE transplant kidney biopsy sections underwent either our standard automated heat-induced antigen retrieval (Leica Bond RX, upper panel) or manual ISH antigen retrieval (low pH 6 + protease digestion, lower panel) and were then stained on the Leica Bond RX automated stainer for various antibody combinations of interest (Fig. 5 and Table 1). We did not observe loss of tissue during the ISH antigen retrieval process. After image acquisition with the same exposure times, there were no apparent differences in staining properties including signal intensity between the two antigen retrieval methods for any of the antibodies tested.
Figure 5.
Compatibility of indirect immunofluorescence staining with ISH antigen retrieval. Two consecutive 2-µm-thick sections of human FFPE kidney biopsies underwent either standard heat-induced antigen retrieval pH 6 or 9, as applicable (Leica Bond RX, upper panel), or modified ISH antigen retrieval (pH 6 + protease, lower panel) and were then stained with one to two primary antibodies. The signal was visualized with an indirect immunofluorescence detection method. (A) Immune/structural marker (CD45/CK.AE1AE3.Lotus), (B) T-cell marker (CD4/CD8), (C) structural marker (CD34/Synaptopodin), and (D) T-cell marker (CD3). No major differences between the two antigen retrieval methods were observed. Scale bar = 20 µm. Abbreviations: FFPE, formalin-fixed paraffin-embedded; ISH, in situ hybridization.
Application of mIFISH to Assess mRNA Expression of TNF-α and IFN-γ by Distinct Cell Populations
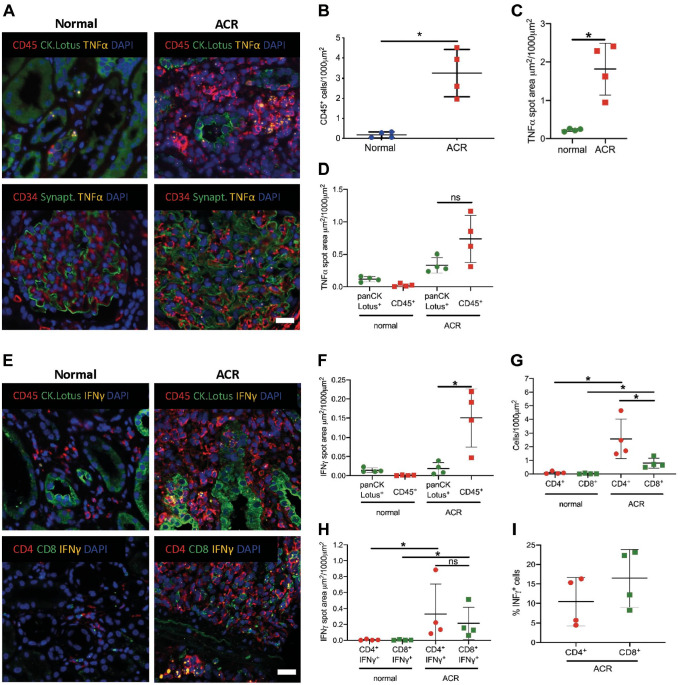
To determine whether mIFISH can be used to qualitatively and quantitatively assess mRNA expression and to identify the cellular origin of the signal, human transplant kidney biopsies from patients with Banff category normal (n=4) and ACR (n=4) were analyzed. Consecutive 2 µm tissue sections were stained with three mIFISH 4-plex marker panels, including one mRNA target TNF-α or IFN-γ (cytokine signal), combined with CD45 (marker of leukocytes), CK-AE1/AE3 and Lotus (marker of tubular epithelial cells), and DAPI as a nuclear counterstain. A second mIFISH 4-plex panel consisted of one mRNA target TNF-α, CD34 (for endothelial cells), synaptopodin (podocyte marker), and DAPI as a nuclear counterstain. A third panel was made up of detecting IFN-γ mRNA besides CD4 (CD4+ T-cells), CD8 (cytotoxic T-cells), and DAPI for nuclear counterstain (Fig. 6A and E).
Figure 6.
Application of mIFISH to qualitatively and quantitatively assess mRNA expression by distinct cell populations. (A) Representative microphotographs of mIFISH assay showing TNF-α mRNA expression (orange channel), CD45 (red channel), and CK.AE1AE3.Lotus (green channel, upper panel) and TNF-α mRNA expression (orange channel), CD34 (red channel), and synaptopodin (green channel, lower panel). (B) CD45+ cell count on a whole-slide FFPE kidney transplant biopsy in normal (n=4) and ACR (n=4) cases. Each dot represents CD45+ cell count per 1000 µm2. (C) TNF-α mRNA expression on whole-slide FFPE kidney transplant biopsies. Each dot represents the TNF-α mRNA expression in a whole slide expressed as spot area µm2/1000 µm2. (D) Origin of TNF-α mRNA expression subclassified by immune cell (CD45+) and tubular cell compartment (CK.AE1AE3.Lotus+). *p=0.02; ns, not significant. (E) Representative microphotographs of mIFISH assay showing IFN-γ mRNA expression (orange channel), CD45 (red channel), and CK.AE1AE3.Lotus (green channel, upper panel) and IFN-γ mRNA expression (orange channel), CD4 (red channel), and CD8 (green channel, lower panel). (F) Origin of IFN-γ mRNA expression subclassified by immune cell (CD45+) and tubular cell compartment (CK.AE1AE3.Lotus+). *p=0.02; ns, not significant. (G) CD4+ and CD8+ cell count on a whole-slide FFPE kidney transplant biopsy in normal (n=4) and ACR (n=4) cases. Each dot represents CD4+ and CD8+ cell count per 1000 µm2. (H) Origin of IFN-γ mRNA expression subclassified by CD4+ and CD8+ T-cells. Each dot represents the IFN-γ mRNA expression in a whole slide expressed as spot area µm2/1000 µm2. (I) Percentage of IFN-γ+ cells in the CD4+ and CD8+ T-cell population. *p=0.02; ns, not significant. Scale bar = 20 µm. Abbreviations: ACR, acute cellular rejection; mIFISH, multiplex immunofluorescence and in situ hybridization; IFN-γ, interferon-γ; TNF-α, tumor necrosis factor-α.
To assess the cell phenotype and the expression level of cytokines of interest in kidney transplant biopsies, whole-slide digital image analysis was performed using Definiens Tissue Studio IF. Patients with ACR showed more CD45+ infiltrating cells compared with samples with no rejection (p=0.028; Fig. 6B). As expected, more TNF-α mRNA signal was seen in ACR than in normal kidneys (p=0.028; Fig. 6C). Interestingly, multiparameter analysis revealed that in normal kidneys the majority of TNF-α was produced by tubular epithelial cells as opposed to those of ACR (Fig. 6D). No TNF-α signal was seen in endothelial cells and podocytes in normal cases, whereas in ACR rare TNF-α signal was present in podocytes and also in a few endothelial cells (Fig. 6A). IFN-γ was upregulated in ACR compared with normal kidney biopsies (p=0.028, data not shown). In ACR samples, IFN-γ was mainly produced by CD45+ leukocytes (p=0.028; Fig. 6F). mIFISH allowed classifying CD45+ cells into CD4+ and CD8+ T-subtypes and showed that cases with ACR had more CD4+ and CD8+ infiltrating T-cells compared with normal cases (p=0.028; Fig. 6G) and also that CD4+ T-cells were the predominant T-cell subset in ACR (p=0.028; Fig. 6G). This analysis also revealed that CD4+ and CD8+ T-cells produced comparable amount of IFN-γ mRNA during ACR (Fig. 6H). In addition, 5% to 15% of CD4+ T-cells were CD4+IFN-γ+ double-positive effector Th1 T-cells, whereas 10% to 23% were CD8+IFN-γ+ double-positive cytotoxic effector T-cells (Fig. 6I).
Quantitative Assessment of Cytokine-producing CD45⁺ Cells Within Tubules (Tubulitis) on mIFISH Images
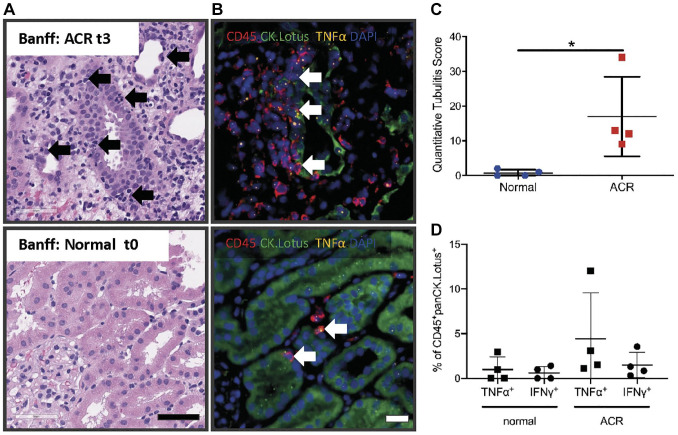
In the Banff schema, the grade of tubulitis is assessed semiquantitatively on standard hematoxylin and eosin–stained sections (Fig. 7A). Here, we used whole-slide digital images of an mIFISH panel with TNF-α or IFN-γ (cytokine), combined with CD45 (leucocytes), CK-AE1/AE3 and Lotus (tubular epithelial cells), and DAPI as a nuclear counterstain to quantitatively assess tubulitis in eight biopsies with Banff normal (n=4; t0) and ACR diagnostic categories (n=3; t2 and n=1; t3). The image analysis strategy, as described above, allowed detection and precise quantification of CD45+ cells infiltrating the tubular structures (Fig. 7B). The “QTS” represents the average number of proximal tubule infiltrating leukocytes per 100 tubular epithelial cells on a whole section (see “Material and Methods” section). The QTS analysis revealed that two biopsies that were reported as normal (Banff t0) had one to two cells per 100 tubular cells (QTS 1 and 2). The ACR cases diagnosed with Banff t2 and t3 had significantly higher QTS values (9–34 cells per 100 tubular cells) compared with normal kidney biopsies (p=0.028; Fig. 7C). Additional multiparameter image analysis revealed that TNF-α and IFN-γ mRNA was not only produced by tubular infiltrating CD45+ in the QTS 9–34 biopsies (Banff t2 and t3) but also in the two QTS 1 and 2 biopsies (Banff t0) (Fig. 7B and D).
Figure 7.
Possible application of mIFISH to quantitatively assess tubular infiltrating CD45+ cells and their TNF-α and IFN-γ mRNA expression in transplant kidney biopsies. (A) H&E of kidney transplant biopsies with ACR (Banff t3, top) and normal, no signs of rejection (Banff t0, bottom) as diagnostic category; black arrows indicate leukocytes causing tubulitis. Scale bar = 50µm. (B) mIFISH panel to detect TNF-α mRNA expression in CD45+ cells that cause tubulitis (white arrows) in ACR (Banff t3, top) and normal (Banff t0, bottom) kidney transplant biopsies. (C) Quantitative assessment of CD45+ cells infiltrating the tubules with the new developed “quantitative tubulitis score” in ACR and normal kidney transplant biopsies. (D) Quantification of cells (tubular infiltrating leukocytes) that express TNF-α and IFN-γ in ACR and normal kidney transplant biopsies. *p=0.02; ns, not significant. Scale bar = 20µm. Abbreviations: ACR, acute cellular rejection; IFN-γ, interferon-γ; mIFISH, multiplex immunofluorescence and in situ hybridization; TNF-α, tumor necrosis factor-α.
mIFISH Helps to Visualize the Spatial Context of Immune Microenvironment
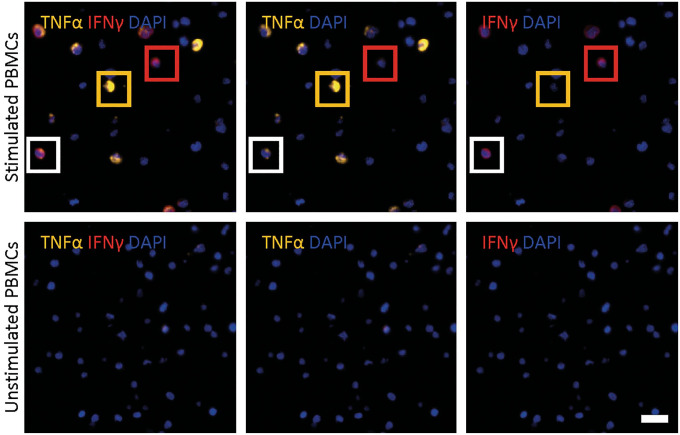
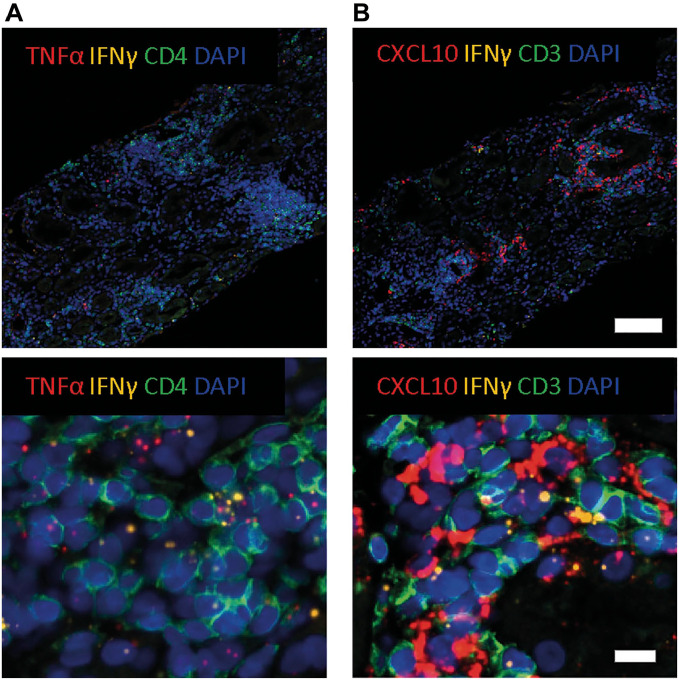
In vitro experiments showed that IFN-γ induces TNF-α mRNA production and directly induces CXCL9 and CXCL10 mRNA production.15,16 Therefore, we wanted to examine the spatial relationship between IFN-γ, TNF-α, and CXCL10 in human FFPE transplant kidney biopsies with ACR with a custom-made duplex RNAscope assay. However, first we analyzed stimulated FFPE PBMCs which showed various combinations of expression patterns with IFN-γ+TNF-α−, IFN-γ−TNF-α+, and double-positive IFN-γ+TNF-α+ mRNA, whereas unstimulated PBMCs revealed no IFN-γ or TNF-α signal (Fig. 8). In FFPE kidney transplant biopsies, we observed that IFN-γ and TNF-α mRNA appears in clusters throughout biopsy in ACR. Interestingly, CD4+IFN-γ+ cells appeared to be associated with TNF-α mRNA signal in surrounding CD4+ T-cells. (Fig. 9A). Furthermore, we also observed individual cells with an IFN-γ+TNF-α+ phenotype, although this was a rare event.
Figure 8.
Identification of double-positive TNF-α+ and IFN-γ+ cells in stimulated PBMCs. Representative microphotographs of TNF-α (yellow) and IFN-γ (red) ISH on stimulated (upper panel) and non-stimulated (lower panel) FFPE PBMCs with a custom-made duplex RNAscope assay with two HRP endpoints. Yellow box highlights a single TNFα+ cell, red box highlights a single IFN-γ+ cell, and white box highlights a TNF-α+IFN-γ+ double-positive cell. Scale bar = 20µm. Abbreviations: FFPE, formalin-fixed paraffin-embedded; HRP, horseradish peroxidase; IFN-γ, interferon-γ; ISH, in situ hybridization; PBMCs, peripheral blood mononuclear cells; TNF-α, tumor necrosis factor-α.
Figure 9.
Identification of coexpression and relationship between IFN-γ and TNF-α/CXCL10 in ACR transplant kidney biopsy. (A) Representative microphotographs of 4-plex mIFISH assay consisting of two mRNA signals (TNF-α, red; IFN-γ, yellow) and one phenotypical marker (CD4, green) and DAPI as nuclear counterstain in FFPE kidney transplant biopsy with ACR. (B) Representative microphotographs of 4-plex mIFISH assay consisting of two mRNA signals (CXCL10, red; IFN-γ, yellow) and one phenotypical marker (CD3, green) and DAPI as nuclear counterstain in FFPE kidney transplant biopsy with acute cellular rejection. Upper scale bar = 100 µm, lower scale bar = 20 µm. Abbreviations: ACR, acute cellular rejection; DAPI, 4′,6-diamidino-2-phenylindole; FFPE, formalin-fixed paraffin-embedded; IFN-γ, interferon-γ; mIFISH, multiplex immunofluorescence and in situ hybridization; TNF-α, tumor necrosis factor-α.
For IFN-γ and CXCL10, an overall similar signal distribution, albeit with much higher CXCL10 mRNA signal, was observed (Fig. 9B). Interestingly, CXCL10 was expressed in such high amounts that the signal formed clusters and had a “cytoplasmic”-like staining pattern with only few CD3+IFN-γ+ cells surrounded by many CXCL10 mRNA signal dots. Higher magnification indicated that both CD3+ and CD3− cells produce CXCL10.
Discussion
The elusive nature of precise in situ assessment of immunological processes in kidney transplant biopsies is one of the major impediments to improve diagnostics. Development of highly sensitive technologies to characterize individual cells and their proinflammatory cytokine profiles in situ in FFPE tissues is the first step toward successful studies to interrogate immunological events in human transplant pathology. Herein we show that the mIFISH assay can identify and quantify the cellular source of cytokines (e.g., TNF-α and IFN-γ) in situ in FFPE transplant kidney biopsies. In contrast to chromogenic RNAscope technologies, the mIFISH assay can identify the source of the ISH signal at single-cell resolution.10 In combination with whole-slide scanning and digital image analysis, the mIFISH assay allows to address biologically relevant questions in the field of transplant pathology.
The first step for assay development was to validate the probes of interest for mIFISH. PBMCs were used to compare the percentage of TNF-α+ and IFN-γ+ cells using flow cytometry (protein) and ISH (mRNA). The percentage of TNF-α+ cells in the two assays was comparable. However, differences in the percentage of IFN-γ+ cells between the two assays (mRNA vs protein) were noted after stimulation, which could be attributed to posttranscriptional control of the IFN-γ protein.17
Fluorescent visualization of the signal in the mIFISH assay is quintessential for precise quantification. Cross-validation of the fluorescent platform against chromogenic detection yielded high correlation between the two ISH assays in human FFPE tissues. Yet, combining indirect IF with ISH (i.e., mIFISH assay) could potentially be hindered by impediment of tissue integrity and altered antigenicity by the more aggressive antigen retrieval protocol required for the ISH arm of the assay. We compared our standard antigen retrieval method with the modified ISH antigen retrieval and observed no loss of tissue or deterioration of signal intensity with the ISH antigen retrieval process. Therefore, we concluded that ISH can be used for the antigens tested in combination with immunofluorescent microscopy for the mIFISH assay.
In this study, we used the mIFISH assay to enumerate and subtype the CD45+ immune cells infiltrating the kidney allograft in situ. With multiparameter IF phenotyping, we were also able to identify the cellular source of two cytokines (TNF-α and IFN-γ) produced by both immune and non-immune cells. Further subclassification of the immune cells, for example, to distinguish between INF-γ+CD4+ and INF-γ+CD8+ T-cells is also feasible on serial sections.
The mIFISH assay also enables assessment of the cytokine production in spatial context. We introduced a protocol to detect and quantitate tubulitis in kidney transplant biopsies and to define subsets of the CD45+ cells within the tubules with TNF-α and IFN-γ signals. In some biopsies reported as Banff t0 indicating lack of tubulitis based on standard histopathological assessment, CD45+ cells were identified within tubules featuring cytokine production. Furthermore, the 3-plex mIFISH assay can also be used to detect two mRNA molecules with one additional phenotypical marker. Previous in vitro studies showed that IFN-γ induces TNF-α mRNA production and directly induces CXCL9 and CXCL10 mRNA production.15,16 Here, we used the mIFISH technology to show in kidney transplant biopsies that IFN-γ and TNF-α mRNA and IFN-γ and CXCL10 mRNA signals are often colocalized in the biopsies of patients with ACR. Prominent CXCL10 expression was readily appreciated in the biopsies with only a few INF-γ+CD3+ cells in the surrounding areas, suggesting perhaps that INF-γ might be a very potent inducer of CXCL10 production.
Although the RNAscope technology is highly sensitive,11 precise quantification of the signal on the mIFISH assay proved to be challenging. Small punctate ISH signals can merge into larger clusters both on the chromogenic and on the fluorescent platforms, making in situ mRNA quantification based on counting the dots highly unreliable. Therefore, we recommend measuring the ISH signal based on area metrics, with the ISH signal area being the numerator and the tissue or cell area being the denominator. Additional problem that we encountered for automated ISH signal quantification was the strong nonspecific signal stemming from tubular casts both on the chromogenic and on the fluorescent platforms. The false-positive signals from the casts had to be corrected manually on each image.
Chromogenic ISH assays have been used in combination with IHC in the past for quantitative assessment of the mRNA signal in various cell types. However, the main disadvantage of this approach is that the chromogenic ISH and IHC signals interfere, making reliable quantification of either signal difficult and the spatial resolution suboptimal.10,18 To bypass this problem, we developed a multiplexed fluorescent-based assay (mIFISH) for both mRNA detection and phenotypical characterization of the cells in FFPE tissues. We show that with the mIFISH assay the cellular source of the cytokines (e.g., TNF-α and IFN-γ) can be identified in transplant kidney biopsies at single-cell resolution, and both the ISH and IF signals can be quantified. Precise quantification of the signal requires strict standardization of the protocol, including fixed exposure times for scanning for each marker and verification of satisfactory mRNA preservation in the tissues by applying positive ISH controls as also shown in our previous work.19 Furthermore, with the mIFISH assay, information on the spatial context of the cytokine-producing cells can be acquired and analyzed. Such information may help to improve the in situ assessment of the immunological processes in kidney transplants and other organ transplants where similar rejection mechanisms apply and may eventually contribute to improved diagnostics and patient care.
Supplemental Material
Supplemental material, 2020-00033R1_Production_Supplemental_Tables_online_supp for Novel In Situ Hybridization and Multiplex Immunofluorescence Technology Combined With Whole-slide Digital Image Analysis in Kidney Transplantation by Henrik Junger, Dejan Dobi, Adeline Chen, Linda Lee, Joshua J. Vasquez, Qizhi Tang and Zoltan G. Laszik in Journal of Histochemistry & Cytochemistry
Footnotes
Competing Interests: The author(s) declared no potential conflicts of interest with respect to the research, authorship, and/or publication of this article.
Author Contributions: All authors have contributed to this article as follows: HJ conceived, designed, and coordinated research studies; and conducted experiments, analyzed data, and wrote the manuscript. DD had substantial contributions to the conception or design of the work. AC and LL conducted experiments. JJV had substantial contributions to the conception or design of the work. QT conceived, designed, and coordinated research studies; analyzed data; and edited the manuscript. ZGL conceived, designed, and coordinated research studies; analyzed data; and edited the manuscript. All authors have read and approved the final manuscript.
Funding: The author(s) disclosed receipt of the following financial support for the research, authorship, and/or publication of this article: This work was supported by the National Institutes of Health (U24) and the Deutsche Forschungsgemeinschaft (JU3080).
Contributor Information
Henrik Junger, Department of Pathology, University of California, San Francisco, CA; Department of Surgery, University of California, San Francisco, CA.
Dejan Dobi, Department of Pathology, University of California, San Francisco, CA.
Adeline Chen, Department of Pathology, University of California, San Francisco, CA.
Linda Lee, Department of Surgery, University of California, San Francisco, CA.
Joshua J. Vasquez, Department of Medicine, University of California, San Francisco, CA
Qizhi Tang, Department of Surgery, University of California, San Francisco, CA.
Zoltan G. Laszik, Department of Pathology, University of California, San Francisco, CA.
Literature Cited
- 1. Loupy A, Haas M, Solez K, Racusen L, Glotz D, Seron D, Nankivell BJ, Colvin RB, Afrouzian M, Akalin E, Alachkar N, Bagnasco S, Becker JU, Cornell L, Drachenberg C, Dragun D, de Kort H, Gibson IW, Kraus ES, Lefaucheur C, Legendre C, Liapis H, Muthukumar T, Nickeleit V, Orandi B, Park W, Rabant M, Randhawa P, Reed EF, Roufosse C, Seshan SV, Sis B, Singh HK, Schinstock C, Tambur A, Zeevi A, Mengel M. The Banff 2015 kidney meeting report: current challenges in rejection classification and prospects for adopting molecular pathology. Am J Transplant. 2017;17(1):28–41. doi: 10.1111/ajt.14107. [DOI] [PMC free article] [PubMed] [Google Scholar]
- 2. Solez K, Colvin RB, Racusen LC, Haas M, Sis B, Mengel M, Halloran PF, Baldwin W, Banfi G, Collins AB, Cosio F, David DSR, Drachenberg C, Einecke G, Fogo AB, Gibson IW, Glotz D, Iskandar SS, Kraus E, Lerut E, Mannon RB, Mihatsch M, Nankivell BJ, Nickeleit V, Papadimitriou JC, Randhawa P, Regele H, Renaudin K, Roberts I, Seron D, Smith RN, Valente M. Banff 07 classification of renal allograft pathology: updates and future directions. Am J Transplant. 2008;8(4):753–60. doi: 10.1111/j.1600-6143.2008.02159.x. [DOI] [PubMed] [Google Scholar]
- 3. Hutchinson JA, Boger CA. Transplant survival: knowing the future. Lancet. 2016;388(10048):940–1. doi: 10.1016/S0140-6736(16)30967-9. [DOI] [PubMed] [Google Scholar]
- 4. O’Connell PJ, Zhang W, Menon MC, Yi Z, Schroppel B, Gallon L, Luan Y, Rosales IA, Ge Y, Losic B, Xi C, Woytovich C, Keung KL, Wei C, Greene I, Overbey J, Bagiella E, Najafian N, Samaniego M, Djamali A, Alexander SI, Nankivell BJ, Chapman JR, Smith RN, Colvin R, Murphy B. Biopsy transcriptome expression profiling to identify kidney transplants at risk of chronic injury: a multicentre, prospective study. Lancet. 2016;388(10048):983–93. doi: 10.1016/S0140-6736(16)30826-1. [DOI] [PMC free article] [PubMed] [Google Scholar]
- 5. Sigdel T, Nguyen M, Liberto J, Dobi D, Junger H, Vincenti F, Laszik Z, Sarwal MM. Assessment of 19 genes and validation of CRM gene panel for quantitative transcriptional analysis of molecular rejection and inflammation in archival kidney transplant biopsies. Front Med (Lausanne). 2019;6:213. doi: 10.3389/fmed.2019.00213. [DOI] [PMC free article] [PubMed] [Google Scholar]
- 6. Sigdel TK, Nguyen M, Dobi D, Hsieh SC, Liberto JM, Vincenti F, Sarwal MM, Laszik Z. Targeted transcriptional profiling of kidney transplant biopsies. Kidney Int Rep. 2018;3(3):722–31. doi: 10.1016/j.ekir.2018.01.014. [DOI] [PMC free article] [PubMed] [Google Scholar]
- 7. Veldman-Jones MH, Brant R, Rooney C, Geh C, Emery H, Harbron CG, Wappett M, Sharpe A, Dymond M, Carl Barrett J, Harrington EA, Marshall G. Evaluating robustness and sensitivity of the nanoString technologies nCounter platform to enable multiplexed gene expression analysis of clinical samples. Cancer Res. 2015;75(13):2587–93. doi: 10.1158/0008-5472.CAN-15-0262. [DOI] [PubMed] [Google Scholar]
- 8. Frei AP, Bava FA, Zunder ER, Hsieh EW, Chen SY, Nolan GP, Gherardini PF. Highly multiplexed simultaneous detection of RNAs and proteins in single cells. Nature Methods. 2016;13(3):269–75. doi: 10.1038/nmeth.3742. [DOI] [PMC free article] [PubMed] [Google Scholar]
- 9. Remark R, Merghoub T, Grabe N, Litjens G, Damotte D, Wolchok JD, Merad M, Gnjatic S. In-depth tissue profiling using multiplexed immunohistochemical consecutive staining on single slide. Sci Immunol. 2016;1(1):aaf6925. doi: 10.1126/sciimmunol.aaf6925. [DOI] [PMC free article] [PubMed] [Google Scholar]
- 10. Grabinski TM, Kneynsberg A, Manfredsson FP, Kanaan NM. A method for combining RNAscope in situ hybridization with immunohistochemistry in thick free-floating brain sections and primary neuronal cultures. PLoS ONE. 2015;10(3):e0120120. doi: 10.1371/journal.pone.0120120. [DOI] [PMC free article] [PubMed] [Google Scholar]
- 11. Wang F, Flanagan J, Su N, Wang LC, Bui S, Nielson A, Wu X, Vo H-T, Ma X-J, Luo Y. RNAscope: a novel in situ RNA analysis platform for formalin-fixed, paraffin-embedded tissues. J Mol Diagn. 2012;14(1):22–29. doi: 10.1016/j.jmoldx.2011.08.002. [DOI] [PMC free article] [PubMed] [Google Scholar]
- 12. Haas M, Loupy A, Lefaucheur C, Roufosse C, Glotz D, Seron D, Nankivell BJ, Halloran PF, Colvin RB, Akalin E, Alachkar N, Bagnasco S, Bouatou Y, Becker JU, Cornell LD, Duong van Huyen JP, Gibson IW, Kraus ES, Mannon RB, Naesens M, Nickeleit V, Nickerson P, Segev DL, Singh HK, Stegall M, Randhawa P, Racusen L, Solez K, Mengel M. The Banff 2017 Kidney Meeting Report: revised diagnostic criteria for chronic active T cell-mediated rejection, antibody-mediated rejection, and prospects for integrative endpoints for next-generation clinical trials. Am J Transplant. 2018;18(2):293–307. doi: 10.1111/ajt.14625. [DOI] [PMC free article] [PubMed] [Google Scholar]
- 13. Putnam AL, Brusko TM, Lee MR, Liu W, Szot GL, Ghosh T, Atkinson MA, Bluestone JA. Expansion of human regulatory T-cells from patients with type 1 diabetes. Diabetes. 2009;58(3):652–62. doi: 10.2337/db08-1168. [DOI] [PMC free article] [PubMed] [Google Scholar]
- 14. Deleage C, Wietgrefe SW, Del Prete G, Morcock DR, Hao XP, Piatak M, Jr, Bess J, Anderson JL, Perkey KE, Reilly C, McCune JM, Haase AT, Lifson JD, Schacker TW, Estes JD. Defining HIV and SIV reservoirs in lymphoid tissues. Pathog Immun. 2016;1(1):68–106. [DOI] [PMC free article] [PubMed] [Google Scholar]
- 15. Antonelli A, Ferrari SM, Fallahi P, Ghiri E, Crescioli C, Romagnani P, Franceschini SS, Serio M, Ferrannini E. Interferon-alpha, -beta and -gamma induce CXCL9 and CXCL10 secretion by human thyrocytes: modulation by peroxisome proliferator-activated receptor-gamma agonists. Cytokine. 2010;50(3):260–7. doi: 10.1016/j.cyto.2010.01.009. [DOI] [PubMed] [Google Scholar]
- 16. Vila-del Sol V, Punzon C, Fresno M. IFN-gamma-induced TNF-alpha expression is regulated by interferon regulatory factors 1 and 8 in mouse macrophages. J Immunol. 2008;181(7):4461–70. [DOI] [PubMed] [Google Scholar]
- 17. Khabar KS, Young HA. Post-transcriptional control of the interferon system. Biochimie. 2007;89(6–7):761–9. doi: 10.1016/j.biochi.2007.02.008. [DOI] [PMC free article] [PubMed] [Google Scholar]
- 18. Yuan J, Zhang J, Zhu Y, Li N, Tian T, Li Y, Li YY, Li Z, Lai Y, Gao J, Shen L. Programmed death-ligand-1 expression in advanced gastric cancer detected with RNA in situ hybridization and its clinical significance. Oncotarget. 2016;7(26):39671–9. doi: 10.18632/oncotarget.9381. [DOI] [PMC free article] [PubMed] [Google Scholar]
- 19. Vasquez JJ, Hussien R, Aguilar-Rodriguez B, Junger H, Dobi D, Henrich TJ, Thanh C, Gibson E, Hogan LE, McCune J, Hunt PW, Stoddart CA, Laszik ZG. Elucidating the burden of HIV in tissues using multiplexed immunofluorescence and in situ hybridization: methods for the single-cell phenotypic characterization of cells harboring HIV in situ. J Histochem Cytochem. 2018;66(6):427–46. doi: 10.1369/0022155418756848. [DOI] [PMC free article] [PubMed] [Google Scholar]
Associated Data
This section collects any data citations, data availability statements, or supplementary materials included in this article.
Supplementary Materials
Supplemental material, 2020-00033R1_Production_Supplemental_Tables_online_supp for Novel In Situ Hybridization and Multiplex Immunofluorescence Technology Combined With Whole-slide Digital Image Analysis in Kidney Transplantation by Henrik Junger, Dejan Dobi, Adeline Chen, Linda Lee, Joshua J. Vasquez, Qizhi Tang and Zoltan G. Laszik in Journal of Histochemistry & Cytochemistry


