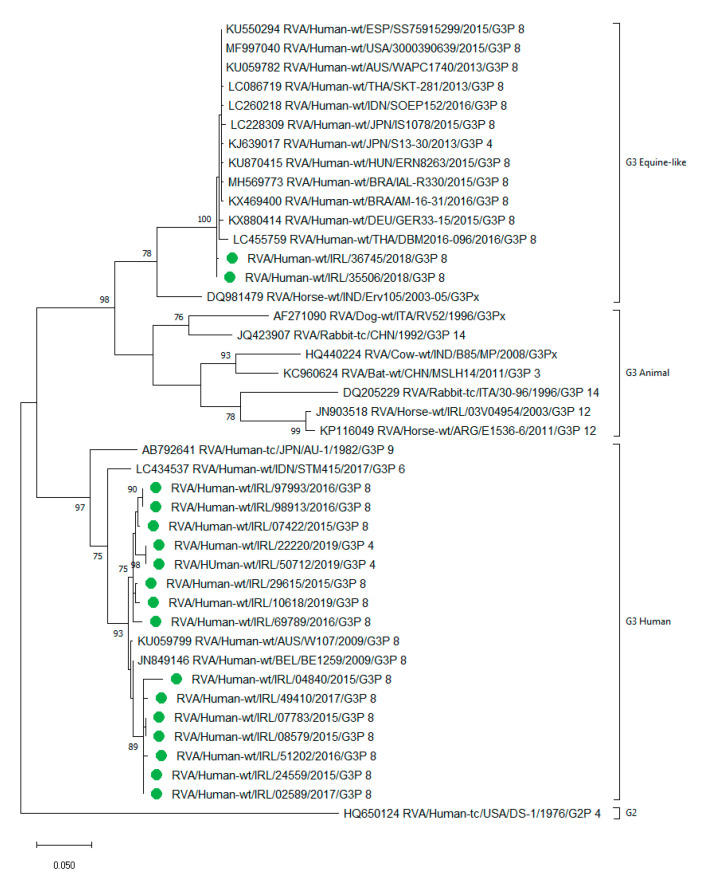
Figure 3.
Phylogenetic tree of VP7 G3 rotavirus gene sequences. The tree was constructed by using the maximum likelihood method and the Tamura-Nei model [29]. Bootstrap values (1000 replicates) above 75% are shown. The tree is drawn to scale, with branch lengths measured in the number of substitutions per site. This analysis shows 46 nucleotide sequences; 17 from Irish strains identified in this study (colour coded with green circle) and 29 from reference strains in GenBank. Phylogenetic analyses were conducted in MEGA X [30].

