Figure 2.
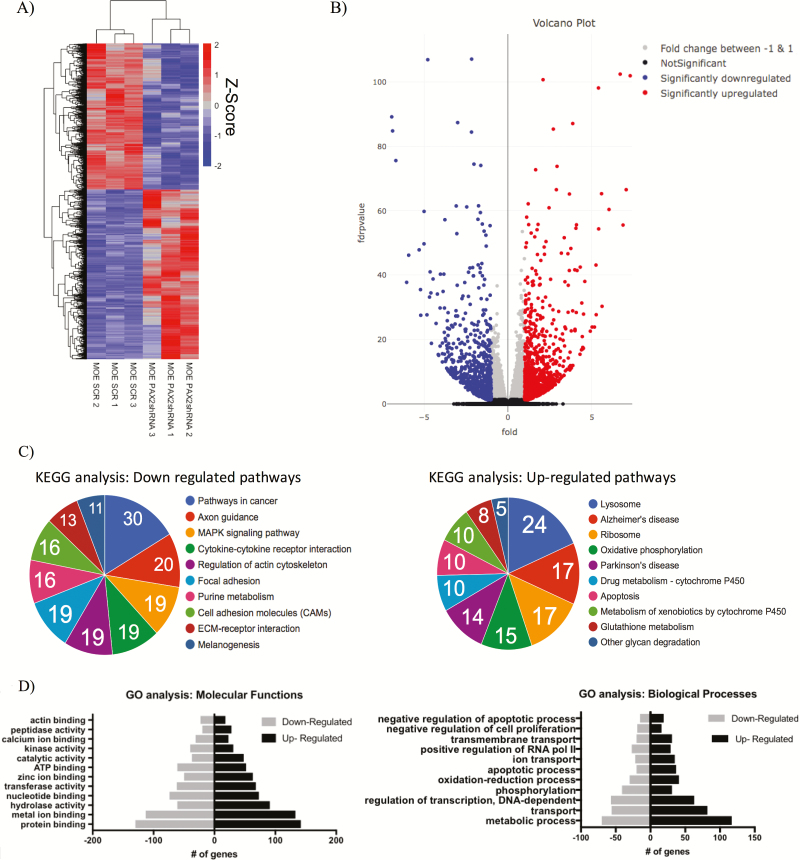
Genome-wide analysis of PAX2-deficient murine oviductal cells revealed a significantly altered transcriptome. (A) Representative heat map comparing RNA-seq data of MOE:PAX2shRNA compared with MOE:SCRshRNA. Plot shows 2469 of the 5567 significantly upregulated or downregulated genes shown (FDR-adjusted P-value <1E-4). (B) Volcano plot representing entire RNA-seq data set. (C) KEGG analysis performed on total RNA-seq highlighting pathways with the most upregulated or downregulated genes. (D) Gene ontology molecular function (left) and biological processes (right) analysis performed on total RNA-seq.

