Abstract
Delays in identifying internal bleeding are life-threatening, thus underscoring the need for rapid and comprehensive coagulation profiling at the bedside. We review a novel optical coagulation profiler that measures several coagulation metrics including prothrombin time (PT), activated clotting time (ACT), clot polymerization rate (a-angle), clot stiffness (MA), fibrinolysis (LY) and platelet function, using a single multifunctional instrument. The optical profiler is based on the principles of Laser Speckle Rheology (LSR) that quantifies tissue viscoelasticity from light scattering patterns called laser speckle. To operate the optical profiler, whole blood (40 ^L) is loaded into a disposable cartridge, laser speckle patterns are recorded via a camera and the viscoelasticity of clotting blood is estimated from speckle intensity fluctuations. By monitoring alterations in viscoelastic moduli over time during clot initiation, thrombin generation, fibrin crosslinking, clot stabilization and fibrinolysis, global coagulation parameters are obtained within 10 minutes using a drop of whole blood. Clinical testing in over 500 patients to date has confirmed the accuracy of the optical profiler for comprehensively assessing coagulation status against conventional coagulation tests and Thromboelastography (TEG). Recent studies have further demonstrated the capability to quantify platelet aggregation induced by adenosine diphosphate (ADP) in a drop of platelet-rich-plasma in the absence of applied shear stress. Together, these studies demonstrate that global coagulation profiling in addition to platelet function may be accomplished using a single multifunctional device. Thus, by enabling rapid and comprehensive coagulation and platelet function profiling at the bedside, the optical profiler will likely advance the capability to identify and manage patients with an elevated risk for hemorrhage.
Keywords: coagulation, laser speckle, point of care, viscoelastic, platelet
Introduction
Impaired blood coagulation or coagulopathy is a frequent cause of hemorrhage following acute trauma and surgery, and the leading cause of in-hospital preventable deaths.1, 2 Multiple factors, including depletion of clotting factors, impaired platelet function and systemic activation of fibrinolytic pathways, contribute to development of coagulopathic bleeding. To ameliorate bleeding, and depending on the type of coagulopathy, treatment may entail transfusing packed red blood cells (pRBCs), fresh frozen plasma (FFP), platelets and/or cryoprecipitate. In an attempt to proactively manage bleeding, liberal (potentially excess) transfusion strategies may be employed in the absence of timely information about the patient’s coagulation state.3, 4 This gives rise to a confounding clinical conundrum. Delayed or inadequate transfusion is life-threatening, whilst overuse of blood products is associated with an increased risk of myocardial infarction, acute lung injury, overall mortality and hospital length-of-stay.5 Together, these factors highlight the imminent need to identify patients at risk of severe in-hospital bleeding, prevent excessive blood loss, and tailor transfusion to ensure safe, rapid and effective hemostasis management.
To identify the underlying cause of bleeding, a battery of conventional coagulation tests (CCT) may be conducted to assess prothrombin and activated partial thromboplastin times (PT, APTT), fibrinolysis, values of fibrinogen and clotting factors, along with platelet function. Unfortunately, given the long reporting time (0.5–4hrs), CCTs are often unsuitable in the context of rapidly changing coagulation conditions, such as in trauma and surgical patients. As a result, transfusion decisions are frequently based on empirical information that does not truly reflect the immediate coagulation state of the patient, thus resulting in delays in transfusion or overuse of blood products, both of which magnify the risk of complications. Studies conducted in cardiac surgical patients indicate that incorporating comprehensive coagulation testing at the bedside achieves a 40% reduction in blood product use, 50% reduction in reoperation rates and lower incidence of organ injury and thromboembolic events after surgery.6, 7 These factors together highlight the need for novel tools to improve hemostasis management during interventional procedures by comprehensively and swiftly evaluating coagulation and platelet profiles at the bedside.
Approaches for point-of-care coagulation testing
Activated clotting time (ACT) is a widely-used point-of-care test for hemostasis management during interventional procedures requiring intensive heparin anticoagulation. Several ACT devices are commercially-available, which utilize celite, glass beads or kaolin-based activators, and detect clot initiation via mechanical, optical or amperometric approaches to deduce clotting time.8, 9 Recent advances in heparin management systems have improved anticoagulation management by facilitating heparin and protamine titration based on individual patient requirements.8 Whole blood tests that measure INR (international normalized ratio, as derived from the PT) have been utilized for monitoring warfarin anticoagulation in home- or out-patient settings, and have been shown to improve adherence to therapy and patient outcomes.10–12 Other approaches currently in development include the use of quartz crystal13–15 , magnetoelastic transducers16–17, MEMS-based devices18 and surface plasmon resonance techniques19, 20 to infer the PT. The above approaches that report clotting time metrics are limited to the clot initiation phase and fail to characterize downstream processes of the hemostatic cascade. Rheology-based technologies may address this critical gap by measuring the temporal evolution of clot viscoelasticity during fibrin polymerization, clot stabilization, platelet-fibrin interaction and fibrinolysis. Thromboelastography (TEG®) and Rotational Thromboelastometry (ROTEM®) have been studied for perioperative coagulation and transfusion management.21, 22 While favorable over CCT’s in terms of reporting time and real-time operation, both TEG® and ROTEM® are contact- based methods that strain the clot beyond the linear viscoelastic regime, delay clot formation and modify the fibrin network structure, which could likely compromise the characterization of mechanically-weaker clots. Moreover, these instruments have bulky moving parts, are complex to operate, require routine calibration and have a high cost per test, factors that likely hinder their widespread clinical utility. Ultrasound-based instruments may be advantageous in this regard as they measure viscoelastic end-points similar to TEG and ROTEM in a non-contact manner without sample manipulation.23 Recent advances for measuring platelet aggregation in whole blood provide the opportunity for identifying impaired platelet function, a risk factor for hemorrhage following major surgery or acute trauma. These systems utilize amperometric or optical approaches to measure a change in resistance (Multiplate analyzer, Roche) or an increase in light transmission (Verify Now, Instrumentation Laboratory), to quantify platelet aggregation. Therefore, results generated by these approaches may be influenced by platelet count and hematocrit levels, thus currently limiting their utility for perioperative interventions.24, 25 Here we review a new laser-based platform for comprehensive profiling of hemostatic function, as developed in the author’s laboratory, that measures ACT, PT, clot rate, clot stiffness, fibrinolysis and platelet aggregation profiles, all using the same instrument via inexpensive disposables.
Analyzer description
The instrument is hand-held, easily portable, and test results are obtained within seconds to minutes using a drop of blood. The laser-based sensor uses a small laser diode to illuminate a blood sample, and a Complementary Metal Oxide Semiconductor (CMOS) camera analyzes laser intensity patterns, called laser speckle, that evolve in time as the sample clots. The sensor is based on a novel laser speckle rheology (LSR) approach that has been recently developed.26–30 Laser speckle31 that results from the interference of laser light scattered from tissue, is exquisitely sensitive to thermal motion of endogenous light scattering particles and is in turn influenced by the viscoelasticity of the medium. The increasing stiffness of blood during formation of a fibrin clot restricts displacements of light scattering particles (such as blood cells, platelets etc), eliciting a slower rate of speckle fluctuations. The viscoelastic modulus of clotting blood can be subsequently realized by measuring the displacements of light scattering blood cells from the time- evolution of intensity fluctuations of speckle patterns.26, 27 Clinical testing in over 500 patients to date have confirmed the accuracy of the LSR approach in assessing PT, ACT, fibrinogen,27, 32, 33 as well global hemostatic metrics of coagulation and fibrinolytic pathways, as reviewed below.32, 34
Principles of coagulation profiling using Laser Speckle Rheology (LSR)
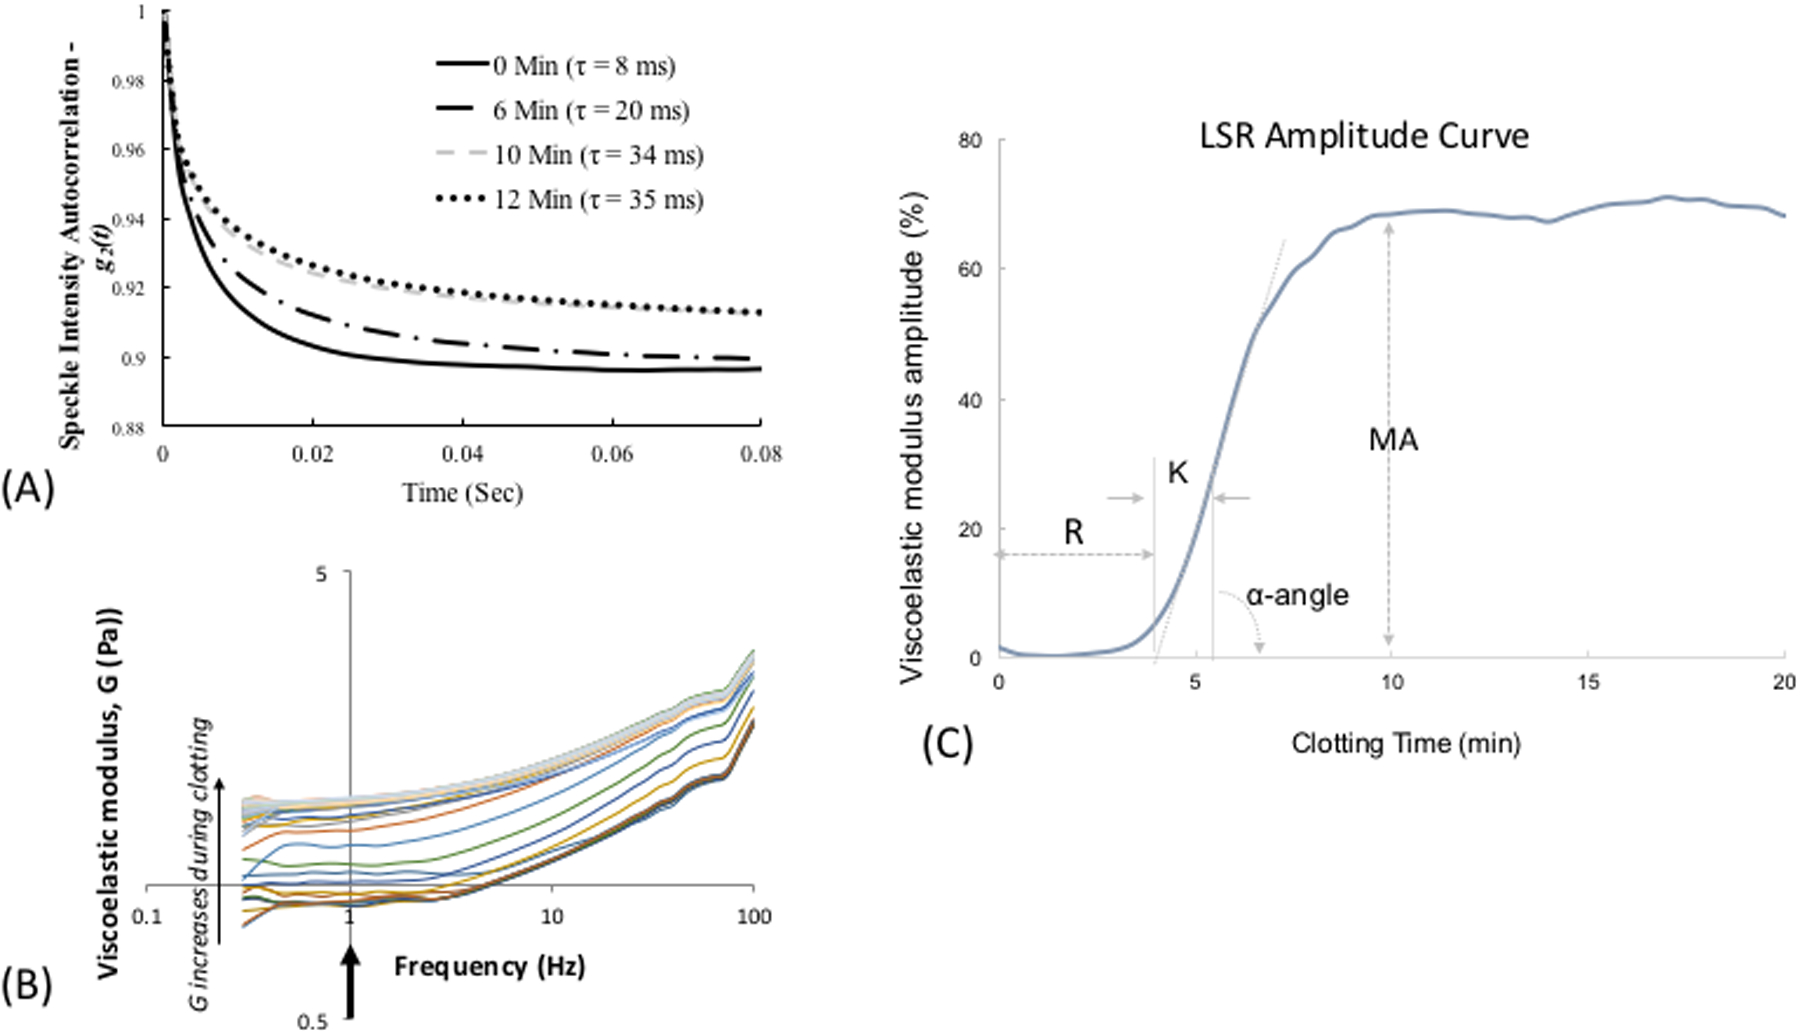
LSR is a new optical approach that measures the material properties of viscoelastic materials such as tissue, without sample contact or manipulation.26–30 The traditional tool for measuring viscoelastic properties is a mechanical rheometer that quantifies the ratio of an applied stress to induced strain in the specimen, over an oscillation frequency (ω) range, to calculate the frequency-dependent viscoelastic modulus, G*(ω). The capability of LSR for measuring this quantity in a non-destructive manner and without sample contact is highly advantageous, particularly in applications where mechanical manipulation may alter the sample properties and when sample volume is low. In LSR, a sample is illuminated by coherent light from a laser and a high-speed CMOS camera captures rapid time-varying fluctuations of speckle patterns reflected from the sample (Figure 1A). Laser speckle is an intensity pattern of bright and dark spots caused by scattering and interference of laser light reflected from a highly scattering sample such as blood (Figure 1B). Cross correlation analysis, performed by comparing the first speckle image with the remainder of the time series, yields the speckle intensity temporal autocorrelation curve g2(t) from which the average movements, Δr2(t), (termed mean square displacement [MSD]) of light scattering particles is retrieved (Figure 1C). For low viscosity materials such as unclotted blood, the thermal Brownian movements of light scattering particles are rapid and the MSD grows quickly with time, eliciting rapid speckle fluctuations. On the other hand, the gradual emergence of a fibrin- platelet clot with increased stiffness during coagulation restrains the Brownian motion of scattering particles, subsequently restricting the growth of the MSD and slowing down speckle fluctuations (Figure 2A). The MSD and the resultant speckle fluctuations are intimately linked with the viscoelasticity of the medium in vicinity of the scattering particles. Therefore, the viscoelastic properties of the sample can be directly estimated via the generalized Stokes-Einstein relation (GSER) that relates the MSD of scattering particles to the viscoelastic modulus (G*(ω)), of the medium (Figure 1C and 2B). The computation is similarly repeated at time intervals of 1s during the entire coagulation process, to provide several G*(ω) that evolve over time and follow the course of fibrin polymerization, stabilization and fibrinolysis (Figure 2B). To permit direct comparison with standard TEG, the quantity G is reported at a single frequency, G*(ω=1Hz). The change in G during clotting is subsequently plotted relative to unclotted whole blood at the zero-time point, to obtain an amplitude curve that describes the time-course of blood coagulation (Figure 2C). The coagulation parameters, reaction time (R), clot formation time (K), rate of clot formation (α), maximum amplitude (MA), and extent of fibrinolysis (%LY), are then directly obtained from G versus time curve (LSR amplitude curve) to assess global hemostatic status. In addition to obtaining a graphical profile (as seen in Figure 2C), the spatio-temporal analysis of speckle intensity fluctuations allows probing spatial variations in the viscoelastic properties of the clotting sample.26 In Figure 2D, the spatial variations in MA are color-coded and displayed for two human blood samples at minutes 0 to 30 after adding kaolin to activate coagulation. Minute incipient clots, ∼100 μm in diameter, are seen at very early times (minute 1) in the normal sample, suggesting that comprehensive coagulation profiling may be achieved rapidly by tracking and monitoring early micro-clot formation. In hypocoagulable specimens, however, the coagulation process is delayed and negligible clot formation is observed even at minute 30. These early microclots, imperceptible to mechanical devices such as TEG or ROTEM, offer a unique portrait to visualize the dynamics of coagulation at the micro-scale and in real-time, while potentially providing additional diagnostic information to assess complex coagulopathies in patients. Recently, a battery-operated LSR sensor has been tested that requires a just a drop of whole blood (40 μL) for comprehensive coagulation profiling (Figure 2E).33 The LSR sensor (dimensions: 5.2”×3.6” ×2.5”) weighs less than 1 lb and can easily be hand-held to permit portability, opening the opportunity for rapid near-patient global coagulation testing.
Figure 1:
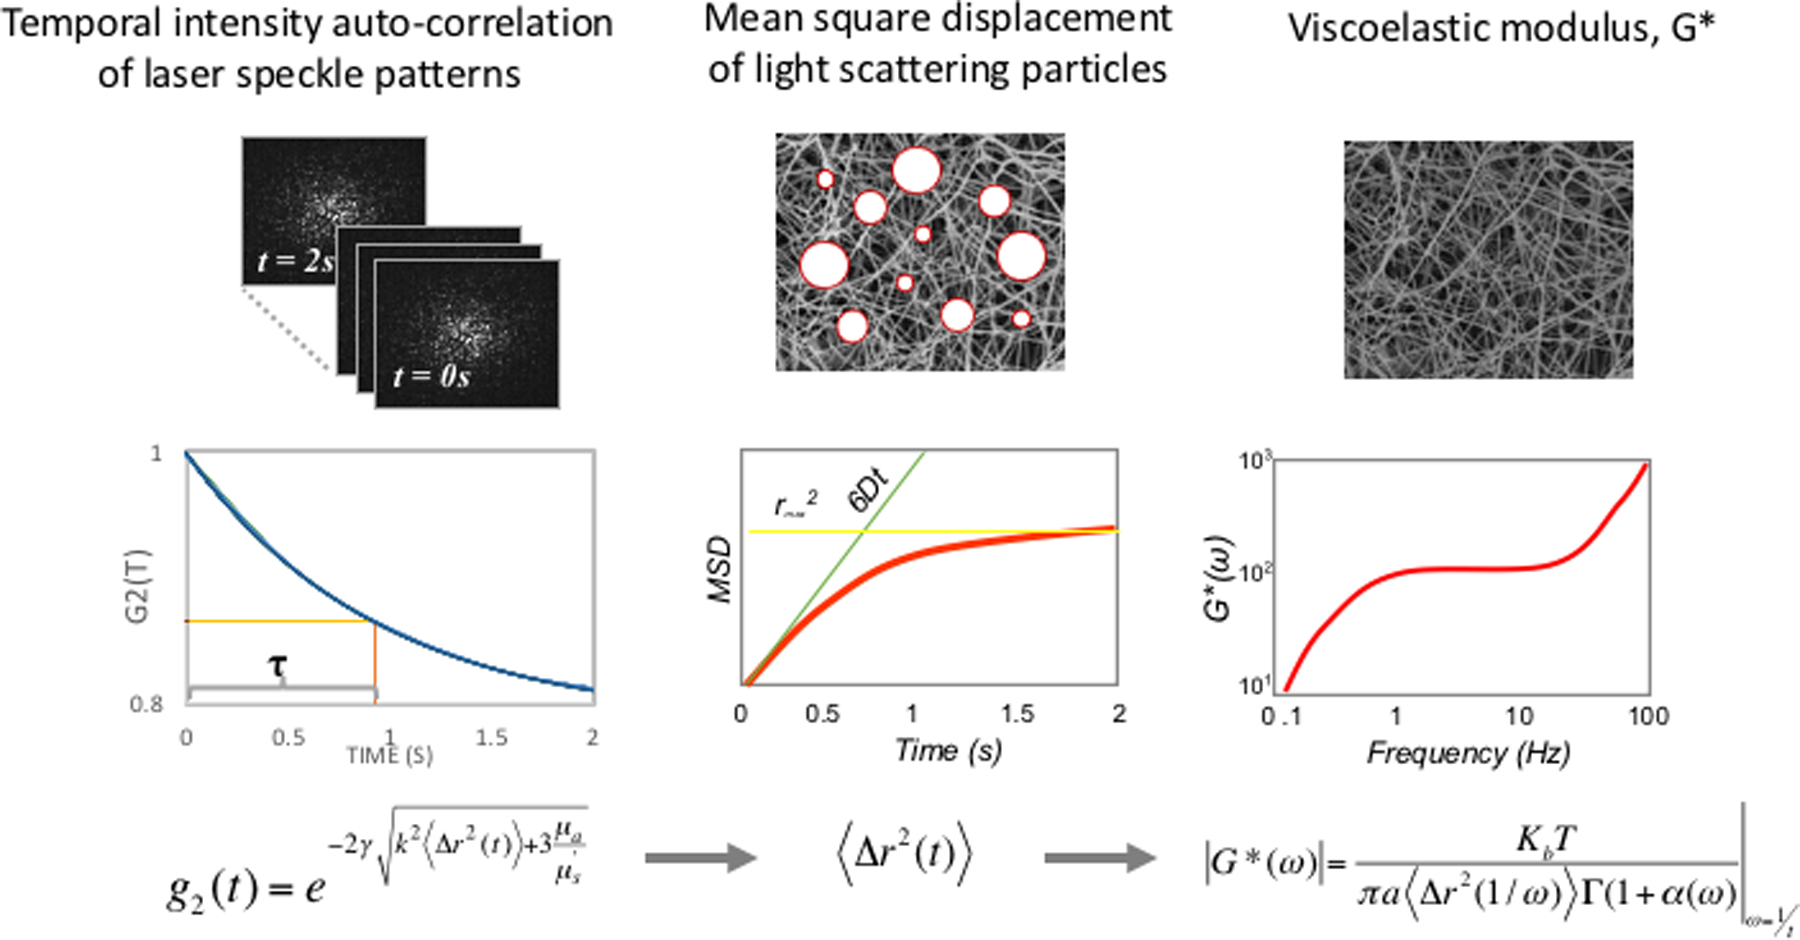
(A) Schematic of the LSR device. (B) Laser speckle pattern reflected from blood at a single time point. (C) Schematic of LSR algorithm used to measure blood viscoelasticity.26 First, the intensity autocorrelation curve is measured from time-varying speckle patterns from which the mean square displacement (MSD) of light scattering blood cells (represented by white circles) is measured. In the final step, the viscoelastic modulus G* is measured from the MSD.
Figure 2:
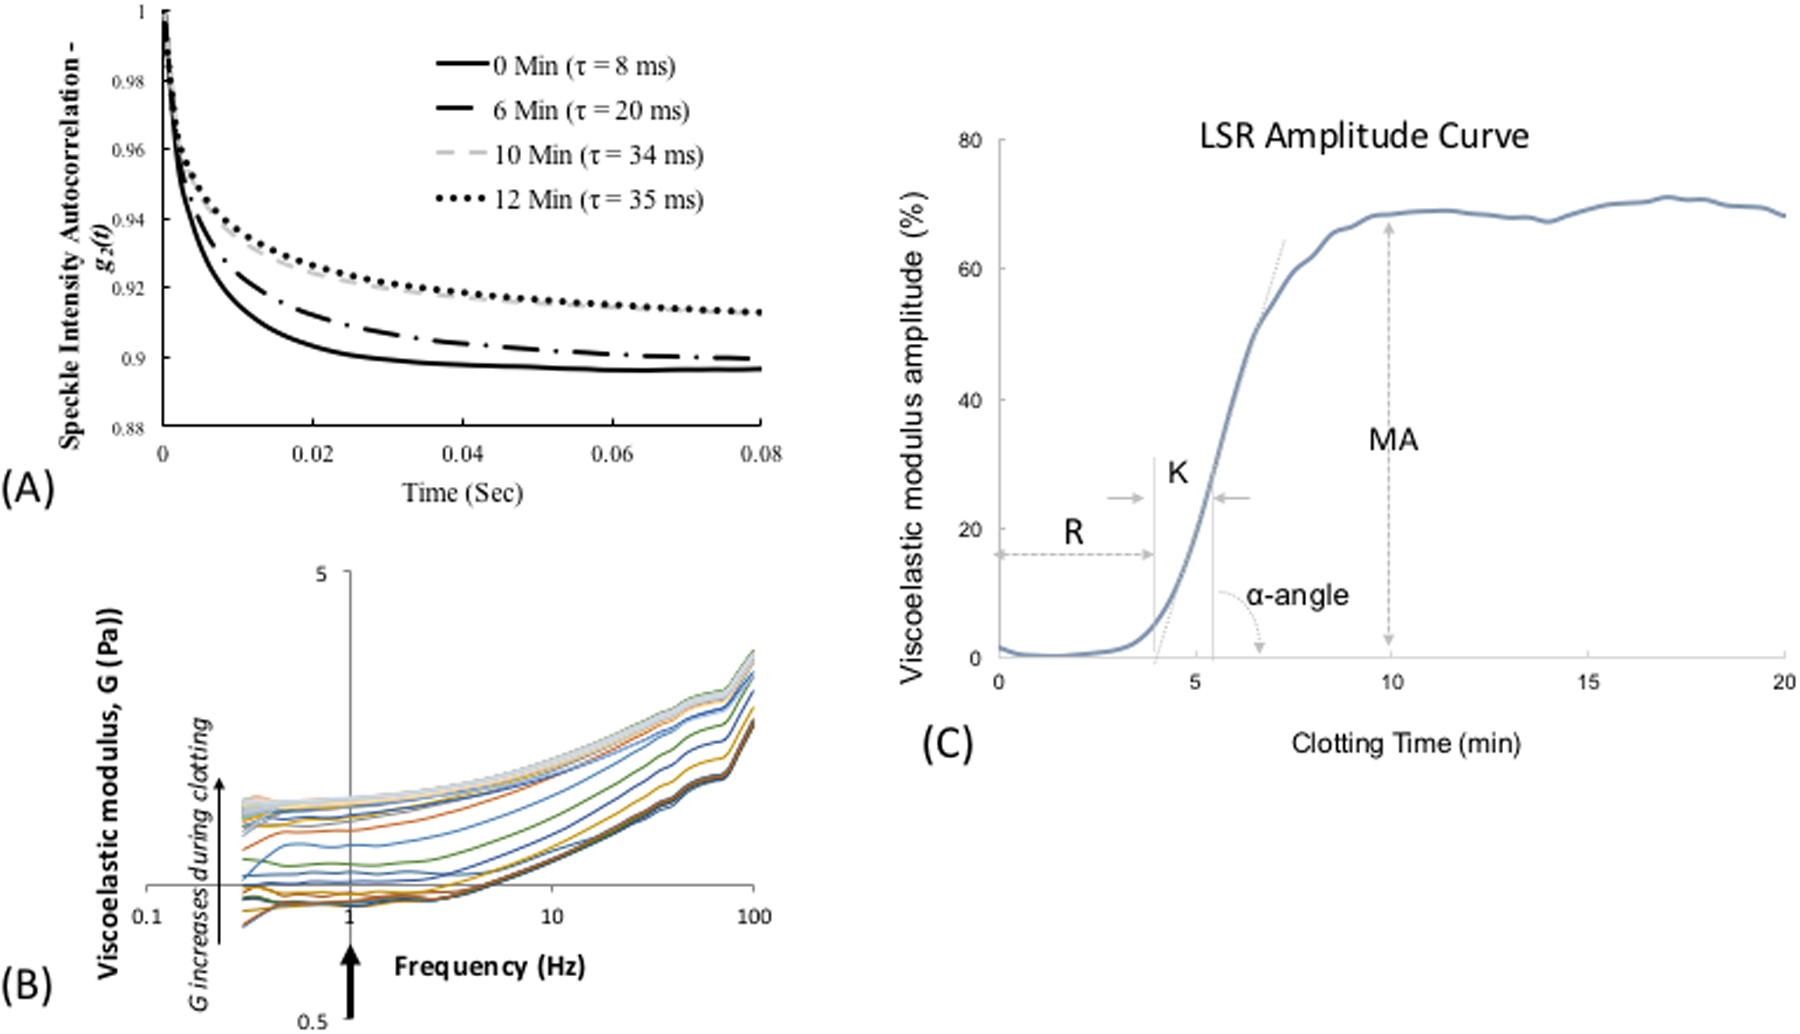
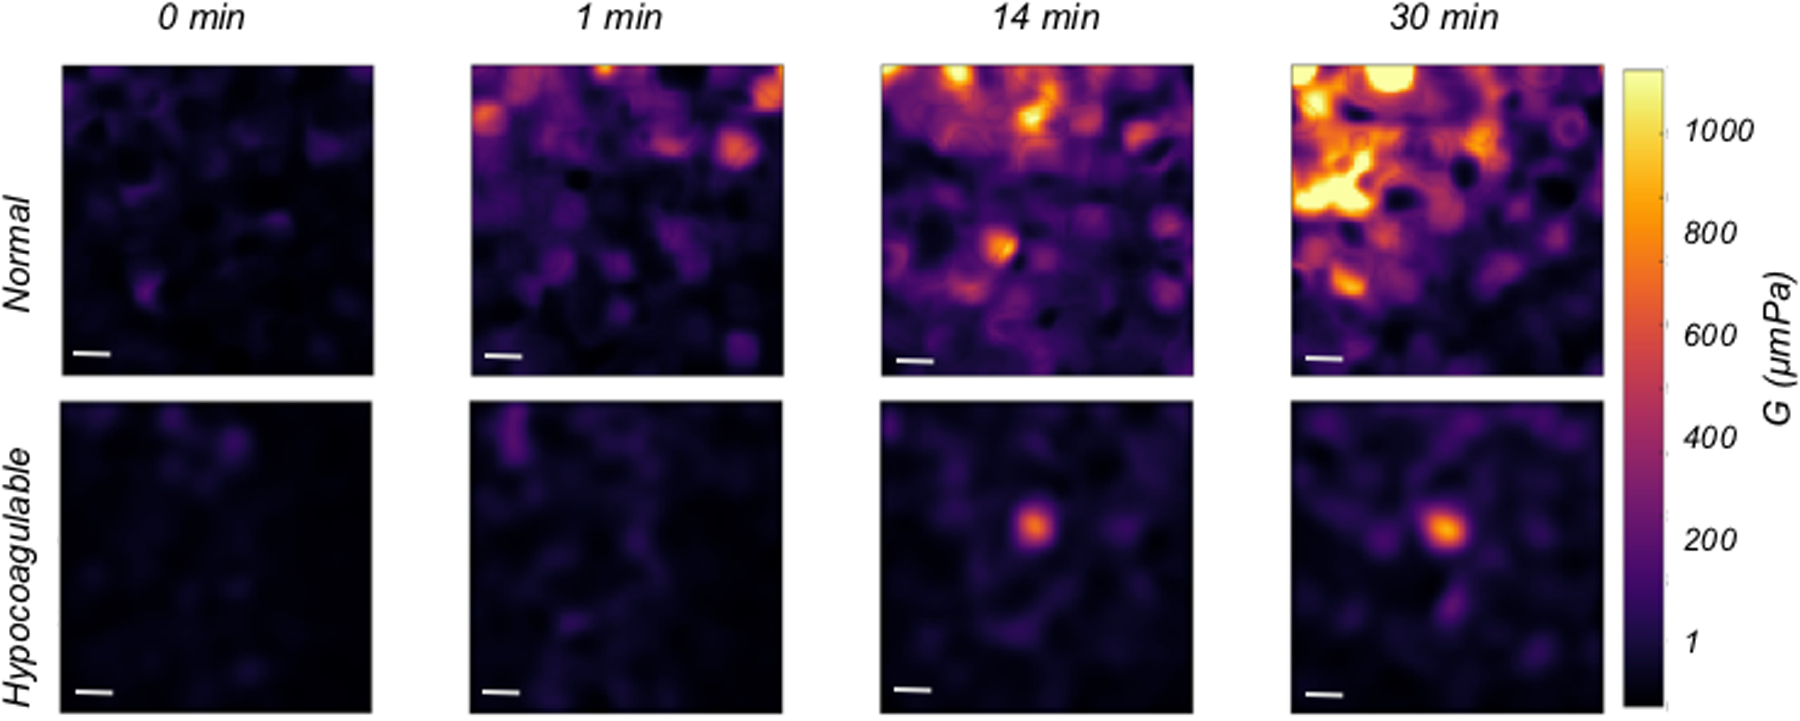
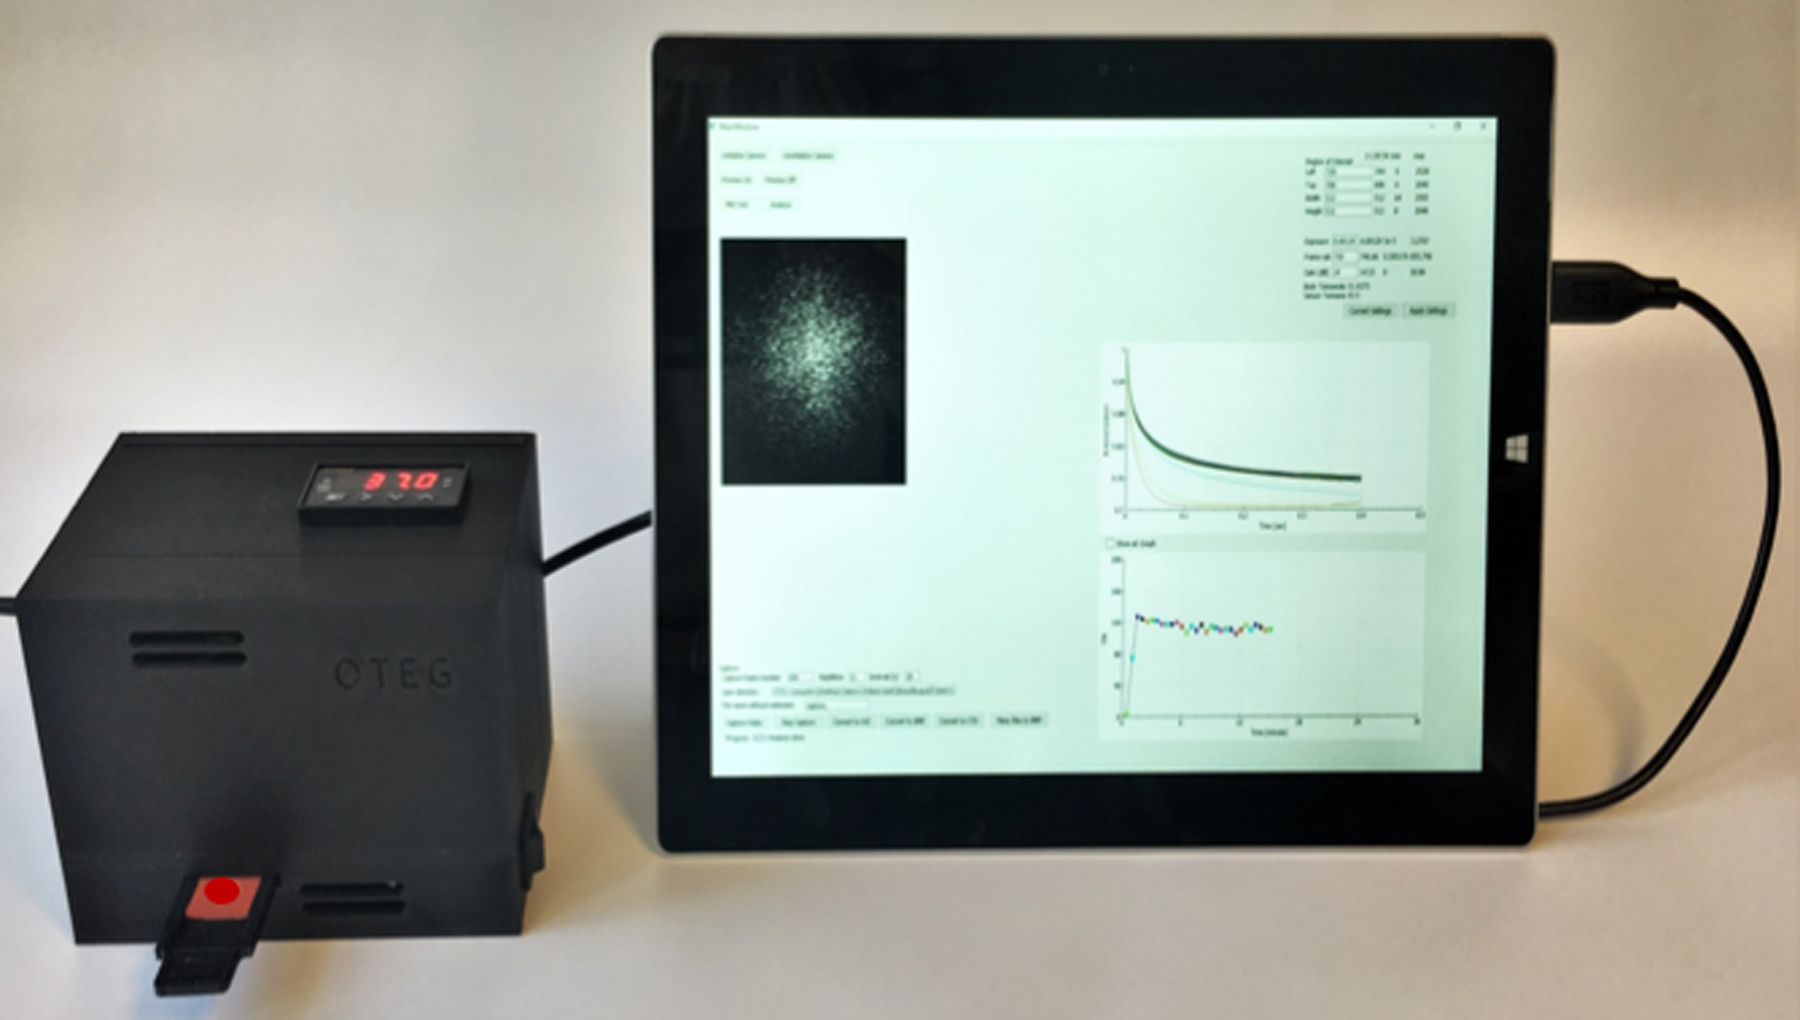
(A) Temporal intensity autocorrelation curves measured from a coagulating blood sample. A deceleration of the curve is observed, also captured by the time scale, t, of speckle fluctuations that increases from 8ms in the unclotted sample to 35 ms in the fully formed clot.27 (adapted from Tripathi et al. Biomed Opt Express27) (B) Frequency-dependent viscoelastic modulus, G*(ro), measured by LSR increases during coagulation. (C) A typical LSR amplitude curve for normal blood, from which parameters, R, K, angle and MA are calculated. (D) Spatial variation in G visualized in a drop of blood showing incipient micro-clots that form early in the coagulation process, the hypocoagulable sample shows negligible clotting.26 Scale bars are 100 |im. (E) Hand-held and battery operated LSR device.33
Estimating Activated Clotting Time (ACT) and Functional Fibrinogen
In a study that included 50 samples from hospitalized patients, LSR measurements of ACT and MA were strongly related with APTT and functional fibrinogen (Figure. 3).27 Coagulation was initiated by kaolin-activation of the intrinsic pathway and the time at which the first-order derivative of the LSR amplitude curve reached a maximum value was recorded to provide the ACT (Figure 3A). The MA was calculated as the average plateau value of the LSR amplitude curve measured over a 5-min duration (Figure 3B). Figure 3A shows representative LSR amplitude curves for two patient blood samples, describing the temporal evolution of the G trace during coagulation for a blood sample with normal APTT (24.9 s) and a sample with elevated APTT (63.5 s). In the blood sample obtained from the normal patient, LSR maintains a constant low amplitude during early coagulation times over 2 minutes, after which a rapid increase in LSR amplitude is observed due to fibrin polymerization and platelet-fibrin interaction within the fibrin network. For the blood sample obtained from the patient with elevated APTT, as expected, the LSR clotting duration is prolonged likely resulting from delayed fibrin polymerization due to low levels of coagulation factors. The LSR curve attains a maximum plateau level at ∼12 min, albeit at a significantly slower rate than the normal sample, indicating a diminished rate of fibrin polymerization. Figure 3B shows the time lapse G-trace from a patient with normal fibrinogen and a patient with elevated fibrinogen level (3.78 and 5.41 g/L respectively). We observe that the MA for the patient with high fibrinogen value was significantly larger in comparison to the normal patient. The maximum value of viscoelastic modulus attained by the clot is dependent on the extent of fibrin network formation and is in turn proportional to the fibrinogen content in blood.35, 36 Therefore, MA measured by LSR varies with fibrinogen values (Figure 3B). Notably, accumulation of platelets may contribute in part to the magnitude of G in the stabilized clot. During blood coagulation, platelets serve as cross-linking sites during formation of the fibrin network and exert contractile forces on the fibrin scaffold that may further stiffen the blood clot.37 As a result, platelet count may also likely to affect MA, which requires further investigation.
Figure 3:
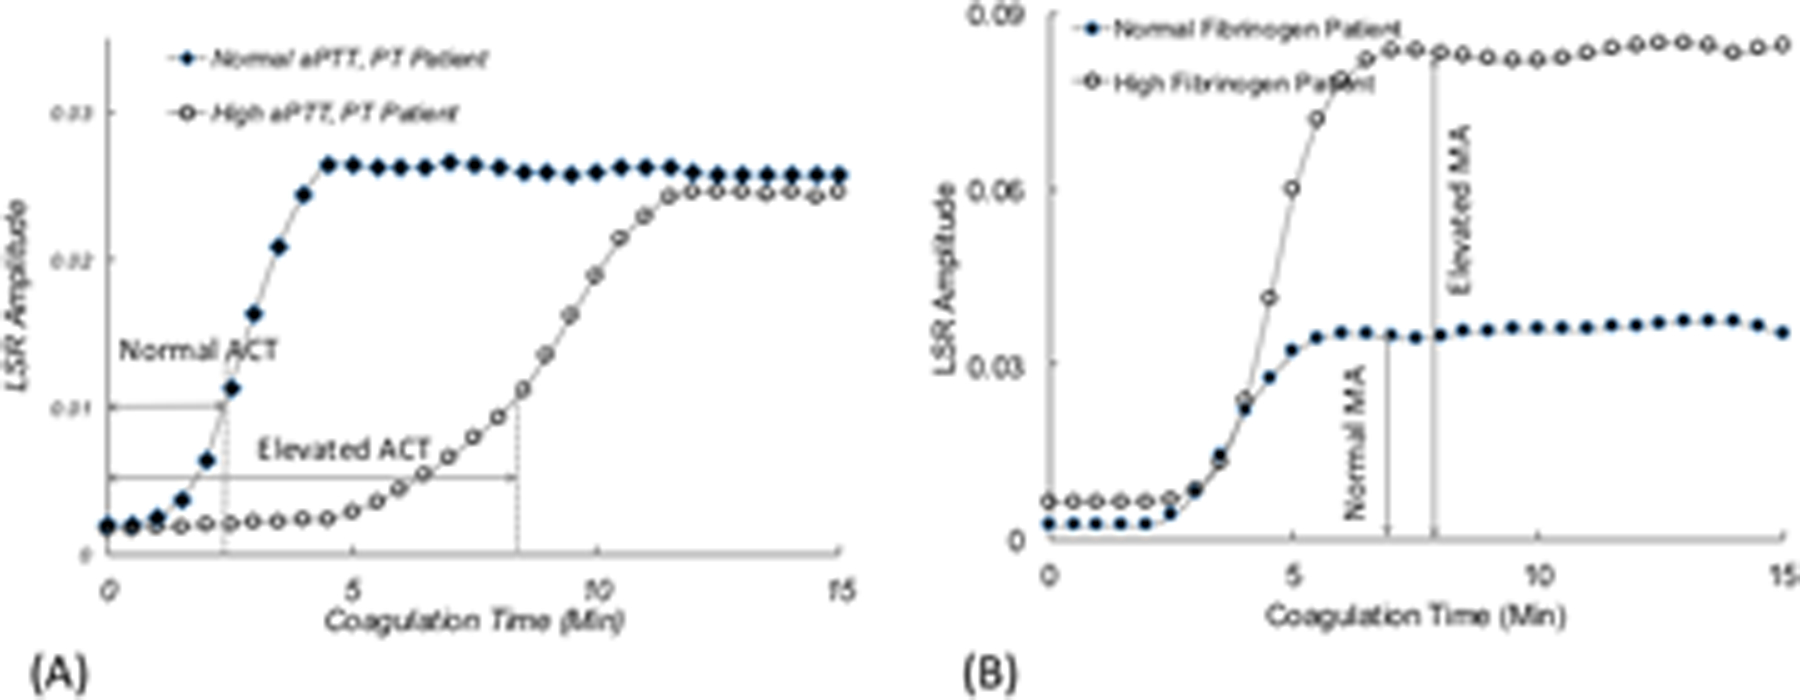
LSR amplitude curves from (A) patient with prolonged APTT, and (B) patient with elevated fibrinogen, compared with normal controls.27 (adapted from Tripathi et al. Biomed Opt Express27)
Hemostatic profiling in anti-coagulated patients using LSR
Oral and injectable anticoagulants are prescribed to prevent and treat clinical conditions such as deep venous thrombosis, pulmonary embolism and stroke.38, 39 Anticoagulation management in these patients is challenging due to narrow therapeutic windows and the need to balance bleeding vs adequate coagulation, influenced by numerous food and drug interactions and inter-individual variability in dose response.40–42 Therefore, patients require frequent laboratory testing of coagulation status, imposing a staggering load on primary care services.43–46 Vitamin K antagonists (VKA) were the only oral anticoagulants available to patients for decades.45, 47 Recently, direct oral anticoagulants (DOACs), including direct thrombin and activated factor X (FXa) inhibitors are being administered, with presumably fewer food and drug interactions compared to VKAs.39, 48–50 It was previously thought that the more predictable pharmacokinetic profile of DOACs would obviate the need for routine coagulation testing.49 However, a few recent studies have shown DOACs may be yet retain a non-negligible risk of gastrointestinal bleeding and all cause bleeding, depending on the DOAC.51, 52 As a result, periodic coagulation testing performed in patients receiving VKAs and also for selected patients receiving DOACs may reduce the risk of acute hemorrhage and potentially ensure therapeutic anticoagulation. Although DOACs can be measured in the laboratory, the optimal tests and therapeutic ranges for the DOACs remain unknown and need further investigation.
Coagulation profiling using the above hand-held LSR sensor (seen in Figure 2E)33 offers unique opportunities for routine or periodic anti-coagulation testing in the primary care or home setting. Currently, the fabrication cost of LSR cartridges is negligible. Thus we estimate that in the future the price per test may likely be considerably less than that of current commercially-available point- of-care approaches. A recent study investigated the capability of LSR to quantify anticoagulation status in response to treatment with four common classes of anticoagulants, including an indirect thrombin inhibitor (heparin), a FXa inhibitor (rivaroxaban), a direct thrombin inhibitor (argatroban) and a VKA (warfarin).32 It is important to note that other DOACs, not currently tested in the study may behave differently and elicit different coagulation metrics as compared to rivaroxaban and argabatron.32 To evaluate the sensitivity to dose-response, whole blood samples from swine were analyzed by LSR following spiking with varying concentrations of heparin (0–0.3 USP), argatroban (1–8.0 μg/ml) and rivaroxaban (0.46–1.0 μg/ml). LSR coagulation parameters including ACT, α-angle and MA were derived and compared with TEG (Figure 4A). For all anticoagulants, ACT was prolonged in a dose-dependent manner and ACT values measured with LSR closely correlated with TEG (r=0.99, p<0.01). LSR angle was unaltered by anticoagulation, whereas TEG angle showed dose-dependent diminution likely due to mechanical disruption of fibrin monomers during fibrin polymerization. In both LSR and TEG, MA was largely unaffected by anticoagulation. The heparin dose used in the above study was slightly lower than the typical therapeutic range in patients. Therefore, additional studies are currently being conducted to investigate dose-dependent anticoagulation with LSR using high heparin concentrations of up to 4 USP (often used in cardiac surgical patients on cardiopulmonary bypass).53 The initial results of these ongoing studies demonstrate a good association of LSR-ACT with ACT values measured by iStat and Hepcon in heparinized patients, confirming the validity of the new laser-based approach.53 LSR has been further tested in patients treated with Warfarin anti-coagulation with an INR range of 1.0–3.6 (Figure 4B).32 In these patients, LSR-ACT significantly correlated with APTT (r = 0.77, p=0.005) and LSR angle and MA parameters demonstrated good correlation with TEG (r=0.61, p= 0.04, vs TEG angle, and r=63, p=0.03 vs TEG MA).
Figure 4:
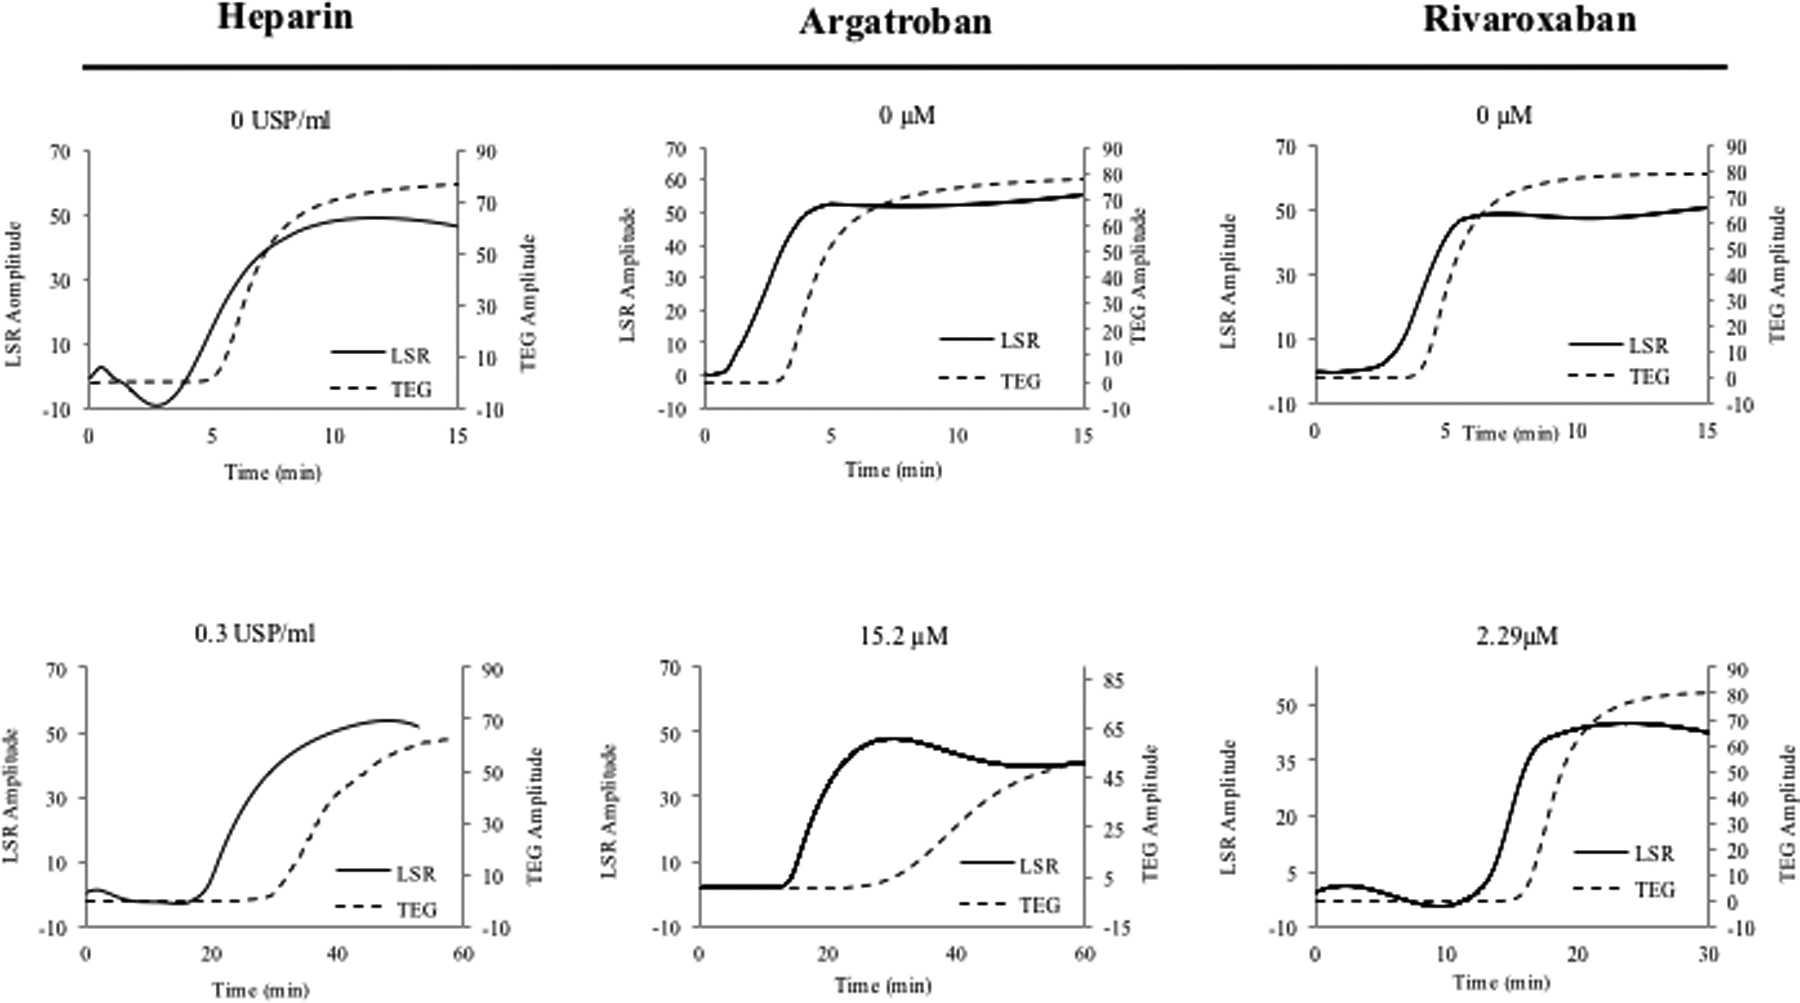
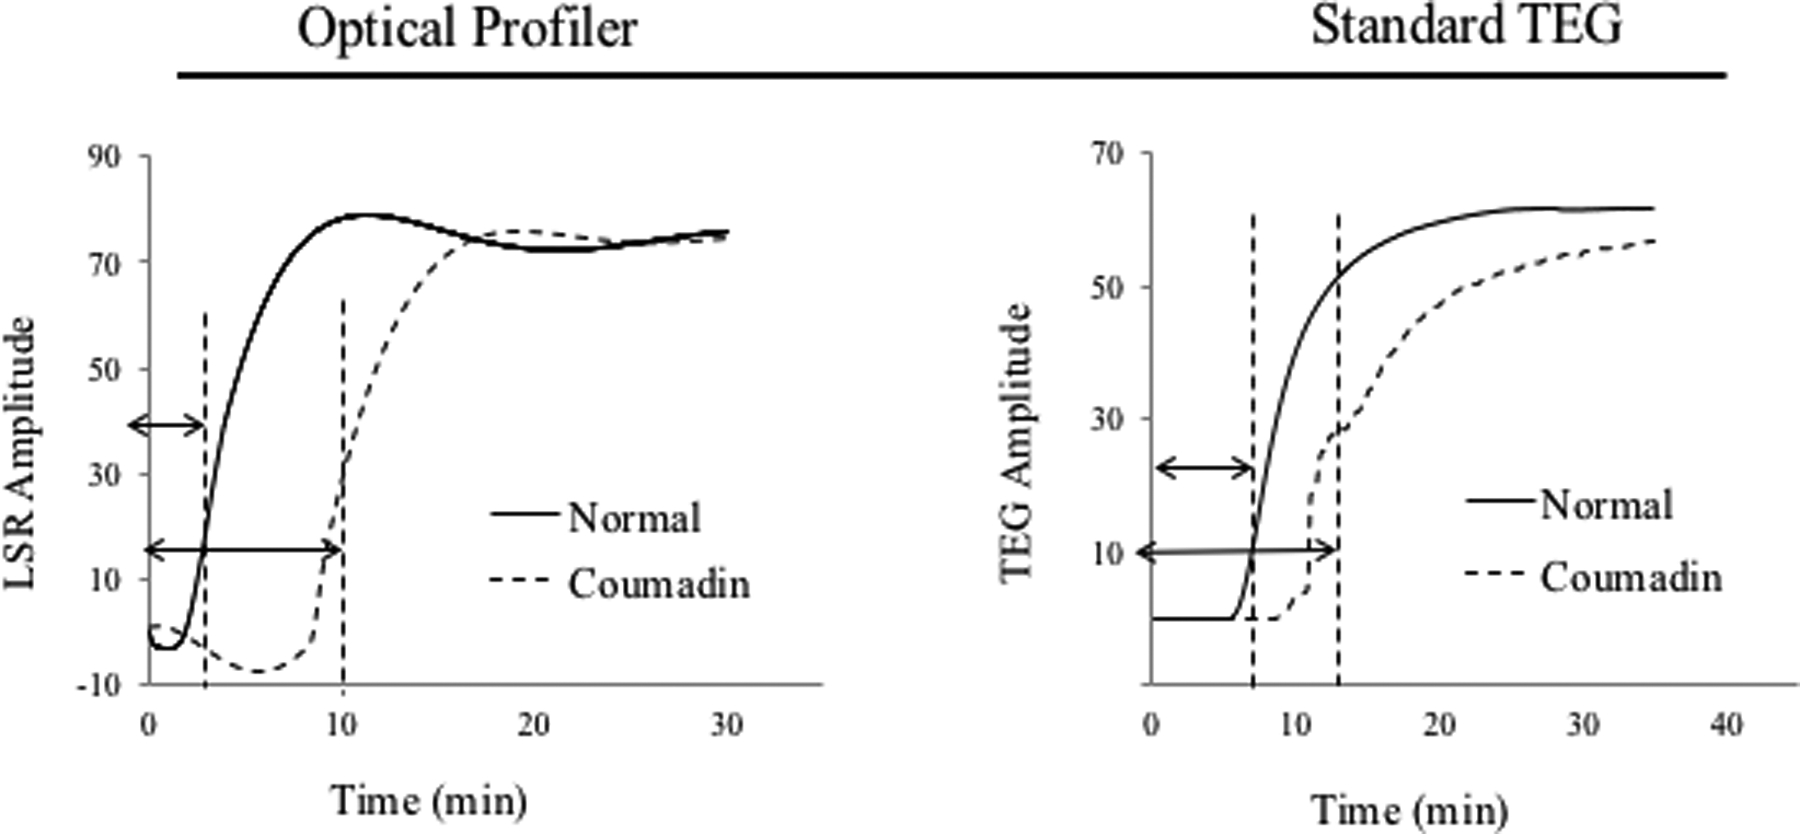
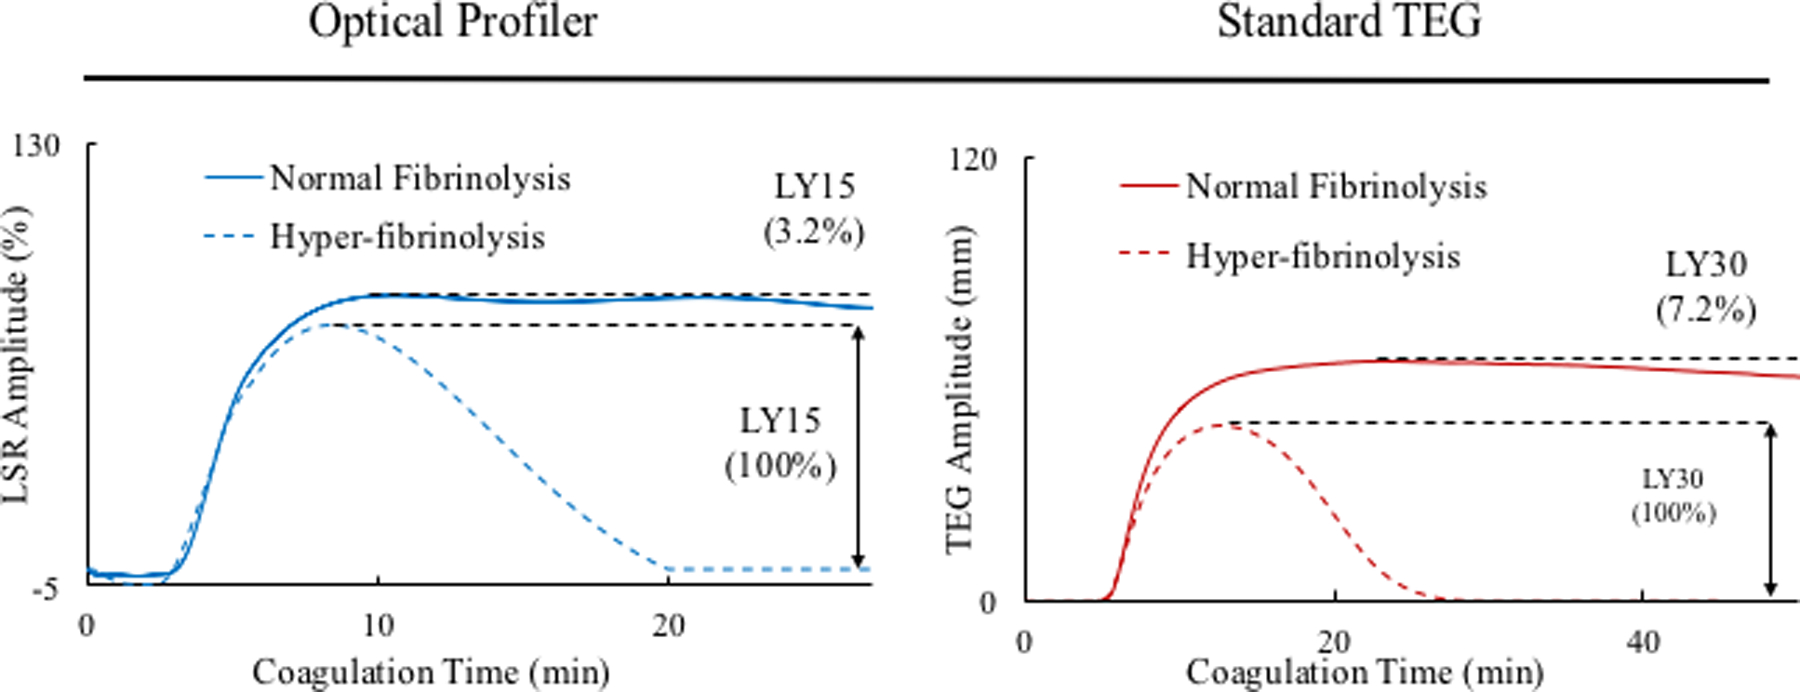
(A) LSR curves obtained from whole blood samples (swine) show prolonged clotting time for all 3 anticoagulant treatments. (Adapted from Tshikudi et al. PLOS one)32 (B) Warfarin- treated patients have increased clotting time measured by LSR. (Adapted from Tshikudi et al. PLOS One)32 (C) Detecting fibrinolysis using LSR: the dotted line shows the sample spiked with tPA compared with the untreated control (solid line). In all cases, LSR is corroborated by standard TEG.
Because APTT(measured above) is not the traditional test used to monitor Warfarin patients, a separate study was performed to evaluate whether LSR accurately probed coagulation status via the extrinsic pathway to accurately assess PT-INR.33 In this case, whole blood samples from 60 warfarin-treated patients (INR range: 0.95–2.71) were measured by LSR and whole blood coagulation was initiated using thromboplastin. The results similarly showed that PT-INR measured by LSR strongly correlated with laboratory values of PT-INR (r = 0.94, p<0.001), with only a negligible measurement bias of 0.3s.33 These observations confirm that the LSR rapidly and accurately measures the response of various anticoagulants with results equivalent to CCTs, standard TEG and other point-of-care assays within seconds to minutes, using just a 40 μL drop of whole blood. Given the small blood volume and potential for push-of-a-button operation, LSR may provide a unique opportunity for patient self-testing via a finger-stick draw.
Assessing fibrinolysis in whole blood
Hyperfibrinolysis may be acquired in patients following major traumatic injury, cardiovascular interventions that include thrombolytic therapy, liver disease or chemotherapy, and is associated with an elevated mortality risk. Early assessment of fibrinolytic activity in these patients can enable timely therapy. A recent study evaluated the sensitivity, precision and accuracy of LSR in quantifying fibrinolysis in human blood following spiking with tissue plasminogen activator (tPA), a protein involved in the breakdown of fibrin via the activation of plasminogen.34 Figure 4C shows LSR amplitude curves measured from a normal control blood sample and a sample spiked with 0.3 μg/mL of tPA. The normal control shows a typical LSR amplitude with a MA that is maintained over 20 minutes, followed by a slight reduction in clot stiffness. In contrast, the tPA-treated sample demonstrates a severe reduction in MA after 10 minutes, caused by complete breakdown of fibrin clot. The standard TEG curves in Figure 4B show similar trends, thus corroborating the LSR findings, and LY% measured in 15 patient samples showed strong correlation with TEG (r=0.94, p<0.01).34
Optical sensing of platelet function
Impairments in platelet function cause excessive bleeding and have severe implications on patients’ survivability following acute trauma, surgery and chronic illness. The standard laboratory test for detecting platelet dysfunction is light transmission aggregometry (LTA), in which platelet aggregation using platelet rich plasma (PRP) is quantified in response to platelet agonists that activate specific receptors on the cell membrane. Unfortunately, LTA takes hours to report results. In addition, due to the requirement for large volumes of blood (1–2 ml per agonist) and access to special coagulation laboratories, platelet function tests are expensive and not suited for high volume testing. Laser Speckle Aggregometry (LSA), complements the LSR approach by offering the additional capability to quantify platelet function within minutes, only using a 40 μL drop of platelet rich plasma (PRP) and inexpensive disposables. In LSA, an anticoagulated PRP drop mixed with a platelet agonist is loaded within the LSR device and laser speckle intensity fluctuations are recorded. Small isolated platelets in PRP elicit large Brownian displacements that result in rapid speckle intensity fluctuations causing a fast decay of the intensity autocorrelation, g2(t). When platelet aggregation is activated via an agonist, large aggregates are formed (Figure 5A, B), slowing down speckle intensity fluctuations and decelerating the resultant g2(t). In a recent report, LSA was used to quantify platelet aggregation following activation of PRP with adenosine diphosphate (ADP).54 Figure 5C depicts the corresponding trace lines of platelet aggregate size measured by LSA. These traces were calculated by first obtaining the diffusion coefficient of platelet aggregates (D) from the linear least square fitting of MSD curves measured at 1s time intervals. Next, D and nominal plasma viscosity are replaced in the standard Stokes Einstein relation (a = (kBT)/6πηD) to yield the absolute aggregate radius (a) for each time point (kB is the Boltzmann constant; T, the absolute temperature in kelvin; η, the viscosity of PRP). As seen in Figure 5C,54 platelet aggregation kinetics changes minimally in the control sample without ADP, indicating the absence of platelet aggregation. Upon addition of 5 μM ADP, a rapid increase in aggregation is observed within minutes. The small dip in aggregation at early times (around minute 1) likely marks the start of the secondary wave of aggregation.55–57 At low ADP concentrations the binding of ADP to P2Y1 receptors leads to mobilization and release of intracellular calcium and induces a shape change in platelets triggering the primary wave of aggregation. The effect of low dose ADP is however reversible and a small reduction in aggregate size may be seen momentarily. This is then followed by the release of ADP from platelet storage granules and its binding to P2Y12 receptors, which induce an upward inflection in the curve, manifesting the secondary and irreversible wave of full platelet aggregation observed in Figure 5C.54 In addition to ADP activation, studies are currently being performed to demonstrate that LSA can accurately quantify platelet aggregation induced by collagen and arachidonic acid. These studies confirm that LSA can detect platelet aggregation induced by ADP, collagen and arachidonic acid even without the application of external shear forces and that intrinsic nanometer-scale thermal displacements of platelets are sufficient for detecting aggregation. Furthermore, LSA may be unaffected by variations in platelet count unlike standard LTA. This is because LSA is based on measuring Brownian displacements of particles and not on the amount of transmitted light as is the case in LTA. As a result, variations in high or low platelet numbers would merely contribute to the overall background signal in LSA and can be easily accounted for by using background subtraction methods. Although, in the above study, LSA was conducted using PRP, we are currently extending this technique for whole blood platelet profiling with promising early results. In the near future, we anticipate that platelet function assessment may be conducted along with comprehensive coagulation testing via the same hand-held, low-cost LSR instrument, rendering multi-functional hemostasis testing highly accessible for use at the bedside.
Figure 5:

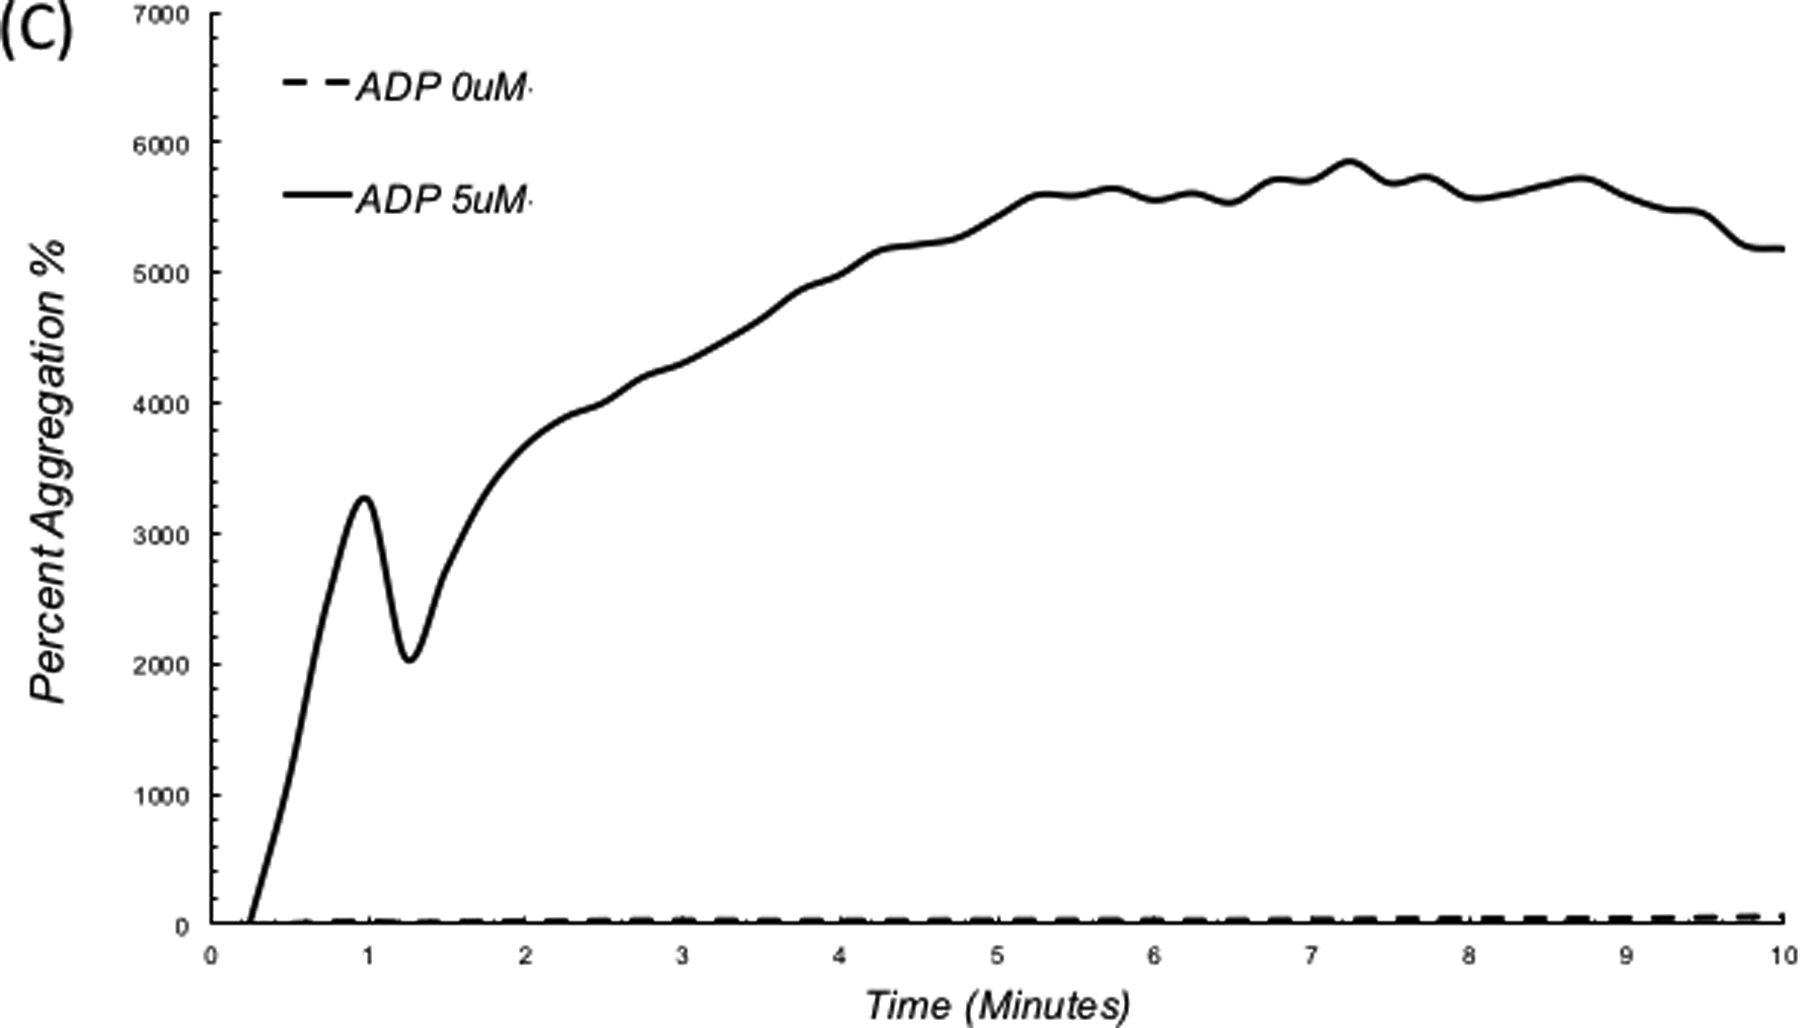
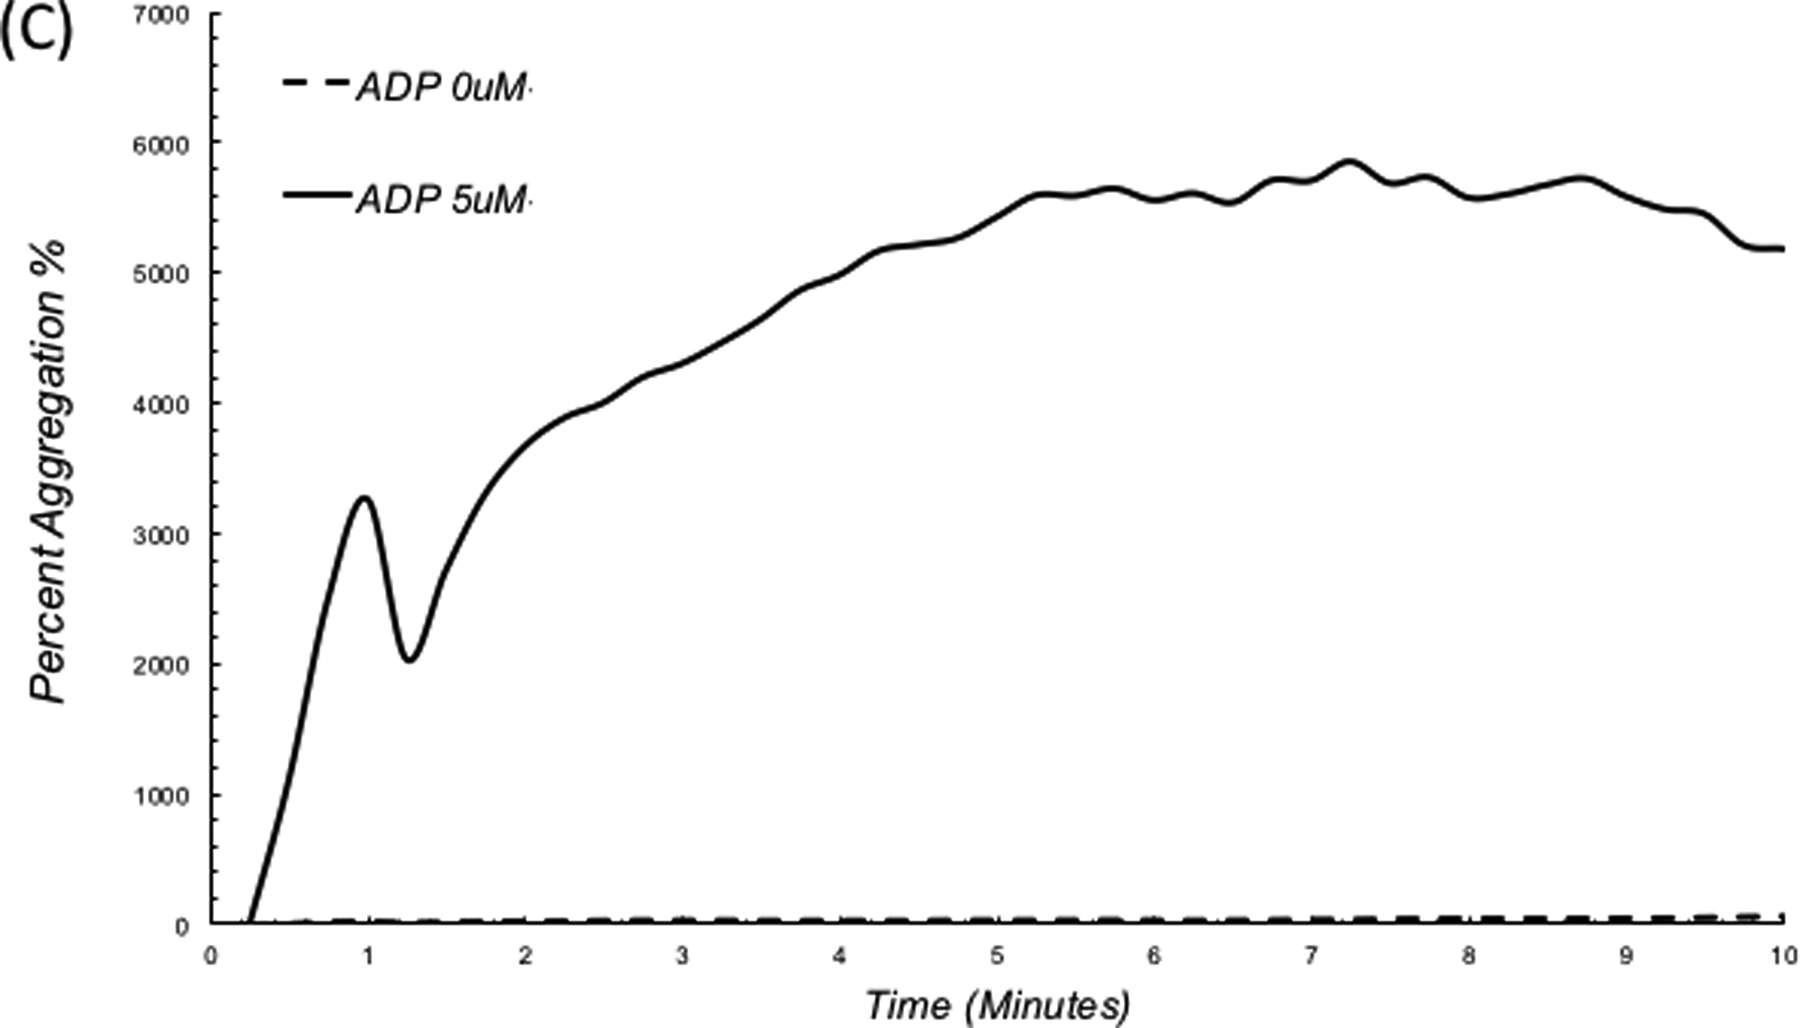
Photographs of PRP with (A) no ADP, (B) platelet aggregation upon addition of 5 μM ADP. (C) LSA measures a substantial increase in platelet aggregate size in the ADP treated sample.54
Summary and Conclusions
LSR provides a new approach for rapidly monitoring the viscoelastic transformation of the coagulation process and providing a direct measure of global hemostatic status, using just a drop of whole blood. Via comparisons with CCTs and standard TEG in over 500 patients to date, a number of recent investigations reviewed above have established the accuracy of the laser approach for measuring clotting time metrics including PT (INR), ACT, fibrinogen27, 32, 33 and for quantifying global metrics of coagulation and fibrinolytic pathways (Figs. 1,2).58, 59 LSR measurements are highly susceptible to minute optical phases shifts caused by sub-wavelength scale thermal displacements that in turn closely follow the alterations in the viscoelastic properties of coagulating blood or the growth of platelet aggregates. Thus, LSR is exquisitely sensitive to small changes in viscoelasticity or platelet aggregation that can be measured without requiring any sample manipulation. The instrument further measures spatial micromechanical changes that occur during the early formations of incipient micro-clots and platelet aggregates,26, 54 thus indicating that comprehensive hemostasis assessment may be achieved within a minute by tracking coagulation profiles from individual micro-clot formations. By avoiding the need for bulky hardware with moving mechanical parts, LSR also benefits from an elegant and straightforward setup that can be operated at the touch of a button. A miniature laser (similar to a common laser pointer) illuminates a blood drop and a small camera sensor records laser speckle fluctuations to measure clot viscoelasticity as it evolves. The LSR setup has recently been miniaturized and embodied as a hand-held, battery-operated device that is insensitive to environmental temperature changes or vibrations.33 The multi-functional capabilities of LSR for rapid coagulation and platelet profiling may hold promise for predicting haemorrhage in surgical, severely injured or anticoagulated patients, thus allowing to tailor transfusion protocols to meet individual patient requirements and monitoring hemostasis during interventions to improve patient outcomes.
Acknowledgements
The author thanks Ms. Diane Tshikudi and Dr. Zeinab Hajjarian for their assistance in preparing the figures, and acknowledges research funding from Air Force Office of Scientific Research (FA9550-13-1-0068) and the National Institute of Health (5R01HL119867, 5R21EB023012-02 and 1R01HL142272-01A1)
Footnotes
Declaration of Interests
The author reports no declaration of interest.
References
- 1.Hoyt DB, Bulger EM, Knudson MM, Morris J, Ierardi R, Sugerman HJ, Shackford SR, Landercasper J, Winchell RJ, Jurkovich G and et al. Death in the operating room: an analysis of a multi-center experience. The Journal of trauma. 1994;37:426–32. [PubMed] [Google Scholar]
- 2.Devine EB, Chan LN, Babigumira J, Kao H, Drysdale T, Reilly D and Sullivan S. Postoperative acquired coagulopathy: a pilot study to determine the impact on clinical and economic outcomes. Pharmacotherapy. 2010;30:994–1003. [DOI] [PubMed] [Google Scholar]
- 3.Fominskiy E, Putzu A, Monaco F, Scandroglio AM, Karaskov A, Galas FR, Hajjar LA, Zangrillo A and Landoni G. Liberal transfusion strategy improves survival in perioperative but not in critically ill patients: a meta analysis of randomized trials. British journal of anaesthesia. 2015;115:511–519. [DOI] [PubMed] [Google Scholar]
- 4.Mirski MA, Frank SM, Kor DJ, Vincent JL and Holmes DR. Restrictive and liberal transfusion strategies in adult patients: reconciling clinical data with best practice. Critical care (London, England). 2015;19:202–213. [DOI] [PMC free article] [PubMed] [Google Scholar]
- 5.DeSantis SM, Toole JM, Kratz JM, Uber WE, Wheat MJ, Stroud MR, Ikonomidis JS and Spinale FG. Early postoperative outcomes and blood product utilization in adult cardiac surgery: the post-aprotinin era. Circulation. 2011;124:S62–9. [DOI] [PMC free article] [PubMed] [Google Scholar]
- 6.Smith D, Grossi EA, Balsam LB, Ursomanno P, Rabinovich A, Galloway AC and DeAnda A Jr. The Impact of a Blood Conservation Program in Complex Aortic Surgery. Aorta (Stamford, Conn). 2013;1:219–26. [DOI] [PMC free article] [PubMed] [Google Scholar]
- 7.Spahn DR, Shander A and Hofmann A. The chiasm: transfusion practice versus patient blood management. BestPractRes Clin Anaesthesiol. 2013;27:37–42. [DOI] [PubMed] [Google Scholar]
- 8.Nicolau-Raducu R, Occhipinti E, Marshall T, Koveleskie J, Ganier D, Evans B, Daly W, Fish B, Cohen AJ, Reichman TW, Bruce D, Bohorquez H, Seal J, Ahmed E, Carmody I, Loss G, Rayburn J and Nossaman B. Thromboprophylaxis With Heparin During Orthotopic Liver Transplantation: Comparison of Hepcon HMS Plus and Anti-Xa Assays for Low-Range Heparin. Journal of cardiothoracic and vascular anesthesia. 2017;31:575–581. [DOI] [PubMed] [Google Scholar]
- 9.Connelly NR, Magee M and Kiessling B. The use of the iSTAT portable analyzer in patients undergoing cardiopulmonary bypass. J Clin Monit. 1996;12:311–5. [DOI] [PubMed] [Google Scholar]
- 10.Braun SL. CoaguChek point-of-care testing prothrombin time monitors. Am J Clin Pathol. 2007;128:671–2; author reply 672. [PubMed] [Google Scholar]
- 11.Pena JA, Lewandrowski KB, Lewandrowski EL, Gregory K, Baron JM and Van Cott EM. Evaluation of the i-STAT point-of-care capillary whole blood prothrombin time and international normalized ratio: comparison to the Tcoag MDAII coagulation analyzer in the central laboratory. Clin Chim Acta. 2012;413:955–9. [DOI] [PubMed] [Google Scholar]
- 12.Toulon P, Ozier Y, Ankri A, Fleron MH, Leroux G and Samama CM. Point-of-care versus central laboratory coagulation testing during haemorrhagic surgery. A multicenter study. Thromb Haemost. 2009;101:394–401. [PubMed] [Google Scholar]
- 13.Cheng TJ, Chang HC and Lin TM. A piezoelectric quartz crystal sensor for the determination of coagulation time in plasma and whole blood. Biosens Bioelectron. 1998; 13:147–56. [DOI] [PubMed] [Google Scholar]
- 14.Muller L, Sinn S, Drechsel H, Ziegler C, Wendel HP, Northoff H and Gehring FK. Investigation of prothrombin time in human whole-blood samples with a quartz crystal biosensor. Anal Chem. 2010;82:658–63. [DOI] [PubMed] [Google Scholar]
- 15.Muramatsu H, Kimura K, Ataka T, Homma R, Miura Y and Karube I. A quartz crystal viscosity sensor for monitoring coagulation reaction and its application to a multichannel coagulation detector. Biosens Bioelectron. 1991;6:353–8. [DOI] [PubMed] [Google Scholar]
- 16.Puckett LG, Barrett G, Kouzoudis D, Grimes C and Bachas LG. Monitoring blood coagulation with magnetoelastic sensors. Biosens Bioelectron. 2003;18:675–81. [DOI] [PubMed] [Google Scholar]
- 17.Puckett LG, Lewis JK, Urbas A, Cui X, Gao D and Bachas LG. Magnetoelastic transducers for monitoring coagulation, clot inhibition, and fibrinolysis. Biosens Bioelectron. 2005;20:1737–43. [DOI] [PubMed] [Google Scholar]
- 18.Cakmak O, Ermek E, Kilinc N, Bulut S, Baris I, Kavakli IH, Yaralioglu GG and Urey H. A cartridge based sensor array platform for multiple coagulation measurements from plasma. Lab Chip. 2015;7:113–20. [DOI] [PubMed] [Google Scholar]
- 19.Hansson KM, Johansen K, Wettero J, Klenkar G, Benesch J, Lundstrom I, Lindahl TL and Tengvall P. Surface plasmon resonance detection of blood coagulation and platelet adhesion under venous and arterial shear conditions. Biosens Bioelectron. 2007;23:261–8. [DOI] [PubMed] [Google Scholar]
- 20.Vikinge TP, Hansson KM, Sandstrom P, Liedberg B, Lindahl TL, Lundstrom I, Tengvall P and Hook F. Comparison of surface plasmon resonance and quartz crystal microbalance in the study of whole blood and plasma coagulation. Biosens Bioelectron. 2000;15:605–13. [DOI] [PubMed] [Google Scholar]
- 21.Whiting D and Dinardo JA. TEG and ROTEM: Technology and clinical applications. Am JHematol. 2014;89:228–232. [DOI] [PubMed] [Google Scholar]
- 22.Evans PA, Hawkins K, Lawrence M, Williams RL, Barrow MS, Thirumalai N and Williams PR. Rheometry and associated techniques for blood coagulation studies. Med Eng Phys. 2008;30:671–9. [DOI] [PubMed] [Google Scholar]
- 23.Bischof DB, Ganter MT, Shore-Lesserson L, Hartnack S, Klaghofer R, Graves K, Genoni M and Hofer CK. Viscoelastic blood coagulation measurement with Sonoclot predicts postoperative bleeding in cardiac surgery after heparin reversal. Journal of cardiothoracic and vascular anesthesia. 2015;29:715–22. [DOI] [PubMed] [Google Scholar]
- 24.Hanke AA, Roberg K, Monaca E, Sellmann T, Weber CF, Rahe-Meyer N and Gorlinger K. Impact of platelet count on results obtained from multiple electrode platelet aggregometry (Multiplate). Eur J Med Res. 2010;15:214–9. [DOI] [PMC free article] [PubMed] [Google Scholar]
- 25.Kakouros N, Kickler TS, Laws KM and Rade JJ. Hematocrit alters VerifyNow P2Y12 assay results independently of intrinsic platelet reactivity and clopidogrel responsiveness. J Thromb Haemost. 2013;11:1814–22. [DOI] [PubMed] [Google Scholar]
- 26.Hajjarian Z, Tripathi MM and Nadkarni SK. Optical Thromboelastography to evaluate whole blood coagulation. J Biophotonics. 2015;8:372–81. [DOI] [PMC free article] [PubMed] [Google Scholar]
- 27.Tripathi MM, Hajjarian Z, Van Cott EM and Nadkarni SK. Assessing blood coagulation status with laser speckle rheology. Biomed Opt Express. 2014;5:817–31. [DOI] [PMC free article] [PubMed] [Google Scholar]
- 28.Hajjarian Z and Nadkarni SK. Evaluating the viscoelastic properties of tissue from laser speckle fluctuations. Sci Rep. 2012;2:316. [DOI] [PMC free article] [PubMed] [Google Scholar]
- 29.Hajjarian Z, Nia HT, Ahn S, Grodzinsky AJ, Jain RK and Nadkarni SK. Laser Speckle Rheology for evaluating the viscoelastic properties of hydrogel scaffolds. Sci Rep. 2016;6:37949. [DOI] [PMC free article] [PubMed] [Google Scholar]
- 30.Hajjarian Z and Nadkarni SK. Evaluation and correction for optical scattering variations in laser speckle rheology of biological fluids. PLoS One. 2013;8:e65014. [DOI] [PMC free article] [PubMed] [Google Scholar]
- 31.Goodman JW. Statistical Optics: Wiley Interscience; 2000: 347–356. [Google Scholar]
- 32.Tshikudi D, Tripathi M, Hajjarian Z, Van Cott EM and Nadkarni SK. Optical sensing of anticoagulation status: Towards point-of-care coagulation testing. PLoS One. 2017;3:e0182491. [DOI] [PMC free article] [PubMed] [Google Scholar]
- 33.Tripathi M, Egawa S, Wirth A, Tshikudi D, Van Cott EM and Nadkarni SK. Clinical evaluation of whole blood prothrombin time (PT) and international normalized ratio (INR) using a Laser Speckle Rheology sensor. Sci Rep. 2017;7:9169. [DOI] [PMC free article] [PubMed] [Google Scholar]
- 34.Tripathi M, Tshikudi D and Nadkarni SK. Optical detection of hyperfibrinolysis in patients. Military Health Systems Research Symposium (MHSRS 2016). 2016. [Google Scholar]
- 35.Weisel JW. The mechanical properties of fibrin for basic scientists and clinicians. Biophys Chem. 2004;112:267–76. [DOI] [PubMed] [Google Scholar]
- 36.Kaibara M Rheology of blood coagulation. Biorheology. 1996;33:101–17. [DOI] [PubMed] [Google Scholar]
- 37.Niewiarowski S, Regoeczi E, Stewart GJ, Senyl AF and Mustard JF. Platelet interaction with polymerizing fibrin. J Clin Invest. 1972;51:685–99. [DOI] [PMC free article] [PubMed] [Google Scholar]
- 38.Pengo V Management of oral anticoagulant treatment in patients with venous thromboembolism. Semin Thromb Hemost. 2006;32:781–6. [DOI] [PubMed] [Google Scholar]
- 39.Ahrens I, Lip GY and Peter K. New oral anticoagulant drugs in cardiovascular disease. Thromb Haemost. 2010;104:49–60. [DOI] [PubMed] [Google Scholar]
- 40.Trzeciak P, Zembala M and Polonski L. Major hemorrhagic and thromboembolic complications in patients with mechanical heart valves receiving oral anticoagulant therapy. The heart surgery forum. 2010;13:E80–5. [DOI] [PubMed] [Google Scholar]
- 41.Fernlof G, Sjostrom BM, Lindell KM and Wall UE. Management of major bleedings during anticoagulant treatment with the oral direct thrombin inhibitor ximelagatran or warfarin. Blood coagulation & fibrinolysis : an international journal in haemostasis and thrombosis. 2009;20:667–74. [DOI] [PubMed] [Google Scholar]
- 42.Choi S and Douketis JD. Management of patients who are receiving warfarin or a new oral anticoagulant and require urgent or emergency surgery. Pol Arch Med Wewn. 2012;122:437–42. [PubMed] [Google Scholar]
- 43.Nilsson GH and Bjorholt I. Occurrence and quality of anticoagulant treatment of chronic atrial fibrillation in primary health care in Sweden: a retrospective study on electronic patient records. BMC clinical pharmacology. 2004;4:1. [DOI] [PMC free article] [PubMed] [Google Scholar]
- 44.Kirley K, Qato DM, Kornfield R, Stafford RS and Alexander GC. National trends in oral anticoagulant use in the United States, 2007 to 2011. Circulation Cardiovascular quality and outcomes. 2012;5:615–21. [DOI] [PMC free article] [PubMed] [Google Scholar]
- 45.Garcia DA and Schwartz MJ. Warfarin therapy: tips and tools for better control. The Journal of family practice. 2011;60:70–5. [PubMed] [Google Scholar]
- 46.Saltiel M Introduction: anticoagulation--dosing, monitoring, and ADRs. Journal of pharmacy practice. 2010;23:193. [DOI] [PubMed] [Google Scholar]
- 47.Vogel E Anticoagulation with warfarin. A review of monitoring issues. Adv Nurse Pract. 2001;9:75–8, 81, 94. [PubMed] [Google Scholar]
- 48.Ambrosi P, Kreitmann B, Cohen W, Habib G and Morange P. Anticoagulation with a new oral anticoagulant in heart transplant recipients. Int JCardiol. 2013;168:4452–3. [DOI] [PubMed] [Google Scholar]
- 49.Baglin T Clinical use of new oral anticoagulant drugs: dabigatran and rivaroxaban. Br J Haematol. 2013;163:160–7. [DOI] [PubMed] [Google Scholar]
- 50.Cossu AP. New oral anticoagulant drugs in the prevention of venous thromboembolism in orthopedic surgery: what implications for neuraxial anesthesia? MinervaAnestesiol. 2013;79:703–4. [PubMed] [Google Scholar]
- 51.Levy JH and Levi M. New oral anticoagulant-induced bleeding: clinical presentation and management. Clin Lab Med. 2014;34:575–86. [DOI] [PubMed] [Google Scholar]
- 52.Lee SH, Lee SM, Kim CS, Cho HS, Kim GS, Gwak MS, Chang CH and Sung K. Use of fibrin-based thromboelastometry for cryoprecipitate transfusion in cardiac surgery involving deep hypothermic circulatory arrest during cardiopulmonary bypass. Blood coagulation & fibrinolysis : an international journal in haemostasis and thrombosis. 2010;21:687–91. [DOI] [PubMed] [Google Scholar]
- 53.Tshikudi D, Wirth A and Nadkarni SK. Monitoring anticoagulation and hemostasis in cardiac surgical patients with a drop of whole blood at the point-of-care using a portable optical sensor. Thrombosis Society of North America (THSNA). 2018. [Google Scholar]
- 54.Hajjarian Z, Tshikudi D and Nadkarni SK. Evaluating platelet aggregation dynamics from laser speckle fluctuations. Biomed Opt Express. 2017;30:3502–3515. [DOI] [PMC free article] [PubMed] [Google Scholar]
- 55.Zhou L and Schmaier AH. Platelet Aggregation Testing in Platelet-Rich Plasma. American Journal of Clinical Pathology. 2005; 123:172–183. [DOI] [PubMed] [Google Scholar]
- 56.Born GVR. Aggregation of Blood Platelets by Adenosine Diphosphate and Its Reversal. Nature. 1962;194:927–929. [DOI] [PubMed] [Google Scholar]
- 57.O’Brien JR. The adhesiveness of native platelets and its prevention. J Clin Pathol. 1961;14:140–149. [DOI] [PMC free article] [PubMed] [Google Scholar]
- 58.Tripathi M, Tshikudi D, Hajjarian Z, Van Cott EM and Nadkarni SK. Optical Thromboelastography for diagnosis of hyperfibrinolysis in patients. (Oral) SPIE Photonics West conference, San Fransisco 2016. [Google Scholar]
- 59.Tripathi M, Tshikudi D, Hajjarian Z, Van Cott EM and Nadkarni SK. An optical sensor for comprehensive coagulation sensing in patients. J Thromb Haemost. 2017;(submitted). [Google Scholar]


