

Abstract
Metastasis-initiating cells with stem-like properties drive cancer lethality, yet their origins and relationship to primary-tumor-initiating stem cells are not known. We show that L1CAM+ cells in human colorectal cancer (CRC) have metastasis-initiating capacity, and we define their relationship to tissue regeneration. L1CAM is not expressed in the homeostatic intestinal epithelium, but is induced and required for epithelial regeneration following colitis and in CRC organoid growth. By using human tissues and mouse models, we show that L1CAM is dispensable for adenoma initiation but required for orthotopic carcinoma propagation, liver metastatic colonization and chemoresistance. L1CAMhigh cells partially overlap with LGR5high stem-like cells in human CRC organoids. Disruption of intercellular epithelial contacts causes E-cadherin-REST transcriptional derepression of L1CAM, switching chemoresistant CRC progenitors from an L1CAMlow to an L1CAMhigh state. Thus, L1CAM dependency emerges in regenerative intestinal cells when epithelial integrity is lost, a phenotype of wound healing deployed in metastasis-initiating cells.
Metastasis remains the main cause of cancer-related death. The persistence and lethal relapse of disseminated cancer is driven by stem-like cells that have the ability to regenerate tumors in distant sites1–4. Despite the heterogeneity of human cancers, these shared traits operationally define the phenotypic state of metastasis-initiating cells. However, the mechanisms that drive the emergence of the metastasis-initiating phenotype, its molecular mediators and the relationship to the cells that initiate primary tumors (termed cancer stem cells5,6) have remained unclear.
Here we address the origins of human metastasis-initiating cells through their expression of a marker and mediator of metastasis-initiating function, the L1 cell adhesion molecule (L1CAM). Although L1CAM was originally identified as a neuronal cell adhesion molecule7, we have recently shown that it is an essential component for disseminated cancer cells from breast, lung, kidney and colorectal carcinomas to initiate proliferation in the brain, lung, liver and bone8,9. Upon extravasating from the circulation in distant organs, these metastatic progenitors use L1CAM to adhere and spread on the surface of blood capillaries and to activate the mechanotransduction-sensitive transcription factors YAP and MRTF, which is required for the initiation of metastatic outgrowth in perivascular sites8,9. How and when cancer cells that initiate metastatic colonization acquire the ability to express L1CAM has remained an open question. L1CAM is not expressed in most normal tissues during homeostasis, including in rapidly proliferating tissues such as the intestinal epithelium, yet L1CAM expression is associated with aggressive disease and poor clinical outcome in a majority of solid tumor malignancies10.
By using primary tumor and liver metastases from patients with CRC, mouse models of colitis and intestinal cancer, and single-cell analysis, here we define the context in which L1CAM-expressing cells emerge in the intestinal epithelium, the essential role of L1CAM in intestinal epithelial regeneration and the mechanisms regulating the dynamic expression of L1CAM in chemoresistant CRC progenitors that use this molecule for organoid formation, tumor propagation and metastasis. L1CAM expression, together with the metastatic phenotype of the cells that depend on it, emerges when epithelial integrity is disrupted, a regenerative trait that underlies the tumor-regenerative state of metastasis-initiating cells.
Our work defines the functional capabilities and phenotypic plasticity of L1CAMhigh cancer cells with metastasis-initiating capacity, the relationship of these cells to LGR5high stem-like cells required for homeostasis and an E-cadherin-REST mechanism that regulates the dynamic expression of L1CAM in these cells. This work paves the way for mechanistic dissection and therapeutic targeting of metastatic cancers.
Results
L1CAMhigh CRC cells propagate organoids and tumors.
We performed L1CAM immunohistochemistry on CRC sections from patients. L1CAM was not detected in normal colonic epithelium but was expressed in some cancer cells at the invasion front of primary CRC tumors (Fig. 1a), including in cell clusters performing lymphovascular invasion (Fig. 1a and Extended Data Fig. 1a), and was enriched in matched metastases (Fig. 1a,b). In patients who had received neoadjuvant chemotherapy, the residual cancer cells in post-therapy surgical resection samples showed strong L1CAM staining in comparison to matched pretreatment biopsies (Fig. 1c–e).
Fig. 1 |. L1CAM marks chemoresistant organoid-generating cells in human CRC.
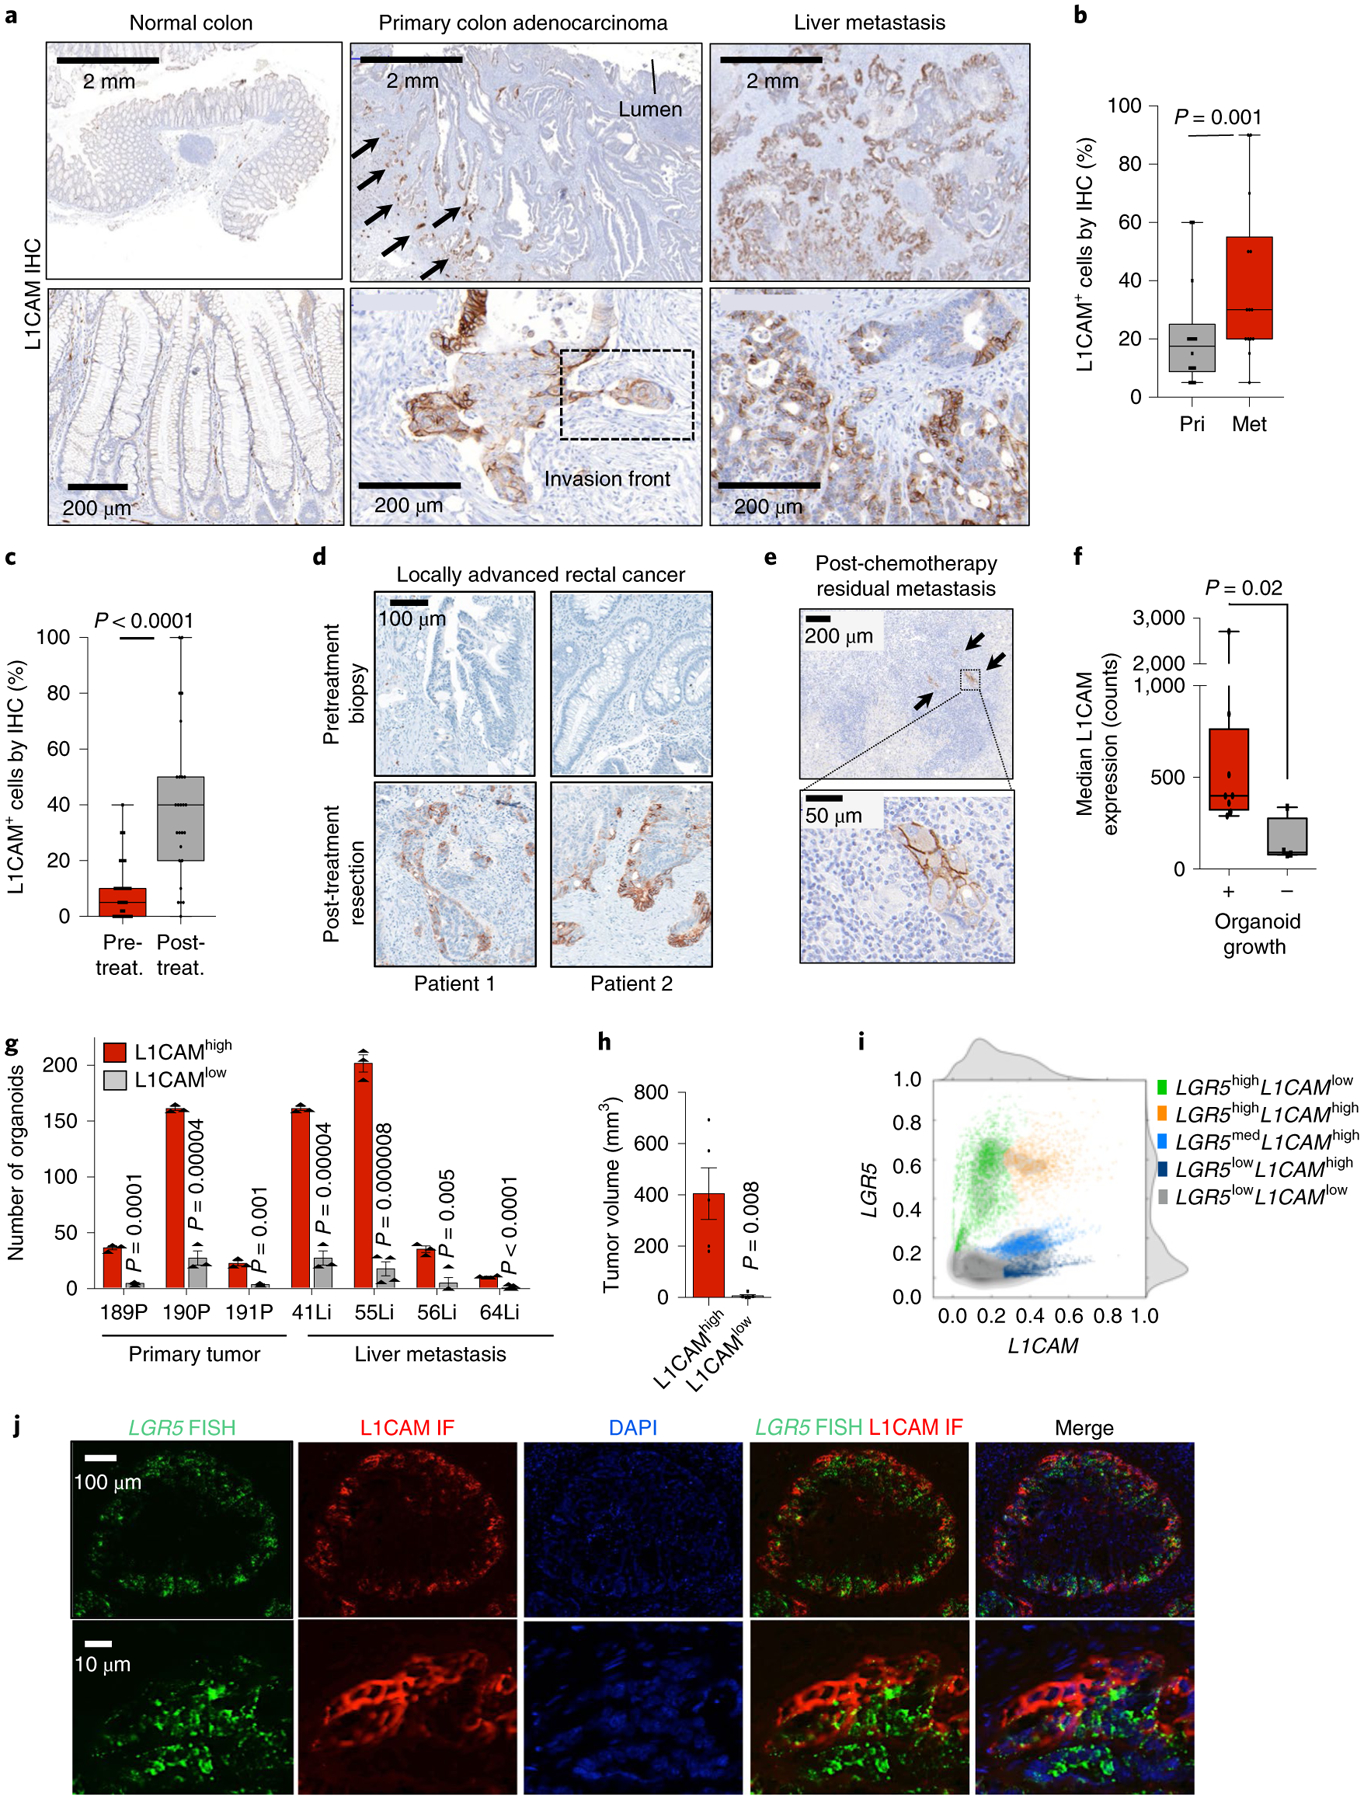
a, L1CAM expression is increased in liver metastases (Met) as compared to matched primary tumors (Pri). Immunohistochemistry (IHC) for L1CAM is shown in matched normal colon, primary CRC tumor and liver metastasis sections from a representative patient. Arrows indicate L1CAM staining at the invasion front of the primary tumor. Detail of the boxed region is shown in Extended Data Fig. 1a. b, The percentage of L1CAM-expressing tumor cells in each section. In box plots, boxes show the 25th–75th percentile with the median, and whiskers show the minimum-maximum; n = 18 paired patient samples; two-sided Wilcoxon matched-pairs signed-rank test. c, Percentage of L1CAM-expressing cells in matched pretreatment (pre-treat.) biopsies and post-treatment (post-treat.) surgically resected residual disease in patients with locally advanced rectal cancer. In box plots, boxes show the 25th–75th percentile with the median, and whiskers show the minimum-maximum; n = 31 patients; two-sided Wilcoxon matched-pairs signed-rank test. d, Representative sections of paired pretreatment core biopsies and matched surgical resection specimens obtained after chemoradiation, from two patients with rectal adenocarcinoma, showing L1CAM expression in peripheral areas of residual adenocarcinoma after treatment. e, L1CAM immunohistochemistry in a human CRC liver metastasis resected after neoadjuvant chemotherapy, showing dense stromal infiltration and L1CAM-expressing residual tumor cell clusters. Representative of 18 samples analyzed. f, Tumor L1CAM expression is associated with greater organoid generation capacity. Median L1CAM expression is shown for freshly resected and dissociated patient CRC liver metastases measured by flow cytometry before plating of 10,000 cells in 40 μl of Matrigel using organoid medium. Organoid generation ability was assessed 14 d after plating. In box plots, boxes show the 25th–75th percentile with the median, and whiskers show the minimum-maximum; n = 14 paired patient tumor samples; two-sided Mann-Whitney U test. g, Number of organoids (mean ± s.e.m.) grown from 10,000 L1CAMhigh or L1CAMlow cells flow-sorted from freshly resected patient CRC primary tumors (P, left) or liver metastases (Li, right), counted 14 d after surgical resection and flow sorting. From left to right, n = 3, 3, 3, 3, 3, 3, 3, 3, 3, 4, 3, 4, 4 and 11 replicates per group from each of seven patients; two-tailed Student’s t tests. h, Subcutaneous tumor volumes measured 35 d after transplantation of mice with 50,000 organoid-derived flow-sorted L1CAMhigh or L1CAMlow cells (mean ± s.e.m.); n = 5 mice per group; two-tailed Mann-Whitney U test. i, Biaxial density plot showing relative expression of L1CAM and LGR5 in 9,974 cells from four independent patient-derived metastatic CRC organoids subjected to scRNA-seq. Five clusters identified according to relative L1CAM and LGR5 expression are overlaid as colors on the density plot. j, Dual LGR5 mRNA FISH and L1CAM immunofluorescence (IF) on a patient primary CRC tissue section (top, low magnification; bottom, high magnification), showing discrete expression levels of LGR5 and L1CAM in different cell clusters, including double-positive cells. Representative field of eight tumor sections from four patients analyzed.
Because organoid initiation is a property of stem-like cells11,12, we asked whether L1CAMhigh CRC cells have this capacity. We assayed the organoid-forming activity of freshly resected primary tumor samples and liver metastasis samples from patients undergoing surgical hepatectomy after neoadjuvant chemotherapy. Samples that expressed high levels of L1CAM on the cell surface yielded organoids more frequently than did samples with low L1CAM levels (Fig. 1f). L1CAMhigh cells sorted from resected primary tumors and liver metastases had greater organoid-generating capacity than did L1CAMlow cells from the same samples (Fig. 1g and Extended Data Fig. 1b,c). Organoid-derived, sorted L1CAMhigh cells also displayed greater tumor-generating capacity than did L1CAMlow cells when implanted as subcutaneous xenografts in mice (Fig. 1h and Extended Data Fig. 1d), as confirmed by in vivo limiting dilution analysis (Extended Data Fig. 1e,f). These tumors recapitulated the well-differentiated glandular histopathology of the patient samples from which they were derived (Extended Data Fig. 1g). Flow-sorted L1CAMhigh cells derived from subcutaneous tumors retained their superior organoid-initiating capacity (Extended Data Fig. 1h,i).
The expression of L1CAM by cells capable of organoid generation was reminiscent of LGR5, a canonical marker of homeostatic and adenoma-forming intestinal stem cells13,14. Given the lack of antibodies to probe cell-surface LGR5 expression, we used single-cell RNA sequencing (scRNA-seq) to ask whether LGR5 and L1CAM expression overlap within the same cells. We analyzed the transcriptome of 9,974 cells isolated from day 21 organoids derived from two primary tumors and two liver metastases from four patients with stage IV CRC (Extended Data Fig. 2a). Cells from the two primary tumors clustered closely, and cells from the metastases formed largely distinct populations (Extended Data Fig. 2b,c). While the proportion of L1CAM-expressing cells was varied, we identified subpopulations of cells expressing one or both markers, including the existence of LGR5highL1CAMhigh double-positive cells (Fig. 1i and Extended Data Fig. 2c), as confirmed by using dual LGR5 mRNA fluorescent in situ hybridization (FISH) and L1CAM immunofluorescence in patient tumors (Fig. 1j). Different proportions of cells expressed LGR5 or L1CAM in each sample, with the metastasis-derived organoids containing a higher proportion of L1CAM-expressing cells than primary-tumor-derived organoids (Extended Data Fig. 2d). Given the caveats of patient-specific differences, the significance of these differences between samples is presently unknown. A recently described single-cell transcriptomic signature defines a regenerative stem cell phenotype that emerges in mouse intestinal epithelium after radiation injury15. Our metastasis samples scored high for this revival stem cell signature (Extended Data Fig. 2e) and transcription factors associated with epithelial-mesenchymal transition (Extended Data Fig. 2f). L1CAMhigh cells showed low expression of CD36, encoding a fatty acid transporter expressed by certain metastasis-initiating cells16, though these cells scored high for the expression of some genes associated with fatty acid metabolism (Extended Data Fig. 2g). Flow-based comparison of other described CRC stem cell markers revealed higher levels of EphB2, CD133/prominin and CD44 on L1CAMhigh than on L1CAMlow tumor cells (Extended Data Fig. 2h,i).
L1CAM drives survival, chemoresistance and regeneration of organoids and tumors.
Knockout of L1CAM in metastasis-derived organoids inhibited the ability of organoid-derived single cells to regenerate new organoids (Fig. 2a and Extended Data Fig. 3a,b). We could not recover substantial amounts of L1CAM-knockout organoids from CRISPR-edited pools, suggesting that complete L1CAM loss inhibits the survival of organoid-derived dissociated cells. To overcome this barrier, we used doxycycline-inducible short hairpin RNA (shRNA) targeting L1CAM. Inducible L1CAM knockdown inhibited organoid regeneration by dissociated single cells (Fig. 2b,c). L1CAM-deficient cells showed increased caspase activity in the first week following dissociation (Extended Data Fig. 3c). Withdrawal of doxycycline after 14 d of culture did not rescue organoid regrowth (Extended Data Fig. 3d), suggesting that CRC progenitors require L1CAM not only to drive organoid regrowth but also to survive when detached from epithelial structures. In vivo, L1CAM knockdown abrogated tumor growth (Fig. 2d,e). To test whether L1CAMhigh cells selectively survived chemotherapy, we treated mature day 21 organoids with irinotecan. The cells surviving chemotherapy were strongly enriched for L1CAM expression (Fig. 2f). Treatment of mature steady-state organoids with irinotecan together with L1CAM knockdown significantly increased tumor cell killing in comparison to irinotecan treatment alone (Fig. 2g and Extended Data Fig. 3e).
Fig. 2 |. L1CAM is a mediator of organoid and tumor regeneration.
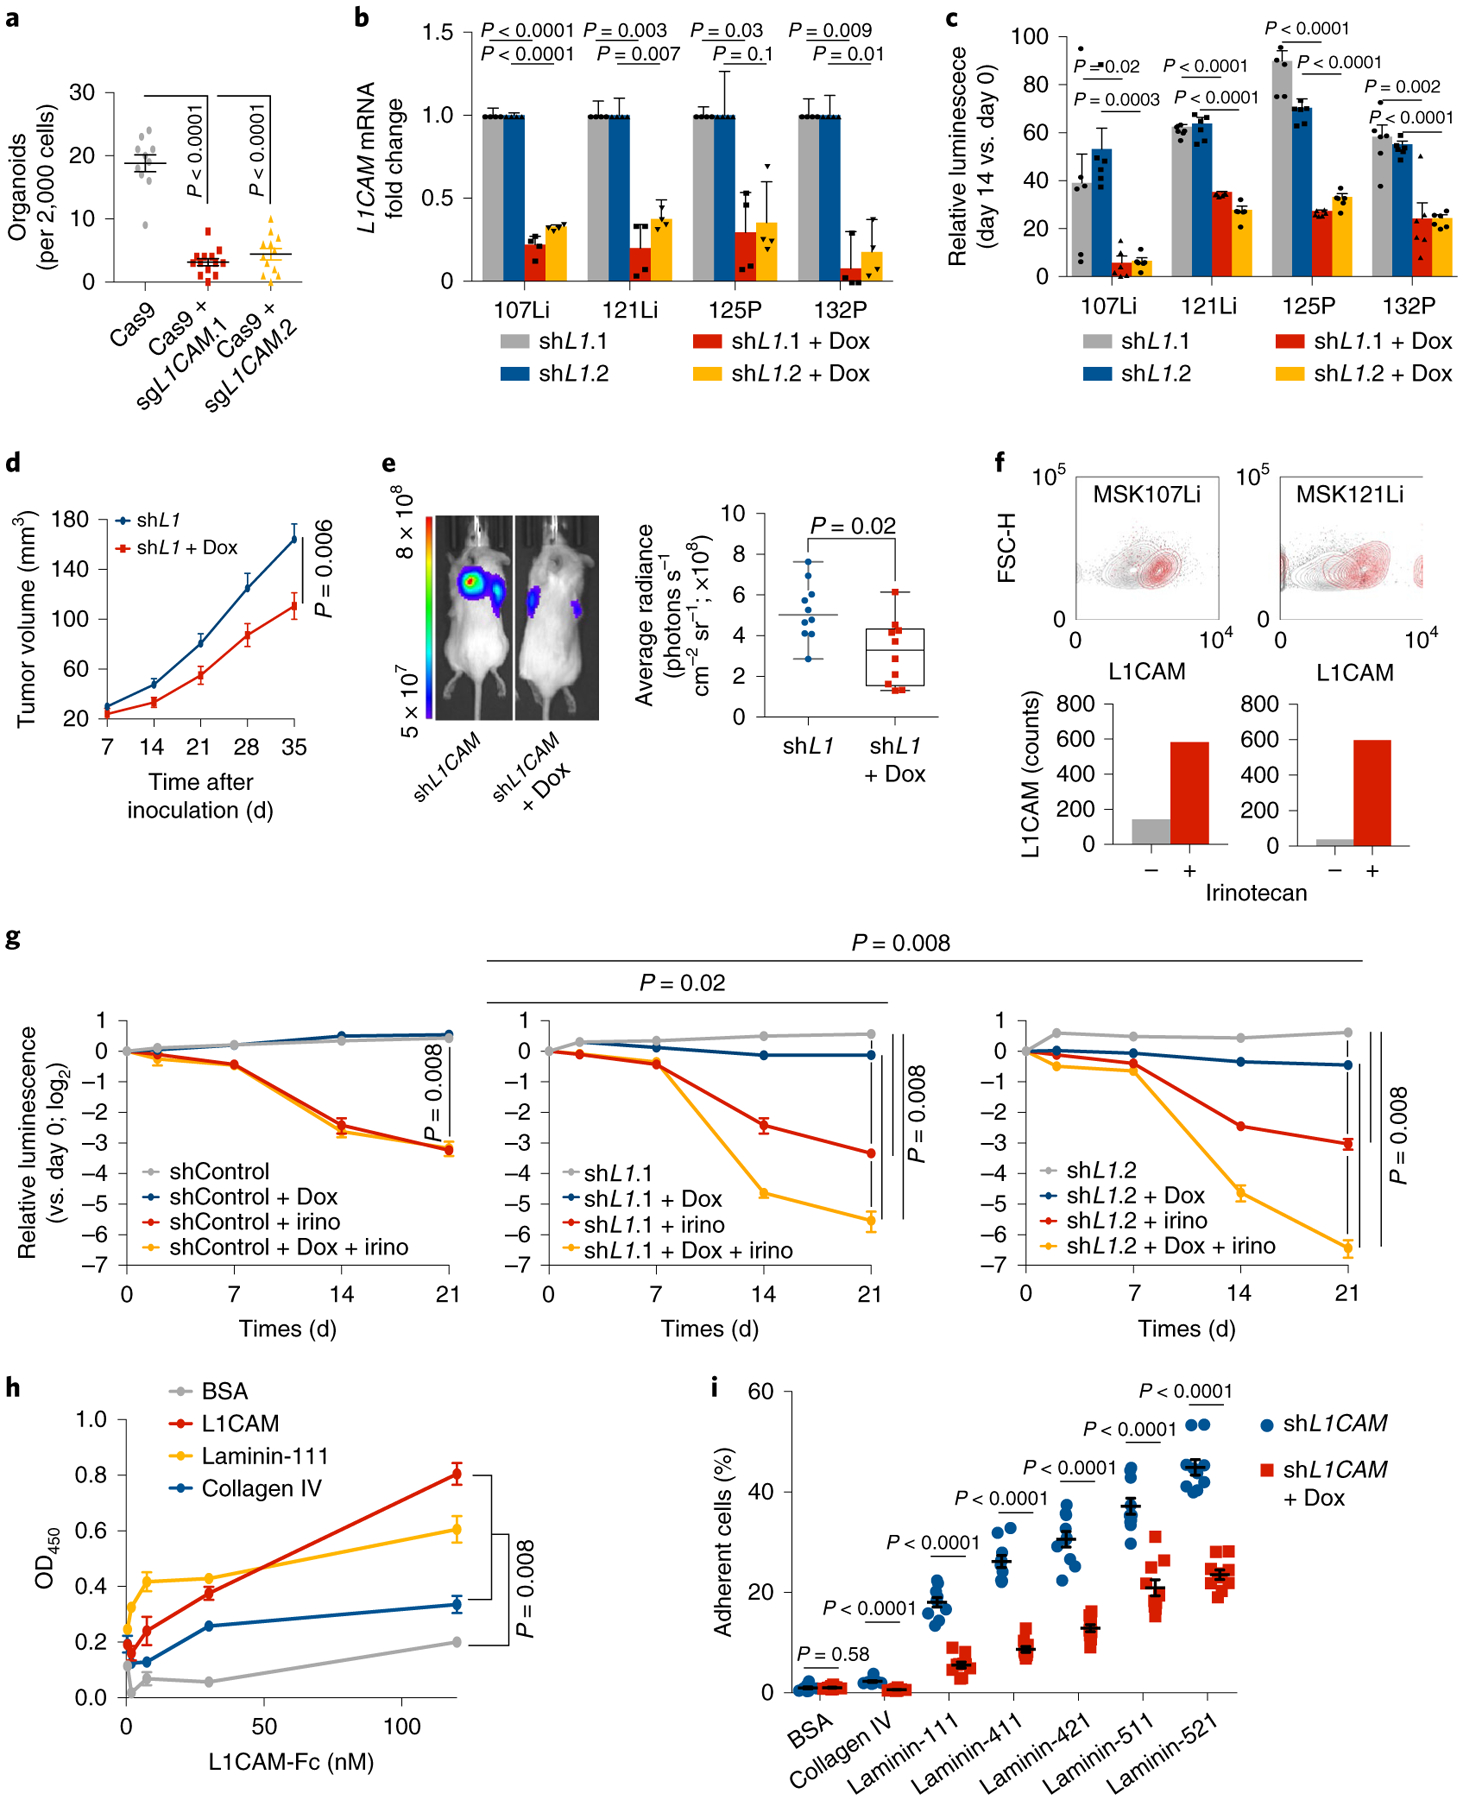
a, L1CAM is required for organoid regeneration. CRC107Li organoid-derived cells were transduced with lentivirus directing the expression of either Cas9 alone or Cas9 with sgRNAs targeting L1CAM and allowed to grow under antibiotic selection for 14 d, when they were flow-sorted and seeded at a concentration of 2,000 cells per 40 μl of Matrigel in independent wells of a 96-well plate. The number of organoids (mean ± s.e.m.) established from each population 14 d after sorting and seeding is shown. From left to right, n = 10, 13 and 11 organoid cultures per group; two-tailed Mann-Whitney U test. b,c, L1CAM knockdown inhibits regrowth of multiple patient-derived organoids. Organoids derived from four patients with metastatic CRC were transduced with lentiviruses directing the expression of doxycycline (Dox)-inducible shRNA targeting L1CAM, expanded and, where indicated, treated with doxycycline for 48 h before dissociation and seeding at a concentration of 2,000 cells per 40 μl of Matrigel. Knockdown efficiencies of two independent L1CAM-targeting shRNAs in four patient-derived organoids (b) and relative cell viability on day 14 as compared to day 0 (mean ± s.e.m.) after plating of organoid-derived single cells (c) are shown. n = 6 organoid cultures per group; two-sided Student’s t tests. d, L1CAM is required for subcutaneous tumor growth in vivo. MSK107Li organoid-derived cells (50,000) expressing a doxycycline-inducible shRNA targeting L1CAM were injected subcutaneously into each flank of immunodeficient NSG mice. Where indicated, organoids were treated with doxycycline 2 d before transplantation and mice were maintained on a doxycycline diet for the duration of the experiment. Tumor volume (mean ± s.e.m.) was measured with calipers at the indicated time points after subcutaneous inoculation. n = 10 tumors from five mice per group; two-tailed Mann-Whitney U test. e, Representative image and quantification of tumor bioluminescence measured 35 d after inoculation. In box plots, boxes show the 25th–75th percentile with the median, and whiskers show the minimum-maximum; n = 10 tumors from five mice per group; two-sided Mann-Whitney U test. f, Day 21 steady-state MSK107Li and MSK121Li organoids were incubated in medium containing 50 μM irinotecan, and L1CAM expression was measured in residual DAPI− cells 7 d later. Top- flow cytometry plots showing distribution of the data. Bottom: bars showing median fluorescence intensity of L1CAM expression in each population. From left to right, n = 6,512, 130, 8,542 and 49 cells per group, representative of three independent experiments. g, Single cells derived from CRC107Li organoids transduced with lentivirus directing expression of the indicated shRNAs were seeded at a concentration of 2,000 cells per 40 μl grown as organoids for 21 d and then treated with doxycycline and/or irinotecan (irino) as indicated. The viability assay shows the luminescence (mean ± s.e.m.) of each population relative to the luminescence at the time that drug treatment was started (day 0); n = 5 organoid cultures per group; two-sided Mann-Whitney U test. h, Solid-phase binding assay showing dose-response curves of recombinant human L1CAM-Fc binding to plates coated with equimolar concentrations of the indicated proteins. After washing, bound L1CAM-Fc was detected with horseradish peroxidase (HRP)-conjugated anti-human IgG, HRP substrate was added and OD450 was measured. Data are shown as the mean ± s.e.m; n = 5 wells per time point, representative of three independent experiments; two-tailed Mann-Whitney U test. i, L1CAM mediates the interaction of dissociated CRC cells with laminin isoforms. Single cells derived from MSK121Li organoids (3,000) cultured in the presence or absence of doxycycline to knock down L1CAM were seeded in wells coated with 30 nM of the indicated proteins. After 1 h of adhesion and extensive washing, the percentage of adherent cells (mean ± s.e.m.) was measured as the relative luminescence of each well immediately after plating. n = 10 organoid cultures per condition; two-tailed Mann-Whitney U tests.
L1CAM mediates CRC cell binding to laminins.
We showed that L1CAM mediates the perivascular spreading of disseminated metastatic cells in distant organs via intimate interactions between the basal lamina of the endothelium and metastatic cells, which enables activation of the mechanotransduction-dependent transcription factors YAP and MRTF and outgrowth of metastatic colonies8,9. Collagen IV and laminin isoforms 111, 411, 421, 511 and 521 are major components of microvascular17 and epithelial18 basement membranes. Organoids are grown in Matrigel, which consists of 60% laminin-111 and 30% collagen IV (ref.19). L1CAM forms homophilic interactions between adjacent cells20, but it has also been reported to interact with laminin21. By using recombinant L1CAM extracellular domain and basement membrane components, we confirmed that L1CAM bound heterophilically to laminins known to be expressed in the intestinal and endothelial cell basement membranes in addition to exhibiting homophilic interaction with L1CAM itself (Fig. 2h and Extended Data Fig. 3f,g). Recombinant L1CAM bound weakly to collagen IV and to the stem cell niche component tenascin C22 (Extended Data Fig. 3f). Moreover, L1CAM knockdown inhibited the ability of CRC organoid-derived cells to bind to laminin-coated plates (Fig. 2i). Together, these data suggest that L1CAM enables the adhesion of metastasis-initiating cells to laminin-rich basement membranes, which is required for metastasis and organoid growth.
L1CAM is induced and required for epithelial regeneration after tissue damage.
In patient samples, we noted that, in well-differentiated areas of primary and metastatic tumors with intact glandular morphology, L1CAM+ cells were largely negative for Ki67 as compared to surrounding L1CAM− cells, suggesting quiescence (Fig. 3a–c). However, in poorly differentiated areas with loss of epithelial integrity, as judged by loss of continuity of glandular structures, L1CAM+ cells demonstrated significantly higher Ki67 expression, comparable to that in surrounding L1CAM− cells (Fig. 3b,c). These data suggested an association between disruption of epithelial architecture and proliferation of L1CAMhigh cells (Fig. 3a–c). In line with this, when dissociated from intact patient tumors and induced to grow, L1CAMhigh cells were Ki67+ in growing organoids, but when these organoids were implanted as subcutaneous xenografts they again reformed glandular tumors with L1CAM staining largely restricted to Ki67− cells in the tumor periphery (Fig. 3d).
Fig. 3 |. Disruption of the epithelial niche induces L1CAM expression.
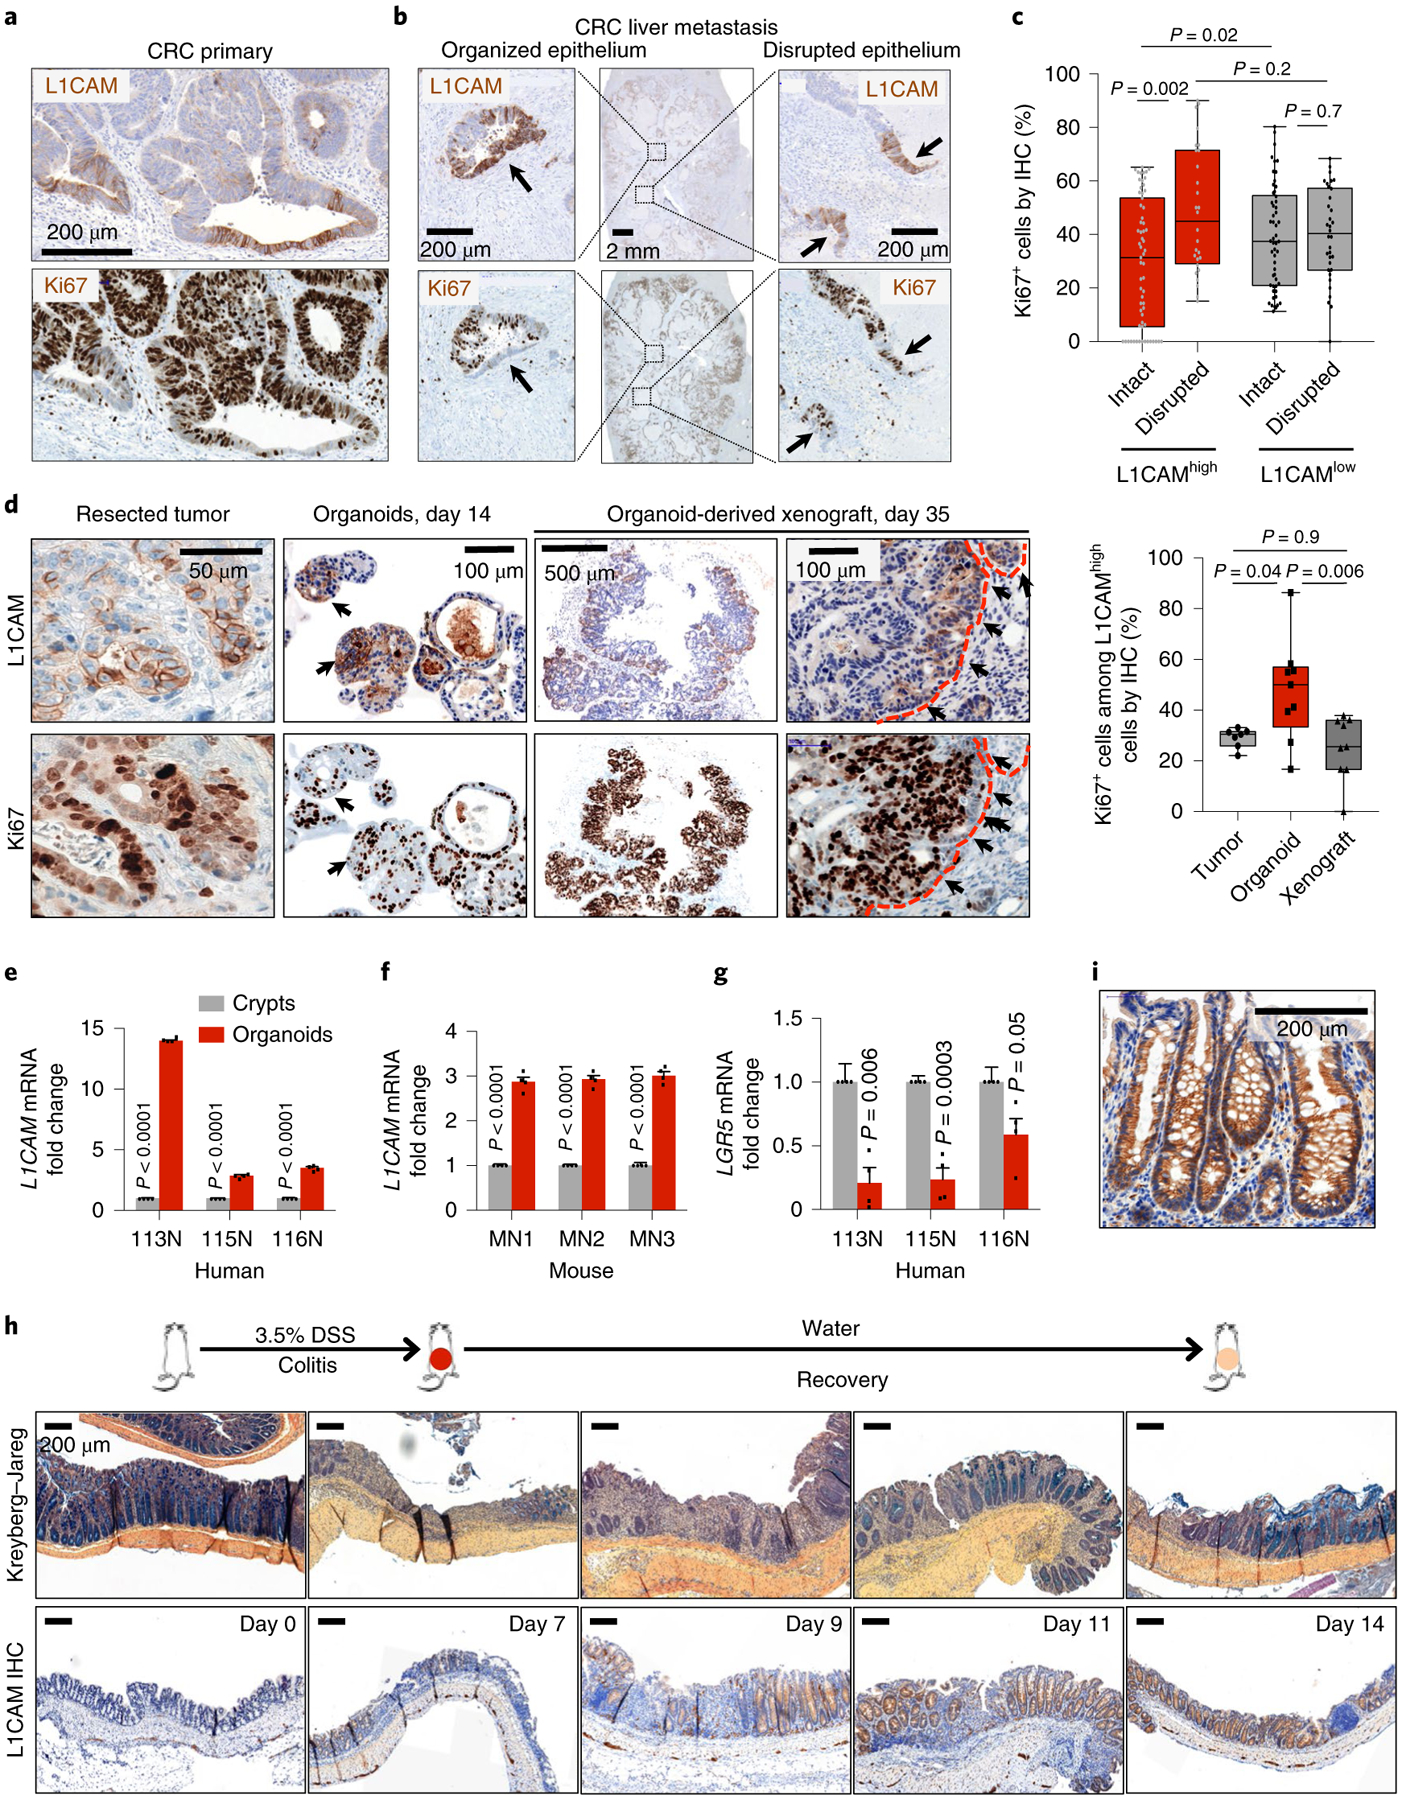
a, Immunohistochemistry for L1CAM (top) and Ki67 (bottom) in serial sections of a representative human CRC primary tumor invasion front showing an inverse relationship between L1CAM and Ki67 expression. Representative of 16 tumors analyzed. b, Immunohistochemistry for L1CAM (top) and Ki67 (bottom) in serial sections of a representative post-treatment human CRC liver metastasis demonstrating L1CAMhighKi67low cells in organized epithelial structures and L1CAMhighKi67high cells in disrupted epithelia. Representative of 16 tumors analyzed. c, Percentage of L1CAMhigh and L1CAMlow cells that are also Ki67high in regions of intact versus disrupted glandular epithelial architecture within CRCs. In box plots, boxes show the 25th–75th percentile with the median, and whiskers show the minimum-maximum; from left to right, n = 64, 54, 28 and 34 independent fields from 16 patient tumors; two-sided Mann-Whitney U tests. d, Immunohistochemistry for L1CAM (top) and Ki67 (bottom) in serial sections of MSK107Li matched surgically resected patient CRC liver metastasis, metastasis-derived organoids and organoid-derived subcutaneous xenograft. Dashed red lines indicate the tumor-stromal boundary. Box plots indicate the percentage of Ki67+ cells among L1CAMhigh cells in the indicated sections. In box plots, boxes show the 25th–75th percentile with the median, and whiskers show the minimum-maximum; from left to right, n = 7, 9 and 9 independent fields; two-sided Mann-Whitney U tests. e,f, L1CAM is induced during normal epithelial organoid formation. Relative L1CAM mRNA levels (mean ± s.e.m.) are shown for human (e) and mouse (f) cells freshly isolated from intact colons or collected after 14 d of growth in organoid conditions. Data were normalized to GAPDH mRNA levels. n = 4 crypts or organoid cultures from each of three patients or mice; two-sided Student’s t tests. g, Relative LGR5 mRNA levels (mean ± s.e.m.) in human cells freshly isolated from intact colons or collected after 14 d of growth in organoid conditions. Data were normalized to GAPDH mRNA levels. n = 4 crypts or organoid cultures from each of three patients; two-sided Student’s t tests. h, L1CAM is induced during epithelial regeneration after colitis. C57BL/6J mice were given 3.5% DSS in their drinking water for 5 d, inducing maximal colitis by day 7, and were then maintained on water without DSS for 12 d. Mice were killed at each of the indicated time points, and their colons were collected, sectioned and either stained with Kreyberg-Jareg stain (blue, mucin; pink, collagen) or subjected to immunohistochemistry for L1CAM. Representative images of three independent experiments are shown. i, High-magnification view showing detail of L1CAM immunohistochemical staining throughout the length of the intestinal crypt, representative of three mice each from three independent experiments.
Given the association of tissue disruption with proliferative L1CAM-expressing cells in tumors and organoids, we asked whether L1CAM might also be induced in non-transformed epithelia when intestinal epithelial integrity is disrupted. While normal human and mouse colon epithelia did not express substantial amounts of L1CAM mRNA, when dissociated from their niche and grown as organoids, non-transformed colon epithelial cells showed increased L1CAM mRNA levels (Fig. 3e,f). In contrast, LGR5 mRNA expression was suppressed during organoid regeneration by normal colon crypt cells (Fig. 3g). To test whether L1CAM is induced during epithelial regeneration in vivo, we treated C57BL/6J mice with the inducer of intestinal epithelial inflammation dextran sodium sulfate (DSS), which damages mucosal integrity and leads to crypt loss23. Inclusion of DSS in the drinking water for 5 d resulted in maximal colitis by day 7, as judged by diarrhea, rectal bleeding and weight loss, which was followed by recovery over 7 d. Loss and restoration of mucin-producing epithelial cells was monitored by Kreyberg-Jareg stain, which stains epithelial mucin blue and stromal collagen pink. L1CAM was not expressed in control mice given water without DSS, but was expressed during the recovery phase after colitis, starting from day 7, in regenerating colon crypts at areas that suffered DSS damage (Fig. 3h). L1CAM immunostaining was evident throughout the length of intestinal crypts, in line with expression in both stem and differentiated cells, with the strongest expression in an extended population in the middle of regenerating crypts (Fig. 3i).
To determine the functional role of L1CAM in colon regeneration, we crossed L1camfl/y (L1CAMfl/y) mice24 with Vil1-cre mice25, which specifically express Cre recombinase in intestinal epithelial cells. Under homeostatic conditions, the resulting L1CAMΔIEC mice did not display any abnormalities in weight or bowel habit (data not shown) or in intestinal histology (Fig. 4a) in comparison to littermate controls. In contrast, when treated with DSS, L1CAMΔIEC mice demonstrated sustained weight loss, diarrhea and rectal bleeding (disease activity index) and reduced survival in comparison to controls (Fig. 4b,c). Autopsy revealed shortened colons, with histopathology showing diffuse inflammation, areas of mucosal denudation and dysmorphic crypts (Fig. 4d,e). To interrogate whether L1CAM is required by the progeny of LGR5-expressing cells during regeneration, we also generated Lgr5-GFP-IRES-creERT2; L1camfl/y (L1CAMΔLGR5) mice, which express tamoxifen-activated Cre recombinase in LGR5-expressing crypt base stem cells13. Despite the reported heterogeneity in the expression of the transgene, Lgr5-GFP expression was noted in the majority of distal colon crypts (Fig. 4f) and tamoxifen treatment resulted in a >70% reduction in L1CAM expression (Fig. 4g–i). In comparison to L1CAMfl/y and Lgr5-GFP-IRES-creERT2 (WTΔLGR5) controls, L1CAMΔLGR5 mice also showed poor tissue healing and reduced survival, with autopsy revealing shortened colons and histopathology showing diffuse inflammation with areas of mucosal denudation (Fig. 4i–l).
Fig. 4 |. L1CAM is required for epithelial regeneration after colitis.
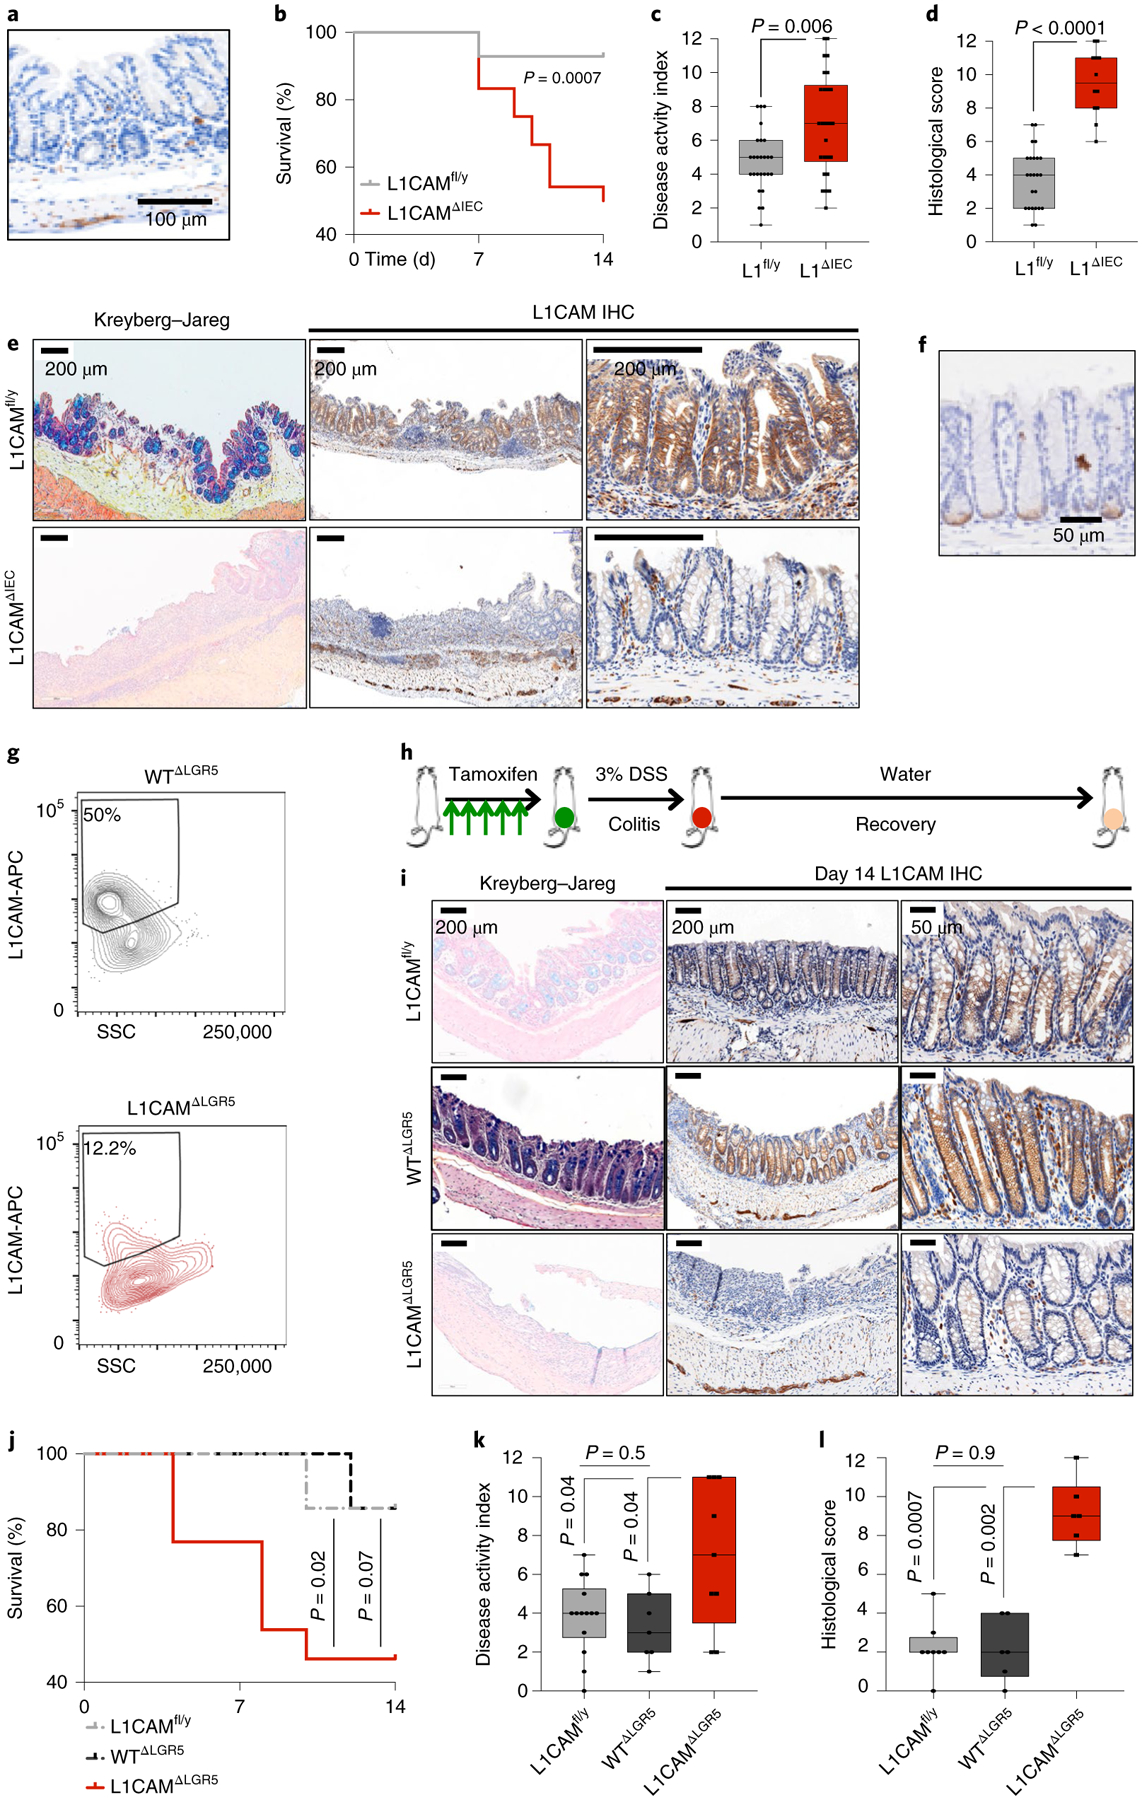
a, L1CAM immunohistochemistry in a representative colon section from an L1CAMΔIEC mouse maintained on water with DSS, showing L1CAM staining restricted to submucosal neurons and no L1CAM expression in the epithelial cells of the crypt. Representative of three independent mice. b–f, L1CAM deficiency impairs epithelial healing following DSS-induced colitis. L1CAMfl/y and L1CAMΔIEC mice were given 3.5% DSS in their drinking water for 5 d, followed by 12 d of water without DSS before being killed. b, Kaplan-Meier survival curves. n = 26 mice per group from three independent experiments; two-sided Mantel-Cox test. c, Disease activity index (composite of weight loss, diarrhea and rectal bleeding) measured at the time of maximal colitis on day 7. In box plots, boxes show the 25th–75th percentile with the median, and whiskers show the minimum-maximum; n = 26 mice per group; two-sided Mann-Whitney U test. d, Histological score (composite of inflammation, mucosal denudation and crypt dysmorphia) on day 14. L1CAMfl/y, n = 24; L1CAMΔIEC, n = 12. In box plots, boxes show the 25th–75th percentile with the median, and whiskers show the minimum-maximum; two-sided Mann-Whitney U test. e, Representative histological sections with Kreyberg-Jareg staining (blue, mucin; pink, collagen) and immunohistochemical staining for L1CAM showing denudation of mucin-producing crypts in L1CAMΔIEC mice on day 14. Panels on the right show higher magnification of less damaged areas of the colon exhibiting loss of L1CAM immunostaining in crypts of L1CAMΔIEC mice. Representative of three independent experiments. f–l, L1CAM deficiency in the progeny of LGR5-expressing cells impairs epithelial healing after DSS-induced colitis. f, Immunohistochemistry for GFP in a representative colon section from an L1CAMΔLGR5 mouse killed after 5 d of daily tamoxifen treatment. n = 3 mice. g, WTΔLGR5 and L1CAMΔLGR5 mice were treated as in f and killed, and their colon crypts were isolated and seeded for organoid generation. Representative flow cytometry assessment is shown of L1CAM expression 24 h after seeding. n = 2 mice per genotype. h, Schematic of experimental design. Mice were treated with tamoxifen for 5 d to induce Lgr5-GFP-IRES-creERT2 expression and subsequently treated with 3% DSS for 5 d, with maximal colitis by day 7. They were then maintained on water without DSS for a further 12 d before being killed. i, Representative histological sections with Kreyberg-Jareg staining (blue, mucin; pink, collagen) and immunohistochemical staining for L1CAM showing denudation of mucin-producing crypts in the distal colon in L1CAMΔLGR5 mice on day 14, while crypts are restored in L1CAMfl/y and WTΔLGR5 mice. The panels on the right show higher magnification of less damaged areas of the colon exhibiting loss of L1CAM immunostaining in crypts in L1CAMΔLGR5 mice in comparison to L1CAMfl/y and WTΔLGR5 mice. Representative of 20 evaluable mice from two independent experiments. j, Kaplan-Meier plot showing cumulative survival of L1CAMfl/y, WTΔLGR5 and L1CAMΔLGR5 mice. n = 33 mice from two independent experiments; two-sided Mantel-Cox tests. k, Disease activity index (composite of weight loss, diarrhea and rectal bleeding) measured at the time of maximal colitis on day 7. In box plots, boxes show the 25th–75th percentile with the median, and whiskers show the minimum-maximum; n = 33 mice from two independent experiments; two-sided Mann-Whitney U tests. l, Histological scores (composite of inflammation, mucosal denudation and crypt dysmorphia) on day 14. In box plots, boxes show the 25th–75th percentile with the median, and whiskers show the minimum-maximum; n = 20 evaluable mice from two independent experiments; two-sided Mann-Whitney U tests.
L1CAM promotes tumor growth and metastasis upon loss of epithelial integrity.
Because tissue-regenerative functions have been implicated in tumor initiation26,27, we sought to determine whether L1CAM also functions during adenoma formation. We generated adenoma-prone Vil1-cre+/−; Apcfl/+ (APCΔIEC) mice28 and Vil1-cre+/−; Apcfl/+; L1camfl/y (L1CAM/APCΔIEC) mice and scored adenoma formation at 3 months of age. To our surprise, the number, size, Ki67 expression and morphology of intestinal tumors were similar in the L1CAM-proficient and L1CAM-deficient groups (Fig. 5a,b and Extended Data Fig. 4a). Although we cannot exclude the possibility of unknown functional compensation for prenatal L1cam deletion, L1CAM expression appears to be dispensable for the formation of adenomas. Unlike organoid formation or post-colitis regeneration, in which the contiguous architecture of the epithelium is disrupted, adenoma formation involves hyperproliferation in an intact epithelial context, as shown by the strong intercellular E-cadherin staining in both L1CAM-proficient and L1CAM-deficient adenomas (Extended Data Fig. 4a).
Fig. 5 |. L1CAM is dispensable for adenoma formation but is required for orthotopic tumor engraftment, local expansion, metastasis and chemoresistance.
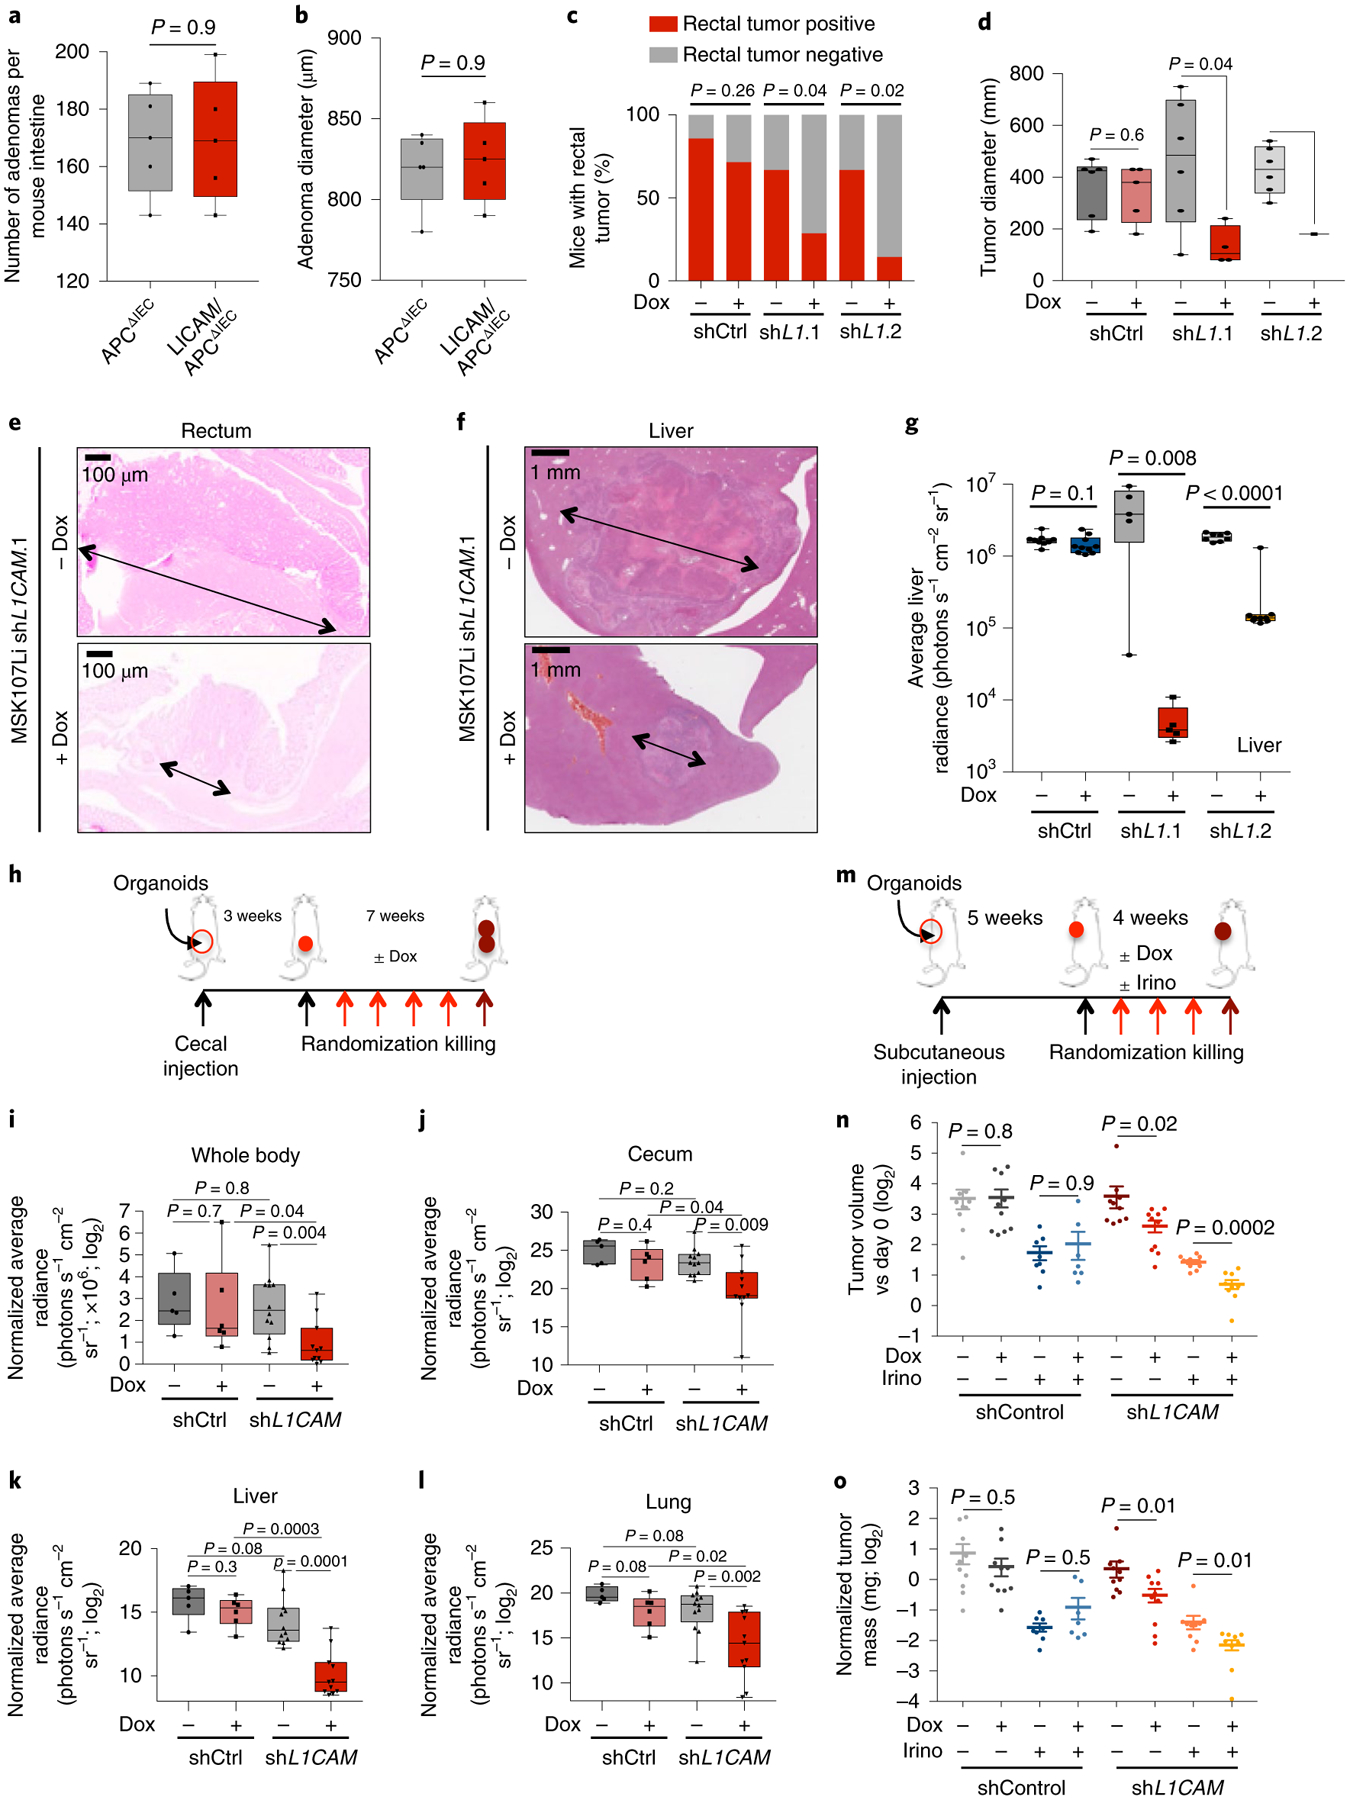
a,b, L1CAM is not required for intestinal adenoma formation. Male APCΔIEC and L1CAM/APCΔIEC mice were killed at 3 months of age, and their colons were collected, sectioned and examined for adenoma formation. a, Number of adenomas per mouse intestine. In box plots, boxes show the 25th–75th percentile with the median and whiskers show the minimum-maximum; n = 5 mice per group; two-sided Mann-Whitney U test. b, Mean adenoma diameter per mouse. In box plots, boxes show the 25th–75th percentile with the median, and whiskers show the minimum-maximum; n = 5 mice per group; two-sided Mann-Whitney U test. c–e, L1CAM inhibition impairs orthotopic rectal tumor engraftment. NSG mice were given 3% DSS in their water for 5 d and then maintained on water without DSS for 2 d before intraluminal transplantation with 2 × 10⁵ cells from dissociated MSK107Li organoids expressing doxycycline-inducible shRNA targeting L1CAM or control shRNA. Where indicated, organoids were treated in vitro with doxycycline starting 2 d before transplantation, and mice were maintained on a doxycycline diet. Mice were killed 90 d after transplantation, and their colons were collected and examined for tumor engraftment. c, Percentage of mice with an engrafted orthotopic tumor. From left to right, the stacked bar graphs show n = 7, 7, 10, 13, 9 and 7 mice per group from three independent experiments; two-sided chi-squared tests. d,e, Tumor diameter per engrafted mouse (in box plots, boxes show the 25th–75th percentile with the median, and whiskers show the minimum-maximum; from left to right, n = 6, 5, 6, 4, 5 and 1 mice from three independent experiments; two-sided Mann-Whitney U tests) (d) and representative H&E-stained sections (e). Arrows indicate tumour diameter. f,g, L1CAM inhibition impairs metastatic colonization of the liver. Cells (5 × 10⁴) were derived from dissociated MSK107Li organoids with doxycycline-inducible expression of shRNA targeting L1CAM. Where indicated, organoids were treated with doxycycline starting 2 d before transplantation and mice were maintained on a doxycycline diet. Representative H&E-stained sections of liver metastases at the experimental endpoint (arrows indicate tumour diameter) (f) and quantification of ex vivo liver bioluminescence signal measured 60 d after transplantation (g) are shown. In box plots, boxes show the 25th–75th percentile with the median, and whiskers show the minimum-maximum; from left to right, n = 9, 10, 8, 9, 5 and 5 mice per group; two-sided Mann-Whitney U tests. h–l, L1CAM inhibition impairs local tumor expansion and metastasis from orthotopic cecal xenografts. h, Schematic of the experiment: cells (4 × 10⁵) derived from MSK121Li organoids transduced with lentivirus directing the expression of tdTomato-luciferase and shRNA targeting L1CAM or control shRNA were injected into the cecal submucosa. Mice were monitored until cecal tumors were evident by ex vivo bioluminescence imaging 3 weeks after injection, randomized on the basis of bioluminescence signal and maintained on or off a doxycycline diet for 7 weeks before being killed. i–l, Quantification of whole-mouse bioluminescence signal (i) and ex vivo bioluminescence signal in the cecum (j), liver (k) and lung (l), normalized to bioluminescence at the time of randomization. In box plots, boxes show the 25th–75th percentile with the median, and whiskers show the minimum-maximum; from left to right, n = 5, 6, 12 and 11 mice per group; two-sided Mann-Whitney U tests. m–o, Combination of L1CAM inhibition with chemotherapy impairs tumor growth to a greater extent than chemotherapy alone. m, Schematic of the experiment. Cells (2 × 10⁵) derived from MSK107Li organoids transduced with lentivirus directing the expression of tdTomato-luciferase and shRNA targeting L1CAM or control shRNA were injected subcutaneously; mice were randomized on the basis of bioluminescence intensity 5 weeks after injection and maintained on a doxycycline diet and/or treated weekly with irinotecan as indicated for 4 weeks before being killed. n,o, Ex vivo tumor volume (n) and mass (o), normalized to tumor bioluminescence at the time of randomization. From left to right, n = 10, 10, 8, 7, 10, 10, 10 and 9 tumors per group; mean ± s.e.m.; two-sided Mann-Whitney U tests.
Next, we asked whether L1CAM is required during tumor dissemination and metastatic colonization by carcinoma cells that breach glandular epithelial integrity. Because intestinal adenocarcinomas gain multiple mutations in addition to APC loss, we generated triple-mutant organoids by transducing normal colon organoids from KrasLSL-G12D; Trp53fl/fl mice with lentivirus directing the expression of Cre recombinase, Cas9 and sgRNA targeting Apc (AKP organoids)29, as well as TdTomato-luciferase. A liver metastatic line was isolated by in vivo selection, transduced with lentivirus directing the expression of inducible shRNA targeting L1CAM or control shRNA (Extended Data Fig. 4b), and orthotopically transplanted as cecal xenografts. Once tumor growth was evident by bioluminescence signal, mice were randomized and treated with doxycycline to induce shRNA expression or left untreated until metastases were evident (Extended Data Fig. 4c–g). In contrast to the lack of a requirement for L1CAM in adenoma initiation, L1CAM knockdown in established orthotopic cecal adenocarcinoma inhibited the further local growth of these tumors (Extended Data Fig. 4e) and spontaneous distant metastasis to liver and lung (Extended Data Fig. 4f,g).
Given growing recognition of the distinct biology, treatment responses and clinical outcomes of left- and right-sided CRC30, we sought to use anatomically accurate in vivo orthotopic human CRC models to recapitulate these discrete phenotypes. To model left-sided tumors, equal numbers of doxycycline-treated and untreated single cells derived from a human rectal organoid line were introduced as orthotopic intraluminal rectal transplants in mice in which the host mucosa was denuded by DSS treatment29. Orthotopic adenocarcinoma engraftment by patient-derived CRC organoids was significantly impaired by L1CAM knockdown, with fewer mice successfully engrafting with L1CAM-deficient than with L1CAM-proficient tumor xenografts (Fig. 5c and Extended Data Fig. 4h). Even when engraftment did occur, the area of rectal tumor engraftment was significantly smaller in mice receiving L1CAM-knockdown transplants (Fig. 5d,e). As we have previously shown in the brain, lung and bone8,9, L1CAM was required for efficient metastatic colonization by organoid xenografts after splenic injection of TdTomato-luciferase-labeled organoids (Fig. 5f,g and Extended Data Fig. 4i,j). We also tested organoids from a human BRAF-mutant right-sided CRC (CRC121Li; Extended Data Fig. 2a), a tumor type that develops via a distinct APC-independent serrated adenoma pathway31. Orthotopic cecal xenografts were generated and tested as above (Fig. 5h–l and Extended Data Fig. 4k). As with APC-mutant tumors, L1CAM knockdown in established orthotopic BRAF-mutant cecal tumors inhibited both further local progression (Fig. 5j) and distant metastasis (Fig. 5k,l).
Finally, we determined whether L1CAM inhibition could improve the efficacy of chemotherapy in treating established tumors. Irinotecan was chosen as the chemotherapeutic on the basis of the relative sensitivity of organoids to this agent, in comparison to other standard CRC chemotherapeutics (data not shown). Mice bearing subcutaneous organoid xenografts were maintained until tumors measured at least 100 mm3, randomized to treatment arms and maintained for 4 weeks before being killed. As seen in vitro (Fig. 2g and Extended Data Fig. 3e), the combination of chemotherapy with L1CAM knockdown significantly inhibited further tumor growth in comparison to chemotherapy alone (Fig. 5m–o and Extended Data Fig. 4l,m).
Taken together, the results suggest that L1CAM dependency is a shared property of metastatic CRC tumors independent of genotype, tumor sidedness and classical or serrated pathway of adenoma formation. L1CAM expression is dispensable for adenoma formation, but is required for local tumor growth, distant metastasis and therapy resistance, processes in which tumor cells must survive the loss of an intact epithelial niche. The results suggest that loss of epithelial integrity, a key step in tumor invasion and metastasis, induces and selects for L1CAM dependency in tumor-regenerating cells.
Plasticity of the L1CAMhigh phenotype.
During tumor organoid growth, cancer stem-like cells give rise to progeny that show progressive loss of stem cell markers32–34. We determined the distribution of L1CAM-expressing cells in patient-derived organoids. Whereas nascent oligocellular organoids expressed high levels of L1CAM, larger organoids contained a majority of L1CAMlow cells but retained high L1CAM expression at the periphery, suggesting that L1CAMhigh cells divide to generate both L1CAMhigh and L1CAMlow progeny (Fig. 6a). L1CAMhigh populations freshly sorted from patient-derived primary tumors or liver metastases consistently gave rise to both L1CAMhigh and L1CAMlow cells during organoid formation, as determined by flow cytometry (Extended Data Fig. 5a). Of note, although L1CAMlow cells from freshly obtained patient tumors generated fewer organoids (Fig. 1g), these cell populations gained L1CAM expression during organoid generation (Extended Data Fig. 5b). Moreover, mature intact organoids derived from normal colon, CRC primary tumors and metastases had lower average L1CAM mRNA levels than single cells derived from these organoids by mechanical disruption (Fig. 6b). These results suggested that organoid generation selects for L1CAM-expressing cells, which in turn generate heterogeneous L1CAMhigh and L1CAMlow progeny and increase L1CAM expression upon organoid dissociation.
Fig. 6 |. Plasticity of the L1CAMhigh phenotype.
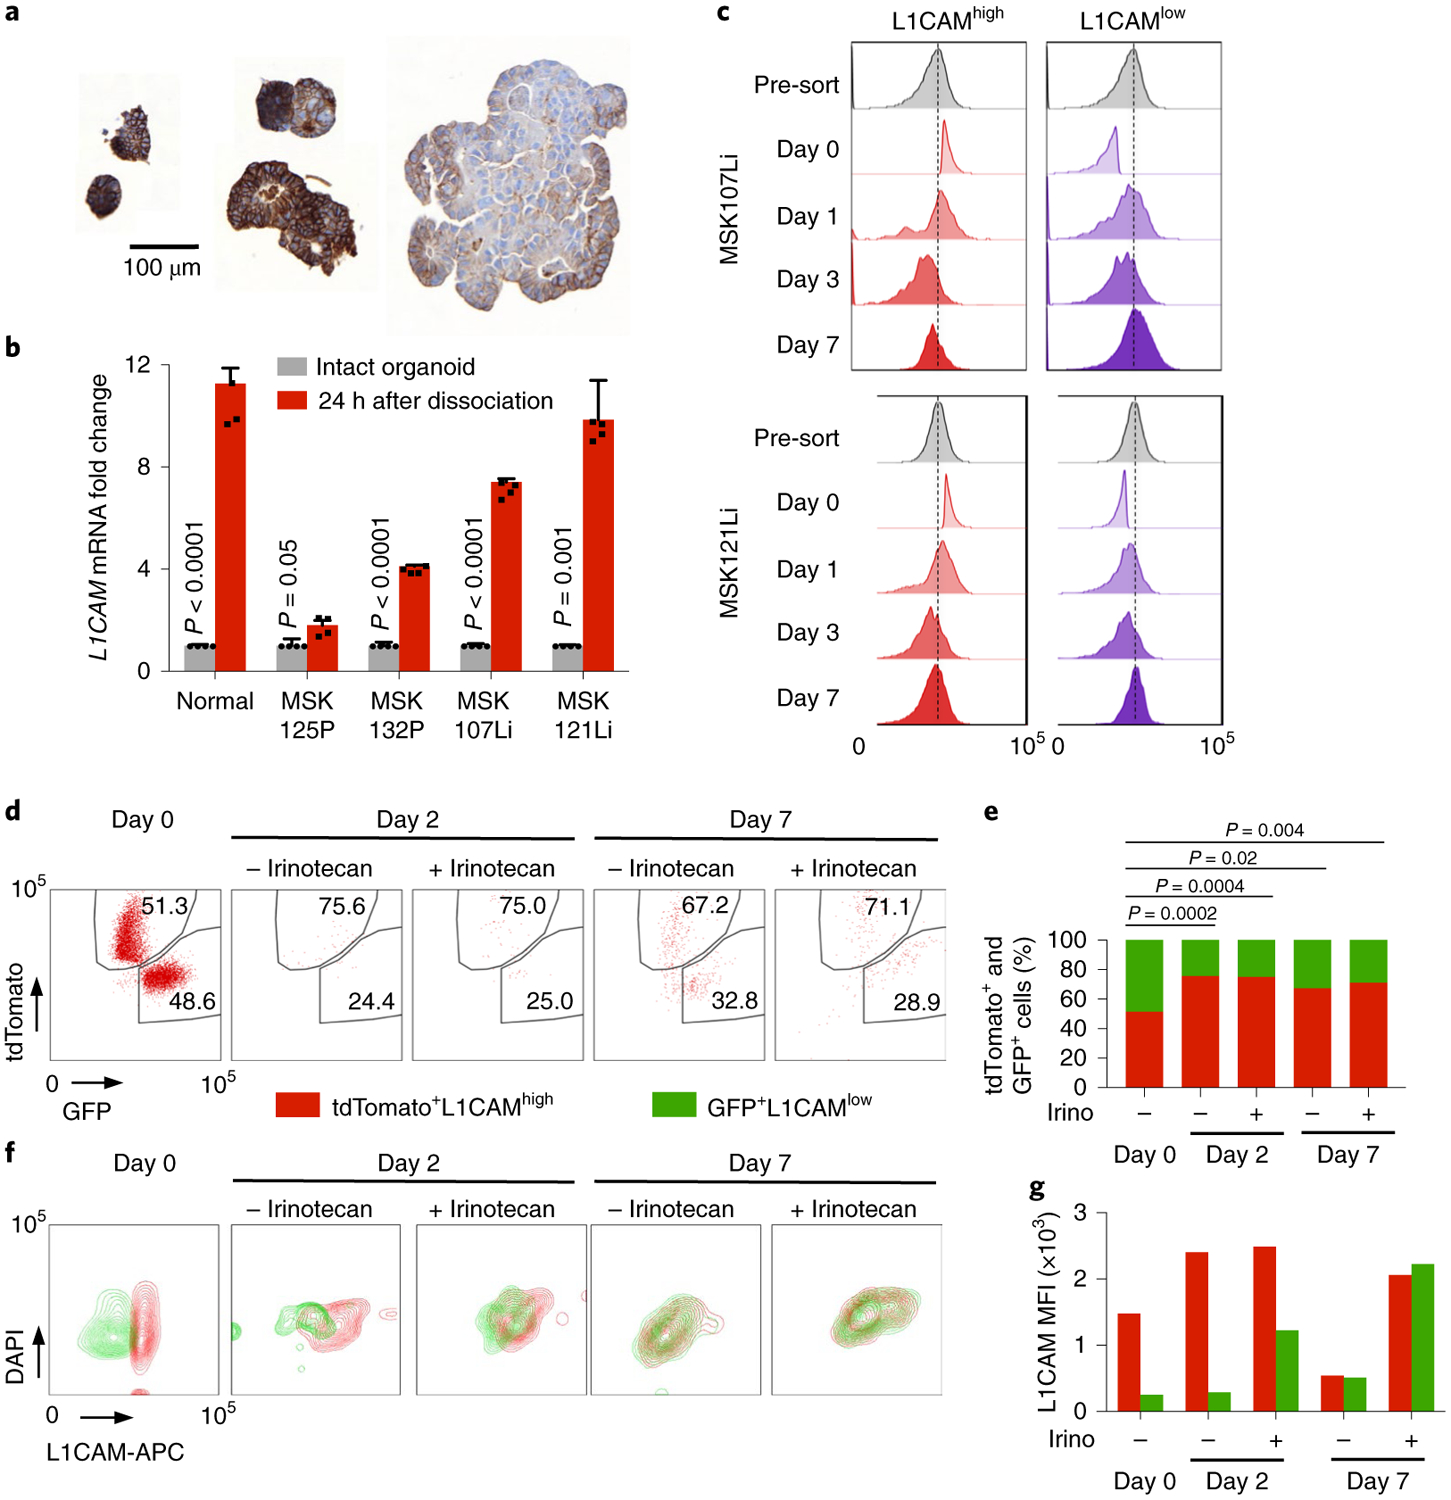
a, L1CAM expression is dynamically regulated during organoid growth. L1CAM immunohistochemistry of CRC organoids of varying size shows progressive restriction of L1CAM expression to cells at the periphery and an overall decrease in L1CAM expression with increasing organoid size. Representative of six organoid lines analyzed. b, L1CAM is induced by dissociation of normal, primary tumor and metastatic human organoids. Relative L1CAM mRNA levels, normalized to GAPDH mRNA levels (mean ± s.e.m.), were measured in intact organoids versus organoid-derived single-cell suspensions plated in Matrigel and assayed 24 h after dissociation. n = 4 replicates per group; two-sided Student’s t tests. c, Time course of regenerating organoids derived from L1CAMhigh (left) and L1CAMlow (right) cells flow-sorted from day 21 MSK107Li (top) and MSK121Li (bottom) organoids. Histograms show the distribution of L1CAM expression (measured by APC fluorescence) in each population at the indicated time points after flow sorting. Representative of three independent experiments. d,e, Dynamic induction of the L1CAMhigh phenotype by a subset of pre-existing L1CAMlow cells. CRC107Li organoids were labeled with lentivirally expressed tdTomato or GFP, and flow-sorted tdTomato+GFP−L1CAMhigh and tdTomato−GFP+L1CAMlow cells were mixed in equal proportions and allowed to regrow as organoids in the presence or absence of irinotecan. Flow plots of the distribution of tdTomato- and GFP-expressing cells (d) and the relative proportions of these cells in the population (e) are shown from monitoring by flow cytometry at the indicated time points after mixing; from left to right, n = 17, 107, 68, 251, 484 and 348 DAPI− single cells representative of three independent experiments with two organoid lines; two-sided chi-squared tests. f,g, Flow cytometry contour plots showing the distribution of L1CAM expression at the indicated time points in the presence or absence of chemotherapy (f) and median fluorescence intensity (MFI) of L1CAM expression (measured by APC) in cells derived from tdTomato+GFP−L1CAMhigh and tdTomato−GFP+L1CAMlow precursors on each day (g), representative of three independent experiments with two organoid lines.
To determine whether L1CAM expression is a static property of organoid-initiating cells or whether some of these cells can dynamically enter and exit an L1CAM-expressing state, we monitored the dynamics of the L1CAM expression phenotype during CRC organoid regeneration by L1CAMhigh and L1CAMlow cells (Fig. 6c). Although L1CAMhigh cells yielded more organoids than did L1CAMlow cells, the organoids generated by both populations contained L1CAMhigh and L1CAMlow cells and converged on a similar level of L1CAM expression per organoid after 7 d (Fig. 6c and Extended Data Fig. 5c). Annexin V and propidium iodide (PI) staining 24 h after dissociation demonstrated increased proportions of early apoptotic (Annexin V+PI−) and late apoptotic (Annexin V+PI+) cells in the L1CAMlow population in comparison to the L1CAMhigh population (Extended Data Fig. 5d). Conversely, apoptotic cells derived from both the L1CAMhigh and L1CAMlow populations showed lower L1CAM expression than viable cells (Extended Data Fig. 5e). Thus, low L1CAM expression in CRC cells was associated with increased apoptosis and a reduced ability to generate organoids.
Finally, we asked whether the ability of a small minority of pre-existing L1CAMlow cells to generate organoids could be explained by plasticity of L1CAMlow cells, which could dynamically adopt an L1CAM-expressing state during conditions of cellular stress. Because chemotherapy selects for an L1CAMhigh residual population (Figs. 1c–e and 2f), we sought to trace the lineage of organoid-generating cells in the presence or absence of chemotherapeutic stress by labeling the same organoid line with either TdTomato- or GFP-expressing lentivirus. Mutually exclusive TdTomato+GFP−L1CAMhigh and TdTomato−GFP+L1CAMlow cells were sorted (Extended Data Fig. 5f), mixed in equal proportions and allowed to regenerate organoids in the presence or absence of irinotecan. Flow cytometry analysis of viable tdTomato+ and GFP+ cells at 2 and 7 d after seeding demonstrated that the majority of viable cells were TdTomato+ and had thus originated from the pre-existing L1CAMhigh population (Fig. 6d,e). However, we also identified a minority population of GFP+L1CAMlow cells contributing to organoid generation. The GFP+L1CAMlow cells showed lower L1CAM expression than the tdTomato+L1CAMhigh population on day 2, but by day 7 no difference in L1CAM expression could be detected between the two populations (Fig. 6f,g). Irinotecan treatment did not change the proportions of TdTomato+ and GFP+ cells recovered, but the L1CAM expression level of the chemoresistant population was higher than that of the vehicle-treated population (Fig. 6f,g). In sum, the data indicate that pre-existing L1CAMhigh cells are the major source of stem-like, chemoresistant organoid-initiating cells. While the majority of L1CAMlow cells undergo apoptosis, limited plasticity exists, with some L1CAMlow cells dynamically reverting to an L1CAMhigh state and contributing to organoid formation.
Disruption of E-cadherin releases L1CAM from REST-mediated repression.
Finally, we sought to understand the mechanism by which epithelial cells gain entry into an L1CAMhigh phenotypic state. Loss of intestinal epithelial integrity by DSS administration in vivo or by disruption of organoids in vitro induced the expression of L1CAM. However, incubation with conditioned medium from mouse colitis, which contains a mixture of proinflammatory and anti-inflammatory cytokines, did not induce L1CAM expression in intact or dissociated CRC organoids (Extended Data Fig. 6a), nor did incubation with various individual recombinant cytokines associated with colitis or L1CAM-associated neuronal regeneration35,36. Transforming growth factor (TGF)-β slightly induced L1CAM expression, while interleukin (IL)-17A, brain-derived neurotrophic factor (BDNF) and persephin blunted the induction of L1CAM upon dissociation (Extended Data Fig. 6a). However, these cytokine effects were overshadowed by the strong L1CAM induction driven by the dissociation of organoids into single cells.
In non-neuronal tissues, the transcriptional repressor NSRF (also known as REST) prevents the expression of neuronal genes, including L1CAM37,38. Notably, REST was identified as a CRC tumor suppressor in a screen for anoikis inhibitors, and metastatic CRCs frequently acquire loss-of-function mutations or deletions in REST39. By using chromatin immunoprecipitation and sequencing (ChIP-seq), we found that REST was bound to an enhancer in the first intron of the L1CAM locus in metastatic CRC organoids, and this binding was reduced upon organoid dissociation (Fig. 7a and Extended Data Fig. 6b). In addition, we identified a distinct transcriptional program regulated by REST depending on the context of epithelial integrity. Upon dissociation, REST peaks were lost from the vicinity of a shared cohort of 1,026 genes in both MSK107Li and MSK121Li organoids, while 234 genes gained REST binding, suggesting conserved genome-wide changes in REST chromatin accessibility upon epithelial dissociation. Biocarta pathway analysis of the genes closest to REST peaks that were lost upon dissociation and shared by the two organoids identified several neuronal genes involved in synaptic transmission (Extended Data Fig. 6c). Dissociation of organoids into single cells caused downregulation of REST expression, with REST mRNA levels increasing over time as organoids regenerated (Fig. 7b and Extended Data Fig. 6d). L1CAM expression was inversely correlated with expression of REST, and shRNA-mediated knockdown of REST strongly induced the expression of L1CAM (Fig. 7b and Extended Data Fig. 6d). These data show that epithelial dissociation causes transcriptional downregulation of REST, in turn reducing REST occupancy of an L1CAM intronic enhancer and enabling L1CAM expression.
Fig. 7 |. Loss of E-cadherin-dependent cell contact downregulates REST and enables L1CAM expression.
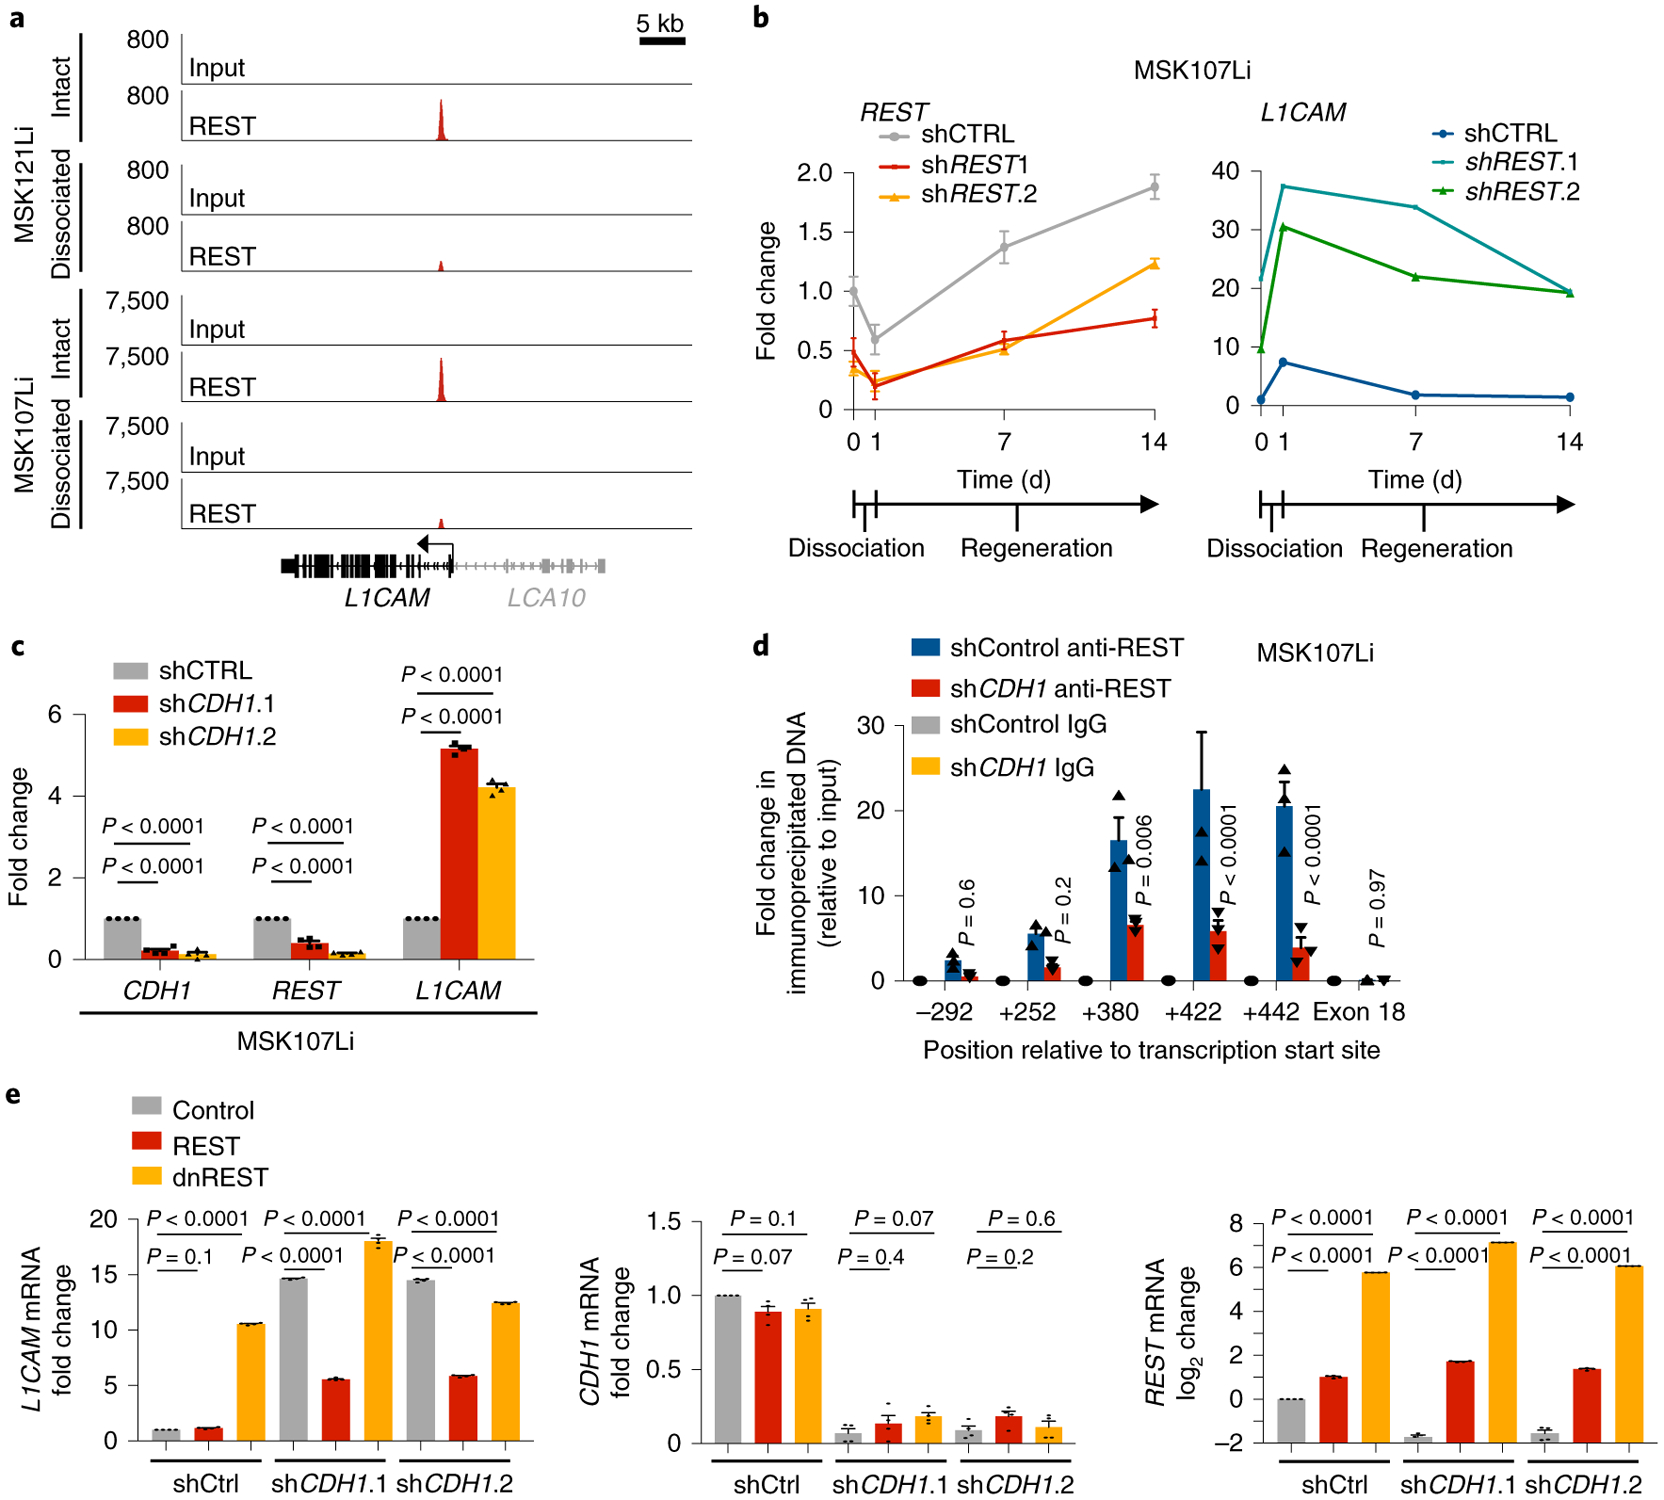
a, REST ChIP-seq analysis, showing diminution of the REST peak at the L1CAM intronic enhancer in dissociated organoid-derived cells, collected 16 h after dissociation, in comparison to intact organoids. Input control is also shown. LCA10 (gray) is not expressed in CRC organoids. Two independent organoid cultures from two patient-derived organoid lines were analyzed per condition. b, Relative mRNA levels (mean ± s.e.m.) of REST and L1CAM in intact MSK107Li organoids (day 0), cells collected 24 h after dissociation and plating as single cells (day 1), and cells collected at the indicated time points during organoid regeneration. Organoids were transduced with lentivirus constitutively expressing shRNA targeting REST or control shRNA. Gene expression was normalized to GAPDH mRNA levels. Day 1 shControl versus shREST.1: P < 0.0001 (REST), P < 0.0001 (L1CAM); day 1 shControl versus shREST.2: P = 0.007 (REST), P < 0.0001 (L1CAM); n = 4 organoid cultures per sample per time point; two-sided Student’s t tests. c, Relative expression of CDH1, REST and L1CAM (mean ± s.e.m.) in intact MSK107Li organoids transduced with lentivirus constitutively expressing shRNA targeting CDH1 or control shRNA. n = 4 organoid cultures per group; two-sided Student’s t tests. d, ChIP-PCR using antibodies against REST or isotype-control immunoglobulin in intact MSK107Li organoids transduced with lentivirus constitutively expressing shRNA targeting CDH1 or control shRNA. Fold enrichment (mean ± s.e.m.) is shown relative to the corresponding 2% input. PCR primers were selected to amplify immunoprecipitated DNA at the indicated positions relative to the L1CAM transcriptional start site. P values correspond to the comparison between shControl anti-REST and shCDH1 anti-REST; n = 3 organoid cultures per condition; two-sided Student’s t tests. e, Induction of L1CAM expression by E-cadherin knockdown can be rescued by REST but not by dominant-negative REST (dnREST). Relative mRNA levels of L1CAM, CDH1 and REST are shown in MSK107Li organoids stably expressing shRNA targeting CDH1 or control shRNA as well as cDNA expressing REST or dnREST. Gene expression was normalized to the mRNA levels of GAPDH. Data are shown as the mean ± s.e.m.; n = 4 organoid cultures per group; two-sided Student’s t tests.
Structural integrity in intact epithelia is secured by E-cadherin homophilic cell-cell contacts in adherens junctions, whereas epithelial disruption during tissue dissociation or tumor invasion and dissemination displaces E-cadherin from the cell membrane40. shRNA-mediated knockdown of CDH1 (encoding E-cadherin) in metastatic CRC organoids significantly induced L1CAM transcription, even in intact organoids, and reduced REST mRNA levels and REST binding to the L1CAM intronic enhancer (Fig. 7c,d and Extended Data Fig. 6e). In turn, overexpression of REST inhibited L1CAM expression in CDH1-knockdown organoids, whereas overexpression of a dominant-negative form of REST consisting only of the DNA-binding domain and lacking the ability to recruit co-repressors41 induced L1CAM expression (Fig. 7e). Inducible knockdown of REST enhanced the generation of CRC organoids, and this effect was abrogated by knockdown of L1CAM (Fig. 8a,b). These results indicate that REST acts downstream of E-cadherin to inhibit the expression of L1CAM in CRC cells. The disengagement of E-cadherin at the cell membrane causes transcriptional downregulation of REST, which in turn leads to derepression of L1CAM.
Fig. 8 |. Epistasis analysis of E-cadherin, REST and L1CAM.

a, L1CAM inhibition rescues the increase in organoid generation secondary to REST inhibition. MSK107Li organoids stably expressing the indicated shRNAs were grown in the presence or absence of doxycycline for 7 d before measuring cell viability (luminescence relative to day 0; in box plots, boxes show the 25th–75th percentile with the median, and whiskers show the minimum-maximum; n = 6 organoid cultures per group; two-sided Mann-Whitney U tests). b, Relative mRNA levels of L1CAM and REST on day 0, normalized to GAPDH, in organoid-derived cells transduced with lentiviruses directing expression of the indicated shRNAs in the presence or absence of doxycycline. Data are shown as the mean ± s.e.m.; n = 4 organoid cultures per group; two-sided Student’s t tests. c, Left: schematic diagram showing how loss of epithelial integrity induces L1CAM expression during wound healing and tumor invasion, ultimately driving metastatic relapse. Right schematic diagram showing that loss of membrane E-cadherin in cells detached from their epithelial niche downregulates and displaces REST from the L1CAM enhancer, thus enabling L1CAM expression.
Discussion
Disruption of epithelial integrity is an obligatory step in the metastatic cascade. Cancer cells detaching from intact epithelial structures to invade the mucosal basal membrane, disseminating as single cells or small clusters through the blood or lymphatic circulation, or infiltrating distant organs and surviving as residual disease after therapy must evolve mechanisms to cope with the loss of supportive epithelial cell-cell contacts. Our analysis identifies L1CAM expression as a crucial requirement for regrowth during intestinal wound healing and metastatic tumor regrowth (Fig. 8c, left). The principal driver of L1CAM expression is loss of epithelial integrity itself, acting via loss of E-cadherin cell-cell junctions to relieve a program of REST-dependent repression and plasticity that includes L1CAM as a direct target in regenerative progenitor cells (Fig. 8c, right). REST downregulation is emerging as a critical mediator of neuroendocrine differentiation and of aggressive metastasis and poor survival in epithelial malignancies, including lung cancer42 and castration-resistant prostate cancer43,44. More broadly, a growing body of evidence is implicating chromatin deregulation, via global increases in chromatin accessibility45 or enhancer reprogramming by specific transcription factors46, in the acquisition of regenerative capacity both in metastasis and in tissue repair after injury26,47. The phenotypic plasticity derived from loss of epithelial integrity may provide evolutionary space for the emergence and selection of regenerative traits that favor metastasis. Notably, not all cells within tumors have the ability to induce L1CAM and reinitiate growth upon epithelial disruption. The mechanisms that impose limits on such regenerative plasticity and regulate contextual quiescence of L1CAM-expressing cells remain to be uncovered.
This work underscores the distinct requirements for adenoma-initiating stem cells and tumor-propagating metastasis-initiating cells and the dynamic nature of these stem-like states. Oncogenic mutations in homeostatic LGR5high stem cells at the base of intestinal crypts are responsible for tumor initiation, that is, uncontrolled proliferation to form adenomas within intact epithelial mucosa14. When LGR5 is ablated, other cell types may serve as adenoma-initiating cells after they dynamically adopt an LGR5high state48–50. Similarly, we find that, while L1CAM expression is required for organoid and metastasis initiation, L1CAM expression does not represent a fixed cell fate; a subset of L1CAMlow cells retain the capacity to re-express L1CAM and enter a regenerative state upon tissue disruption. L1CAM is not required for adenoma initiation, but is required for tumor propagation as organoids, orthotopic tumors and distant metastases. Epithelial cells that do not normally function as homeostatic stem cells can nevertheless drive regeneration in multiple contexts15,51–54, and the LGR5 gene expression signature is downregulated in regenerating intestinal epithelia during DSS-induced colitis55. We show that metastasis-derived organoid cells express high levels of both L1CAM and the revival stem cell program required for intestinal repair15, but do not necessarily express LGR5. Our findings suggest that metastatic outgrowth mimics the regenerative state that emerges after colitis.
An important implication of these findings is that studies aimed at identifying therapeutic targets for metastatic cancer should not rely on tumor initiation models alone and must instead use pre-clinical cancer models that recapitulate the L1CAMhigh metastasis-initiating cell state. This distinction is also relevant to the frequently noted discrepancies between two widely employed assays of stemness1, in which cancer stem cells have multilineage differentiation potential in serial transplantation assays of dissociated cells56–58, but are only unipotential in lineage tracing experiments in intact epithelia59,60. Although this study focuses on CRC, L1CAM expression has been documented across multiple cancers10 and in metastasis to multiple organ sites9. Our work demonstrates that entry into an L1CAMhigh phenotypic state is a conserved requirement for cancer cells with diverse genotypes to survive the loss of an epithelial niche during tumor dissemination and therapy, thus underscoring the importance of L1CAM as a potential therapeutic target. By elucidating the contexts in which L1CAM dependency emerges, this work directly informs a clinical development strategy for L1CAM-inhibitory molecules—as adjuvant treatment for surgically resectable early-stage disease to treat disseminated residual disease and in metastatic disease in combination with chemotherapy to debulk rapidly proliferating cells while exposing the dependency of resistant metastasis-initiating cells on L1CAM.
Methods
Clinical samples.
All human tissues were obtained under Memorial Sloan Kettering Institutional Review Board biospecimen research protocols 14–244 and 15–101. All patients provided pre-procedure informed consent. Tissue was generally processed within 1 h of surgical resection. Archival formalin-fixed, paraffin-embedded (FFPE) clinical tissue blocks for immunostaining were identified by database search and chart review. Tissue processing and histopathological data interpretation were overseen by an expert gastrointestinal pathologist (J.S.).
Immunostaining.
Human tissues were fixed in formalin and mouse tissues were fixed in 4% paraformaldehyde for 24 h before paraffin embedding. Immunostaining was performed on 5-μm sections via standardized automated protocols on a Ventana Discovery XT machine with the following antibodies: anti-L1CAM (clone 14.10, BioLegend), anti-Ki67 (clone 30–9, Roche) and anti-E-cadherin (clone 24E10, Cell Signaling). For dual LGR5 FISH and L1CAM immunofluorescence, freshly cut 3-μm paraffin sections were stained with the RNAscope 2.5 LS Brown kit (ACD, 322100) for FISH and the Bond Polymer Refine Detection kit (Leica, DS9800) for immunofluorescence on a Leica Bond RX instrument following routine manufacturer protocol ACD 2.5 DAB and Protocol F, using RNAscope 2.5 LS probe for human LGR5 (ACD, 311028) and anti-L1CAM antibody (clone 14.10, BioLegend) with Tyramide Alexa Fluor 594 (Life Technologies, B40957) instead of the DAB step. An Ultra-High-Def mouse-on-mouse kit (StatLab) was used for mouse L1CAM staining. For Ki67 and L1CAM scoring, stained serial sections with overlapping morphology were aligned with the SIFT algorithm and the extent of immunostaining was scored with ImageJ software. L1CAM staining in Extended Data Fig. 4l,m was scored with ImageJ software. All other immunostaining was visually scored in a blinded fashion.
Primary organoid culture.
Primary human and mouse normal and tumor organoid culture was adapted from previously described protocols11,12. Normal colon crypts were isolated with 8 mM EDTA in PBS as described. Human tumor samples were grossly dissected from colon mucosa (primary tumors) or from liver or peritoneum (metastases), washed, chopped into 5-mm fragments and incubated in dissociation buffer (DMEM with 5% FBS (Gibco), 2 mM l-glutamine (Fisher Scientific), penicillin-streptomycin (Fisher Scientific), 40 μg ml−1 gentamicin (Thermo Fisher Scientific), 250 U ml−1 type III collagenase (Worthington) and 1 U ml−1 dispase (Sigma-Aldrich)) on a shaker for 30 min at 37 °C, filtered through a 70-μm cell strainer (Greiner Bio-One), centrifuged at 600g for 5 min and washed with ADF (Advanced DMEM/F12, Thermo Fisher Scientific). Cells were counted and resuspended in Matrigel at approximately 2,000–10,000 cells per 40 μl of Matrigel in uncoated CELLSTAR multiwell culture plates (Greiner Bio-One). After Matrigel polymerization, HISC medium (Advanced DMEM/F12 containing 100 ng ml−1 Wnt-3a (R&D; or conditioned medium from L-Wnt3A cells (ATCC)), 1 μg ml−1 R-Spondin1 (Peprotech; or conditioned medium from m-RSpo-Fc cells (a kind gift of C. Kuo, Stanford University), 50 ng ml−1 EGF, 50 ng ml−1 Noggin (Peprotech), 10 nM gastrin (Sigma), 10 mM nicotinamide (Sigma), 500 nM A8301 (Sigma), 10 μM SB202190, 10 mM HEPES, 2 mM glutamine, 2 mM N-acetylcysteine, 1 μM PGE2 (Sigma), 1:100 N2 (Invitrogen), 1:50 B27 (without vitamin A) and 100 μg ml−1 Primocin (InvivoGen)) was added. Y27632 (10 μM; Sigma) was added for initial organoid generation and for 48 h after every passage. Where indicated, cells were flow-sorted before resuspension and plating in Matrigel. After ≥6 months in culture, MSK107Li, MSK121Li, MSK125P and MSK132P organoids were subjected to targeted exome sequencing via MSK-IMPACT61. Key oncogenic genomic alterations in each organoid were identified by OncoKB62 and were compared to clinical sequencing of diagnostic tumor tissue to validate the conservation of genomic alterations between the organoids and the tumors from which they were derived.
Lentiviral transduction of organoids was performed as described63. For experiments, organoids were collected from Matrigel with cell recovery solution (Corning) and, where indicated, were treated with TrypLE (Thermo Fisher Scientific) for 10 min at 37 °C and filtered through a 70-μm cell strainer to generate single cells. Cells were plated at a density of 2,000 cells per 40 μl of Matrigel and incubated at 37 °C for 24 h before collection for downstream assays. Y27632 was not added to the medium during experiments. Organoid growth and viability were monitored by CellTiter-Glo or Caspase-Glo luminescence cell viability assays (Promega) according to the manufacturer’s instructions at various time points. For inducible knockdown experiments, organoids were maintained in HISC medium supplemented with 200 ng ml−1 doxycycline (Fisher Scientific) for 2 d before dissociation and downstream assays. For chemoresistance experiments, 50–100 μM irinotecan (Sigma-Aldrich) was added to the organoid medium.
Cell culture.
L-Wnt3A and m-RSpo-Fc cell lines were maintained in DMEM supplemented with 10% FBS and 2 mM l-glutamine. Conditioned medium was collected weekly and stored at −80 °C until use. For lentivirus production, 293T cells were cultured in DMEM supplemented with 10% FBS and 2 mM l-glutamine. All cells tested negative for mycoplasma.
Flow cytometry.
Dissociated freshly obtained tumors or organoids were passed through a 70-μm filter and stained with the following antibodies: anti-EpCAM-FITC (clone Ber-EP4, Dako), anti-human L1CAM-APC (clone UJ127, Novus Biologicals), anti-mouse L1CAM-APC (clone 555, Miltenyi Biotec), anti-EphB2-PE (clone 512012, Thermo Fisher Scientific), anti-CD133-PE-Vio770 (clone AC133, Miltenyi Biotec) and anti-CD44-BV410 (clone G44–26, BD Biosciences). Apoptosis was assayed with an Annexin V FITC/PI Dead Cell Apoptosis kit (Thermo Fisher Scientific). Flow sorting was performed with a BD FACSAria II cell sorter fitted with a 100-μm nozzle. Analysis was performed with a BD LSR/Fortessa. Cells stably transduced with LT3Revir were sorted on the basis of Venus expression. Flow cytometry data were analyzed with FlowJo software (Treestar).
Mouse studies.
All animal experiments were performed in accordance with protocols approved by the Memorial Sloan Kettering Cancer Center Institutional Animal Care and Use Committee (IACUC). C57BL/6J (strain 000664), Vil1-cre (B6.Cg-Tg(Vil1-cre)997Gum/J; 004586), Apcfl/fl (C57BL6-APCtm1Tyj/J; 009045), Lgr5-EGFP-IRES-creERT2 (B6.129P2-Lgr5tm(cre/ERT2)/Cle/J; stock 008875), KrasLSL-G12D (B6.129S4-Krastm4Tyj/J; stock 008179), Trp53fl/fl (B6.129P2-Trp53tm1Brn/J; stock 008462), athymic nude (Foxn1nu; stock 002019) and NSG (NOD.Cg-PrkdcscidIL2rgtm1Wjl/SzJ; stock 005557) mouse strains were obtained from the Jackson Laboratory13,25,28,64,65. KrasLSL-G12D, Trp53fl/fl and Lgr5-EGFP-IRES-creERT2 mice were backcrossed onto a C57BL/6J background for at least six generations in the Lowe laboratory. L1camfl/fl mice were a gift of M. Schachner (Shantou University Medical College and Rutgers University)24. Mice were inbred on a C57BL/6J background to generate the necessary crosses. Because L1cam is on the X chromosome, male mice were used for experiments involving this allele to minimize the number of breeding generations and mice needed. All experiments included littermate controls. To induce colitis, 8- to 10-week-old mice were given 3–3.5% (wt/vol) DSS (molecular weight 40–50 kDa; Affymetrix) in their drinking water (provided ad libitum) for 5 d, followed by 12 d of water without DSS, before being killed. Where indicated, L1CAMΔLGR5, WTΔLGR5 and L1CAMfl/y mice were administered daily intraperitoneal injections (2 mg per 20 g of mouse weight) of tamoxifen (Sigma, 20 mg ml−1 in corn oil) for five consecutive days before initiating DSS-induced colitis. Colitis was scored with previously validated clinical and histological scores66. Colon paraffin sections were prepared from mice killed at IACUC-approved humane endpoints or on day 14, stained with H&E, antibodies or Kreyberg-Jareg stain67, and scored with blinding to mouse treatment. For tumor initiation experiments, mice were killed at 3 months of age and colons were collected, flushed with PBS and stained with 0.2% methylene blue (LabChem) for 5 min before destaining and scoring of tumor numbers and size under a dissection microscope (Leica). Colons were subsequently processed for immunostaining as above.
AKP organoids were generated, functionally selected and PCR genotyped as described previously29, labeled with TdTomato-luciferase and injected into the splenic vein of athymic nude mice. Once liver metastases were apparent by bioluminescence imaging, the mouse was killed, the liver was collected and the tumor was dissociated and cultured under organoid conditions in selective medium to isolate a liver-colonizing AKP organoid line.
For all transplantation experiments, athymic nude or NSG mice matched to the sex of the organoid were obtained from the Jackson Laboratory and transplanted at 6 weeks of age68. For subcutaneous xenografts, the indicated cell numbers were mixed with 50% Matrigel in 100 μl of PBS and implanted subcutaneously. Tumor length (L), width (W) and height (H) were measured with Vernier calipers, and tumor volume was calculated with the formula (L × W × H)/2. Orthotopic rectal and splenic vein transplantation was performed as described previously29. For orthotopic cecal injections, 4 × 10⁵ cells from liver-metastatic mouse AKP and MSK121Li organoids labeled with TdTomato-luciferase were mixed with 50% Matrigel in 50 μl of PBS and injected into the cecal submucosa of athymic nude and NSG mice, respectively69. Bioluminescence imaging was performed on an IVIS Spectrum Xenogen instrument (Caliper Life Sciences) and analyzed with Living Image software v2.50. Experimental group sizes were practically determined on the basis of cages (five mice per cage), with n ≥ 5 mice per group. For inducible knockdown experiments, mice were maintained on doxycycline food pellets (2,500 mg kg−1; Envigo). Where indicated, irinotecan (50 mg kg−1 per mouse in 200 μl of water; Sigma-Aldrich) was injected intraperitoneally on a weekly basis for four consecutive weeks.
Single-cell RNA sequencing.
Day 21 organoids were dissociated with TrypLE for 10 min, passed though a 70-μm filter, flow-sorted and resuspended in 0.04% BSA in PBS. Single-cell suspensions with average viability of 90% were loaded onto the 10x Genomics Chromium platform to recover 5,000 single-cell-containing gel beads in emulsion (GEMs) per sample. scRNA-seq libraries were prepared according to 10x Genomics protocols (Single Cell 3′ Reagent Kits, User Guide PN-120233) with a SimpliAmp Thermal cycler (Thermo Fisher Scientific) for GEM reverse transcription (53 °C for 45 min followed by 85 °C for 5 min; held at 4 °C). GEMs were subsequently broken, and single-stranded cDNA was cleaned up with DynaBeads MyOne Silane Beads (Thermo Fisher Scientific). The SimpliAmp Thermal cycler (Thermo Fisher Scientific) was used to amplify cDNA. cDNA quality was analyzed with an Agilent Bioanalyzer 2100, and cDNA was fragmented to ~450 bp, end-repaired and A-tailed with the manufacturer’s fragmentation enzyme mix. Reaction products underwent double-sided cleanup with 0.6× and 0.8× SPRI beads (Beckman Coulter) and were ligated to adaptors. Indexes provided in the kit were used to introduce a unique sample index for each library through 12 or 14 cycles (according to cDNA yield) of PCR amplification. Libraries were subjected to double-sided SPRI cleanup (0.6× and 0.8× beads) and quantified by Qubit fluorometric quantification (Thermo Fisher Scientific), and quality was assessed on an Agilent Bioanalyzer 2100. Two sample libraries per lane were pooled on a HiSeq 2500 instrument in rapid mode at a loading concentration of 10.5 pM. Libraries were sequenced on a paired-end-read flow cell, 26 cycles for read 1 (16 bp 10× barcode + 8bp UMI), followed by 8 cycles for I7 index (sample index) and 98 cycles for read 2 (transcript). scRNA-seq data were demultiplexed and processed from raw reads to a molecule count array using the SEQC pipeline70. Viable cells were distinguished from captured ambient mRNA on the basis of library size by constructing an empirical cumulative density function of cell sizes and finding the minimum of its second derivative. Additionally, cells with low-complexity libraries were filtered out by regressing the number of genes detected per cell against the number of molecules contained in that cell. Genes detected in fewer than ten cells or genes with low expression levels, identified as those with count values <5 s.d. from the second mode on the distribution of counts per gene, were also excluded from downstream analysis. After filtering, a total of 9,974 cells with a median library size of 10,502 molecules per cell were processed for downstream analysis. The filtered count matrix was then normalized by dividing the expression level of each gene in a cell by the cell’s total library size and then scaling by the median library size of all cells. For downstream analysis, the normalized count matrix was denoised and imputed with the MAGIC algorithm71. The first 20 principal components (accounting for >90% of variance in data) were used to construct a Markov transition matrix with parameters k = 21 and t = 3, and the data were left multiplied by the powered matrix. t-Distributed stochastic neighbor embedding (t-SNE) was used to visualize subpopulation structure based on the first 20 principal components of the imputed count matrix. A biaxial plot showing the distribution of all cells based on their L1CAM and LGR5 expression was generated. Five distinct cell types were identified on the basis of the distribution of L1CAM and LGR5 imputed expression with a Gaussian mixture model (GMM). Human genes corresponding to mouse genes in the revival stem cell signature15 were mapped with Homologene (Supplementary Table 2), and the expression of the summed gene sets and individual genes comprising epithelial-mesenchymal transition and fatty acid metabolism signatures was visualized with t-SNE, violin plots or heat maps.
Knockdown, knockout and overexpression constructs.
For L1CAM knockout, CRISPR guides were cloned into lentiCRIPSR v2 (Addgene, 42230). Doxycycline-inducible L1CAM knockdown was achieved by mirE-based shRNAs cloned into the all-in-one LT3Revir72. Stable knockdown of CDH1 and REST was achieved with shRNAs cloned with a mir30 background in the pGIPZ vector (Dharmacon): CDH1: V3LHS_346821, V3LHS_346823; REST: V2LHS_57043, V3LHS_384221. Where indicated, pLVX plasmid directing the expression of TdTomato or GFP and luciferase was transduced into organoids and stable transfectants were selected by flow sorting. The sequences of the sgRNAs and shRNAs targeting human L1CAM and mouse L1cam used in this study are in Supplementary Table 2. LT3Revir vectors contained no antibiotic selection marker, and transduced cells were selected by flow sorting for Venus+ cells. Lentiviral vectors to express REST (VB180628–1157wmp) and dnREST (VB180720–1142mys) were constructed by VectorBuilder. Detailed vector information, including cDNA insert sequences, is available on the VectorBuilder website (https://en.vectorbuilder.com/design/retrieve.html).
Reverse transcription and qPCR.
Total RNA was extracted from organoids, crypts or dissociated cells with the RNeasy Mini kit (Qiagen) or the RNAqueous Micro kit (Invitrogen). Tissue was extracted from OCT frozen tumor cores with a Tissue Lyser LT (Qiagen), followed by TRIzol (Invitrogen) RNA extraction. Total RNA (1 μl) was used to prepare cDNA with the Transcriptor First-Strand cDNA synthesis kit (Roche). qPCR was performed with TaqMan gene expression assay primers (L1CAM: Hs01109748_m1, Mm00493049_m1; LGR5: Hs00969422_m1; CDH1: Hs01023895_m1; REST: Hs00958503_m1; Thermo Fisher Scientific), and expression levels were normalized to the expression of GAPDH (Hs02758991_g1, Mm99999915_g1; Thermo Fisher Scientific) on an ABI Viia7 Real-Time PCR System (Applied Biosystems).
Extracellular matrix binding assays.
Solid-phase L1CAM ligand binding assays used recombinant human L1CAM (human Fc tag, R&D Systems; His tag, Thermo Fisher Scientific), UltraPure BSA (Thermo Fisher Scientific), purified mouse laminin-111 (Sigma-Aldrich), purified mouse collagen IV (Cultrex, R&D Systems), purified human collagen V (Sigma-Aldrich), recombinant human tenascin C (R&D Systems) and recombinant human laminin-411, laminin-421, laminin-511 and laminin-521 (Biolamina). 96-well Maxisorp plates (Nunc) were coated overnight at 4 °C with 30 nM recombinant protein, washed with PBS and blocked with protein-free blocking buffer (TBS, Thermo Fisher Scientific) for 2 h at room temperature. Human L1CAM (Fc tag) in PBS was added to the wells, and plates were incubated for 1 h at room temperature and washed three times with 0.1% Tween-20 in PBS (PBS-T). HRP-conjugated anti-human IgG (Thermo Fisher Scientific; 0.5 μg ml−1 in PBS) was added to wells for 1 h at room temperature, plates were washed three times in PBS-T and enzyme activity was measured with 1-Step Ultra TMB ELISA substrate (Thermo Fisher Scientific) on a Synergy H1 Plate Reader at 450 nm.
To assay the L1CAM dependency of organoid cell adhesion to basement membrane, MSK121Li organoids were treated with doxycycline (200 ng ml−1) or left untreated for 48 h, dissociated and incubated for 24 h at 37 °C as single cells. 96-well Maxisorp plates (Nunc) were coated overnight at 4 °C with 30 nM laminins (purified mouse laminin-111 and recombinant human laminin-411, laminin-421, laminin-511 and laminin-521) or mouse collagen IV. After washing with sterile PBS and blocking with 5% (wt/vol) BSA (Fisher Scientific; 1 h at room temperature), 100 μl of cell suspension (3 × 10⁴ cells per ml) in ADF was added to the wells and cells were allowed to adhere for 1 h at 37 °C. Then, wells were washed three times with prewarmed ADF and adherent cells were quantified by CellTiter-Glo assay (Promega), with data normalized to the luminescence detected immediately after cell seeding to calculate the percentage of adherent cells.
Cytokine treatment.
Intact or dissociated day 14 organoids were washed with ADF and incubated with serum-free HISC medium containing cytokines (IL-6 (20 ng ml−1), IL-22 (20 ng ml−1), IL-17A (100 ng ml−1), IL-1β (20 ng ml−1), TGF-β (100 ng ml−1), BDNF (50 ng ml−1), NTN (100 ng ml−1) and persephin (100 μg ml−1). Conditioned medium from inflamed cells was generated by culturing washed colons collected on day 14 from three mice treated with DSS as described above. Colons were cut longitudinally, washed three times and incubated for 24 h in 1 ml of serum-free ADF. Supernatants were filtered through a 70-μm filter, centrifuged for 10 min at 20,000g and added to organoids for 24 h of culture before collecting organoids for RT-PCR.
Chromatin immunoprecipitation and sequencing.
Organoids were grown from single cells for 14 d before processing. Intact organoids and dissociated cells prepared as above were fixed (1% formaldehyde for 10 min at room temperature), and reactions were quenched with 1.25 mM glycine for 5 min. Fixed cells were processed for ChIP as described previously73, with 2 μg of antibody against REST (clone 07–579, Millipore Sigma) for ChIP-PCR or 5 μg for ChIP-seq. The PCR primers used are listed in Supplementary Table 2. ChIP-seq reads were trimmed and filtered for quality by using version 0.4.5 of TrimGalore! with a quality setting of 15 (--quality 15), backed by version 1.15 of cutadapt and version 0.11.5 of FastQC74,75. Reads were aligned to mm9 with version 2.3.4 of Bowtie2 (ref.76), and deduplication was performed with MarkDuplicates in version 2.16.0 of Picard Tools. Regions enriched for REST binding signal were determined by calling peaks in ChIP-seq reads with version 2.1.1.20160309 of MACS2 (ref.77) with 0.001 as the P-value threshold, and peak calls with a q value above 0.01 were discarded. Differentially enriched REST ChIP-seq peaks were called using HOMER’s mergePeaks program in version 4.9 of HOMER, with a distance setting of 100 bp (--d 100)78. The annotatePeaks program from HOMER was used to identify the transcriptional start sites closest to the called peaks. To visualize ChIP-seq read density with IGV, the bamToBed, slopBed (read extension setting 200) and genomeCoverageBed (scale factor 10 × 106 fragments) programs in version 2.27.1 of BEDtools79 and the wigToBigWig program from v359 of UCSC Tools were used to generate for each sample a bigWig file from the aligned BAM file.
Statistics and reproducibility.
Statistical analyses are described in detail for each figure panel. No statistical method was used to predetermine sample size. Mann-Whitney, Wilcoxon rank-sum, t, Mantel-Cox and chi-squared tests were performed with GraphPad Prism. The number of samples (n) has been indicated for each figure panel. Randomization and blinding were used as indicated for each figure panel. Mice that died within 24 h of surgery were assumed to have died because of procedure-related complications and were excluded from analysis. No other data were excluded. All experiments were reproducible.
Reporting Summary.
Further information on research design is available in the Nature Research Reporting Summary linked to this article.
Extended Data
Extended Data Fig. 1 |. Association of L1CAM expression with invasion, post-therapy residual disease and stemness.
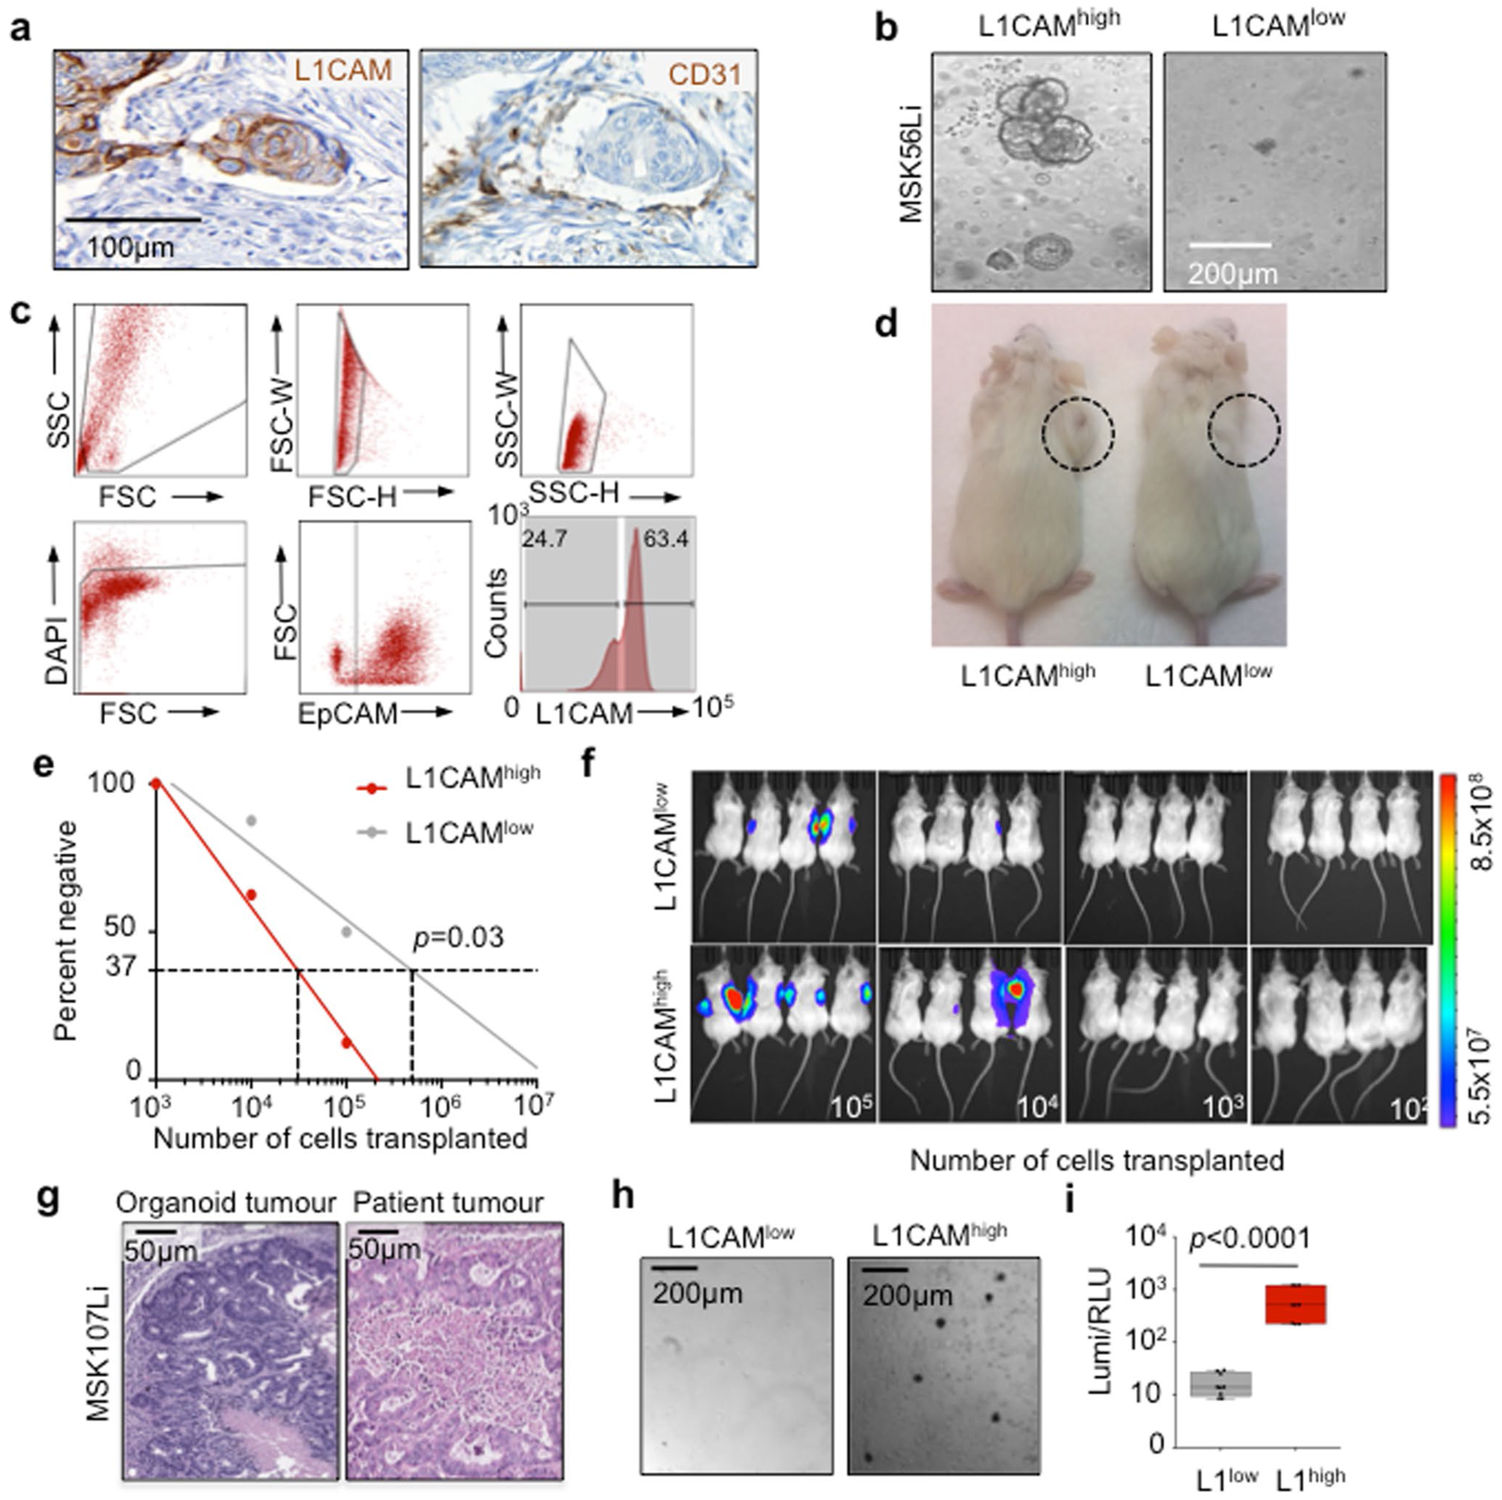
a, Immunohistochemistry of serial sections of the primary tumour invasion front in a patient sample (refer to Fig. 1a) showing a cluster of L1CAM-expressing cells (left) invading a CD31 positive blood vessel (right). b, Representative brightfield image of organoids grown from L1CAMhigh (left) or L1CAMlow (right) cells flow-sorted from freshly resected patient CRC liver metastases. Representative of 7 patient tumours. c, Gating strategy for flow cytometry/sorting of epithelial cells from fresh CRC liver metastasis surgical specimens. Bottom right: histogram of mode normalized cell counts based on L1CAM expression. Gates identify L1CAMhigh and L1CAMlow cells in the EpCAM + population. Representative of 7 patient tumours d, Representative image showing subcutaneous tumour growth in mice transplanted with 50,000 organoid-derived flow-sorted L1CAMhigh (left) or L1CAMlow (right) cells. Representative of 5 mice per group. e, In vivo limiting dilution assay. NSG mice were transplanted with the indicated numbers of FACS sorted L1CAMhigh or L1CAMlow cells derived from MSK107Li organoids (n = 8 injections per dilution per group, 2 injections per mouse). Tumour formation was assayed 90 days following injection. Tumour-initiating cell frequency by limiting dilution analysis was 1 in 31,027 for L1CAMhigh cells, 1 in 491,441 for L1CAMlow cells (p = 0.03, χ2 test). f, Day 90 bioluminescent images (n = 8 injections per dilution per group, 2 injections per mouse). g, CRC metastasis organoid-derived xenografts retain patient tumour morphology. Hematoxylin & eosin staining of matched MSK107Li patient CRC liver metastasis (top) and organoid-derived subcutaneous xenograft (bottom) showing similar glandular tumour histology surrounding central necrosis. Representative of 4 tumour/organoid pairs (h, i) L1CAMhigh cells in organoid-derived xenografts retain selective organoid generation capacity. h, Brightfield images and i, viability (luminescence) of organoids grown from flow-sorted L1CAMlow (left) or L1CAMhigh (right) cells plated at 2000 cells/40μL matrigel in organoid media, 14 days following sorting. Boxplots, boxes show 25th-75th percentile with median, whiskers show min-max, n = 9 independently plated wells each, representative of 3 experiments from independent xenografts, two-sided Mann-Whitney U test.
Extended Data Fig. 2 |. Relationship between L1CAM expression and stemness.
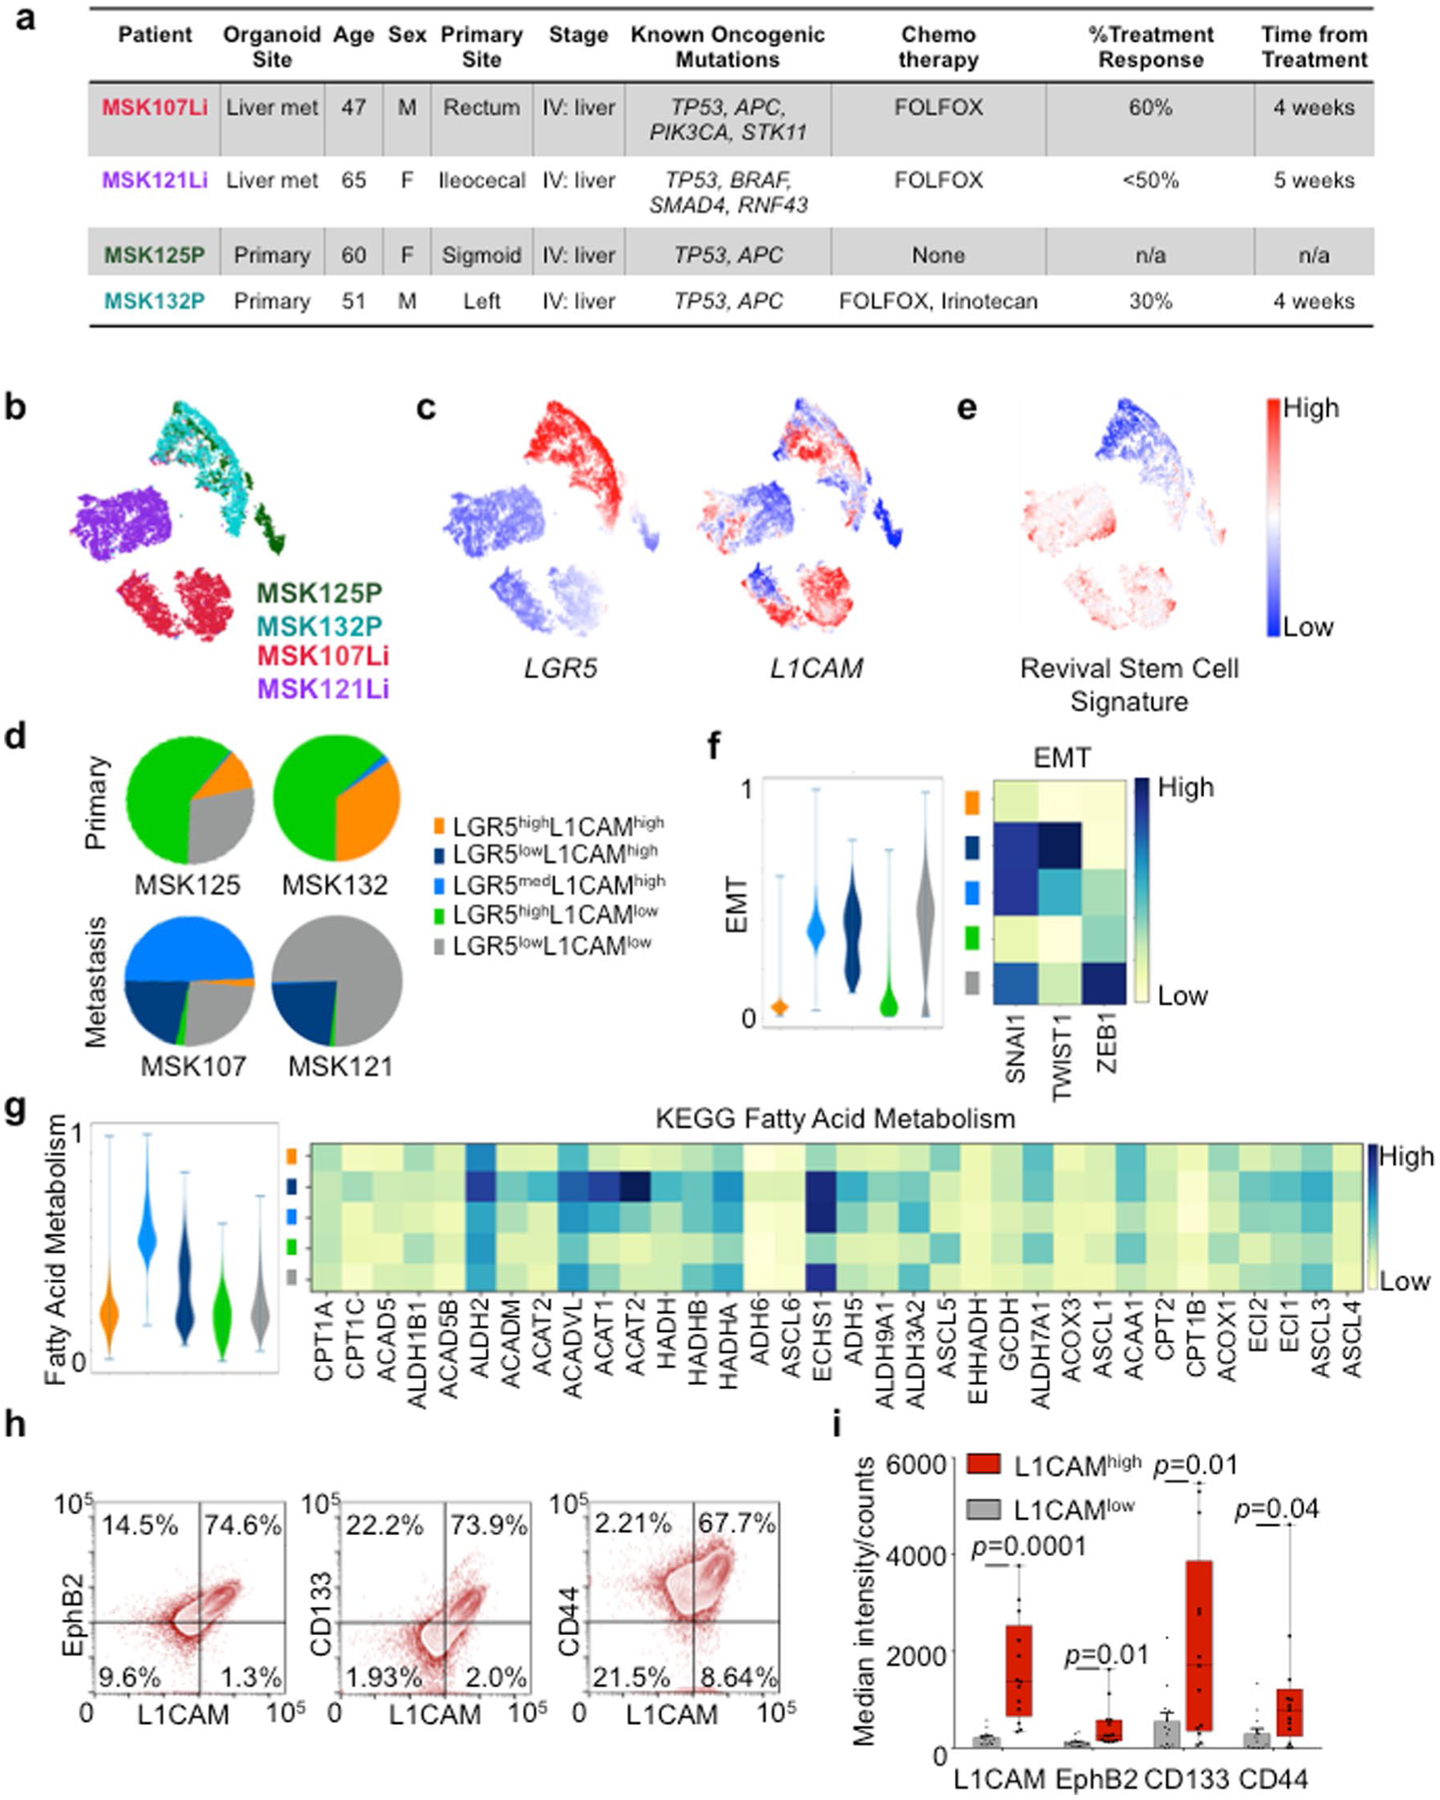
a, Summary of clinical, genetic and treatment features of the patient-derived organoids assayed by scRNA-seq. Organoids were profiled using MSK-IMPACT next-generation sequencing to determine the presence of known oncogenic mutations based on OncoKB annotations. FOLFOX = 5-fluorouracil, leucovorin, oxaliplatin. (b–g) scRNAseq analysis of 9,974 cells from 4 patient-derived CRC organoids. (b, c) tSNE projection of all cells analysed, b, colored by patient, c, indicating expression levels of LGR5 and L1CAM (red = high, blue = low), d, Population distribution of L1CAM/LGR5 subpopulations identified in each primary tumour or metastasis organoid assayed. e, tSNE projection indicating expression of the revival stem cell signature (red = high, blue = low) (f, g) Violin plots (left) indicating expression of an EMT signature (f) or the KEGG fatty acid metabolism signature (g) comprising the genes shown on the heatmaps (right) in each L1CAM/LGR5 subpopulation. Bars indicated min to max. Heatmaps indicate relative expression of the indicated genes in each cluster. h, Flow cytometric analysis of stem cell marker expression in L1CAMhigh and L1CAMlow epithelial cells from freshly resected human CRC liver metastases, gated as in Figure S1C. Representative (of 12 independent patient tumours) flow cytometry contour plots showing stem cell marker expression in EpCAM+cells. i, Median EphB2, CD133 and CD44 expression in L1CAMhigh and L1CAMlow cells sorted from freshly resected and dissociated patient CRC liver metastases. Boxplots, boxes show 25th–75th percentile with median, whiskers show min-max, n = 12 tumours (one tumour per patient), two-sided Mann-Whitney U test.
Extended Data Fig. 3 |. L1CAM is required for laminin binding, survival and organoid regeneration by single cells.
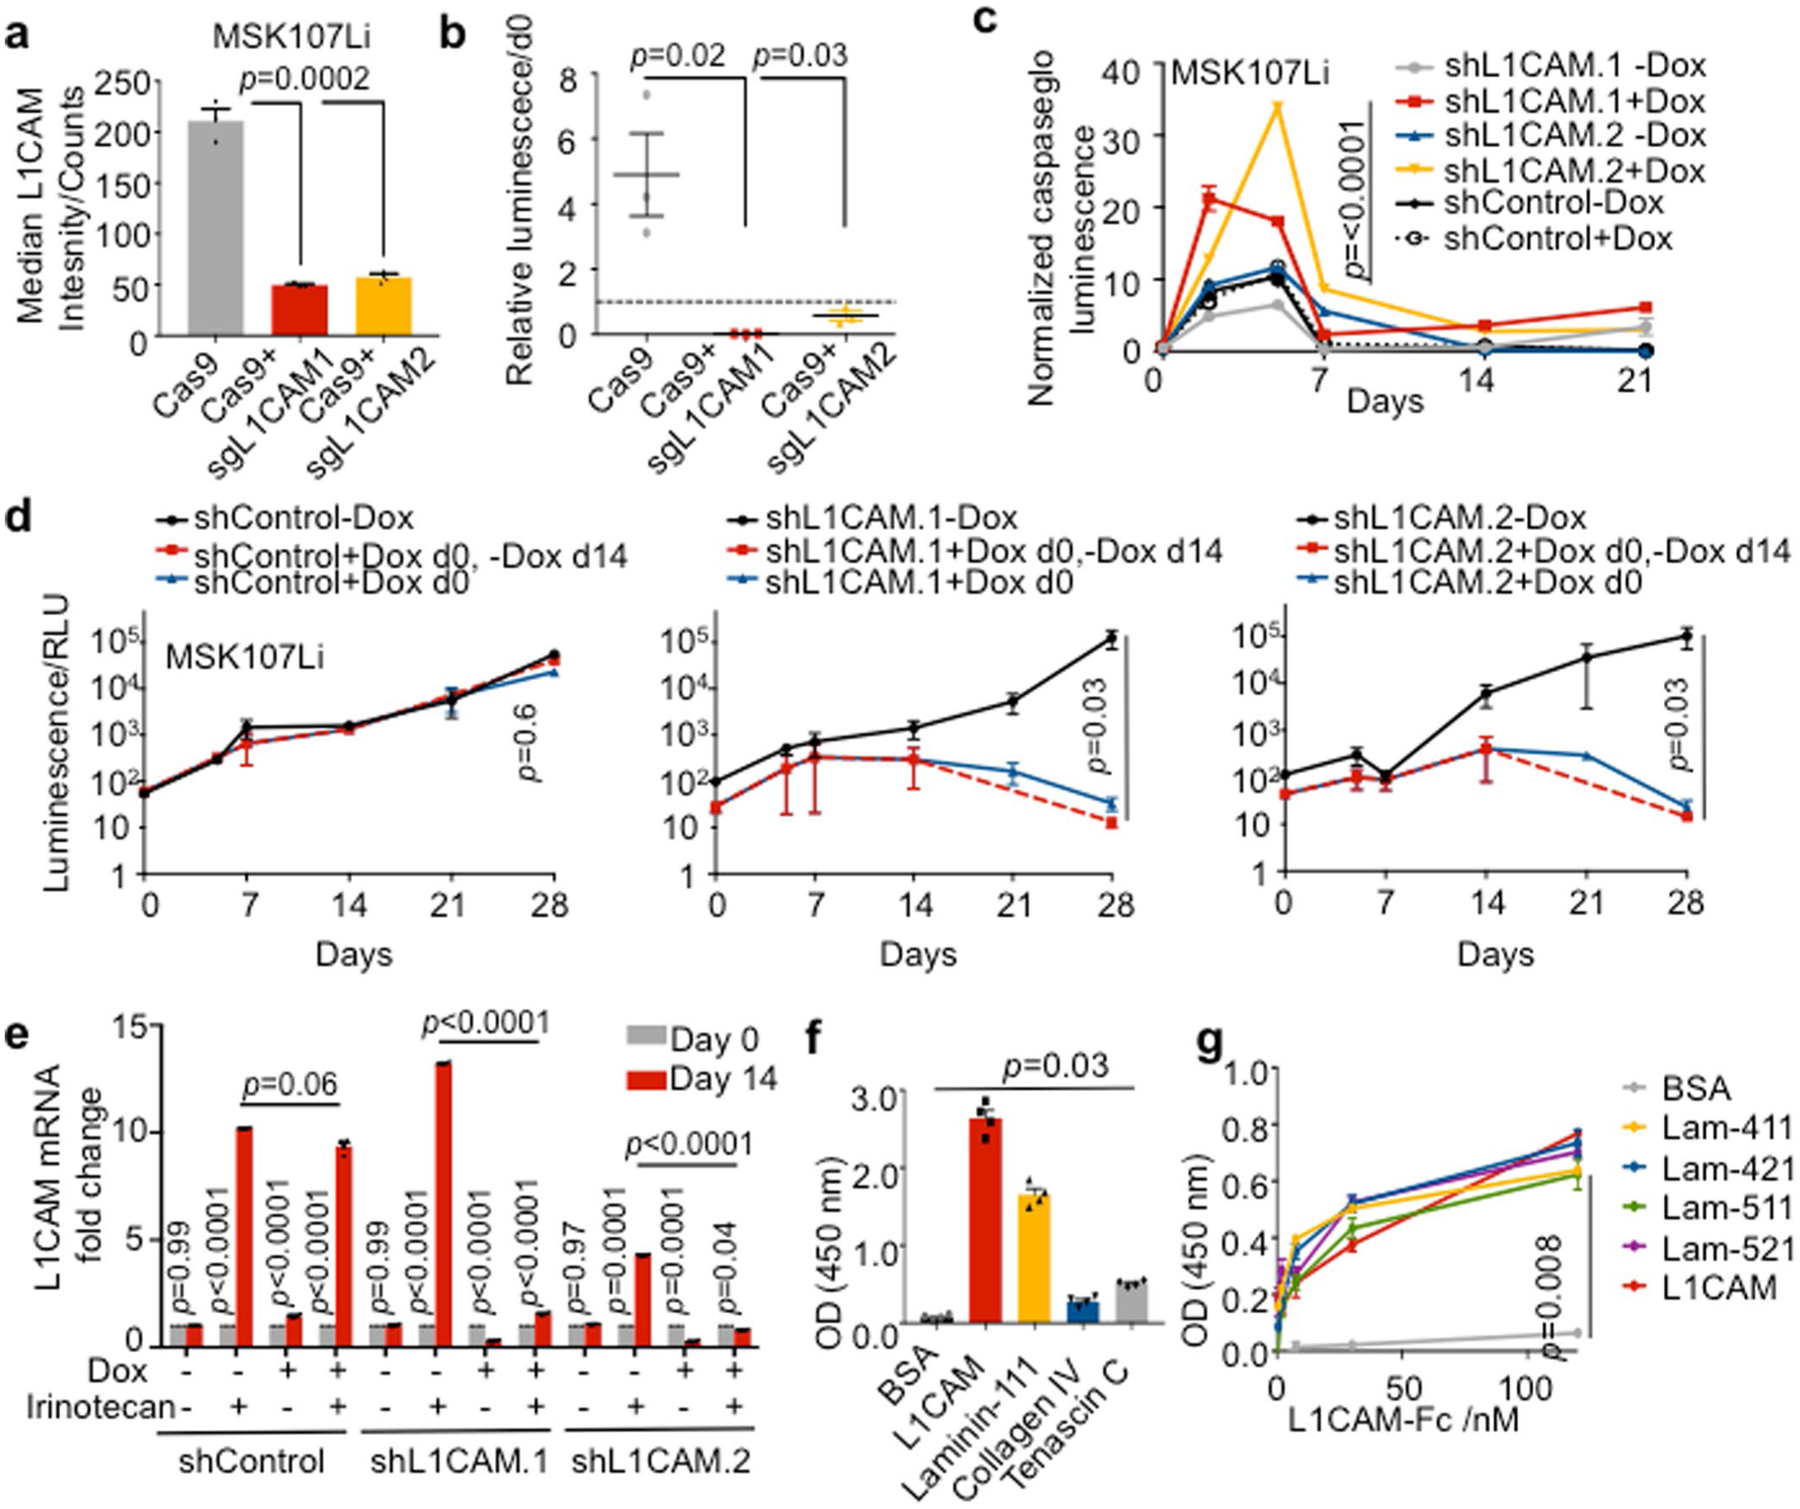
a, L1CAM protein expression by flow cytometry (median ± s.e.m.) of MSK107Li cells 14 days following transduction with plasmids expressing Cas9 alone or together with sgRNA targeting L1CAM, shown as a percentage of the population transduced with Cas9 alone. n = 3 replicates per group, two-sided Student’s t-test. b, FACS sorted cells were seeded at a concentration of 2000 cells/40 μL and permitted to grow for 14 days. Viability assay showing luminescence (mean ± s.e.m.) of each population relative to luminescence on day 0 (dashed line); n = 3 organoid cultures per group, two-sided Mann-Whitney U test. c, Relative caspase-glo luminescence (mean ± s.e.m.) at the indicated timepoints during MSK107Li organoid growth relative to the time of single cell seeding (day 0). Data were normalized to cell viability measured at the same time points. (n = 3 organoid cultures per timepoint, p values compare shL1CAM.1-Dox vs. shL1CAM.1 + Dox and shL1CAM.2-Dox vs. shL1CAM.2 + Dox, two-sided Student’s t tests). d, MSK107Li organoid-derived single cells expressing a doxycycline-inducible L1CAM shRNA or control were seeded in the presence or absence of doxycycline as indicated. After 14 days, culture media was aspirated and replaced with doxycycline-free media, and permitted to grow for a further 14 days prior to measuring cell viability (luminescence, mean ± s.e.m.). n = 3 organoid cultures per timepoint, two-sided Mann-Whitney U test. e, Relative L1CAM mRNA expression (mean ± s.e.m.) in steady-state day 14 organoids, or residual organoid cells following 14 days of treatment with doxycycline and/or irinotecan as indicated. Data were normalized to GAPDH mRNA expression levels. n = 4 organoid cultures, two-sided Student’s t tests. f, Solid phase assay showing binding of 120 nM recombinant human L1CAM-Fc to plates coated with 30 nM of each of the indicated ligands. L1CAM-Fc was detected using HRP-conjugated anti-human IgG, chromogenic substrate was added and OD(450 nM) measured. Mean ± s.e.m., n = 4 wells per condition, representative of 2 independent experiments, two-sided Mann-Whitney U test. g, Dose-response curves showing binding of increasing concentrations of recombinant human L1CAM-Fc to plates coated with 30 nM of each of the indicated ligands. L1CAM-Fc was detected using HRP-conjugated anti-human IgG, chromogenic substrate was added and OD(450 nM) measured. Mean ± s.e.m., n = 5 wells/dose/condition, two-sided Mann-Whitney U test.
Extended Data Fig. 4 |. L1CAM is dispensable for adenoma formation but required for orthotopic tumour engraftment, local expansion, metastasis and chemoresistance.
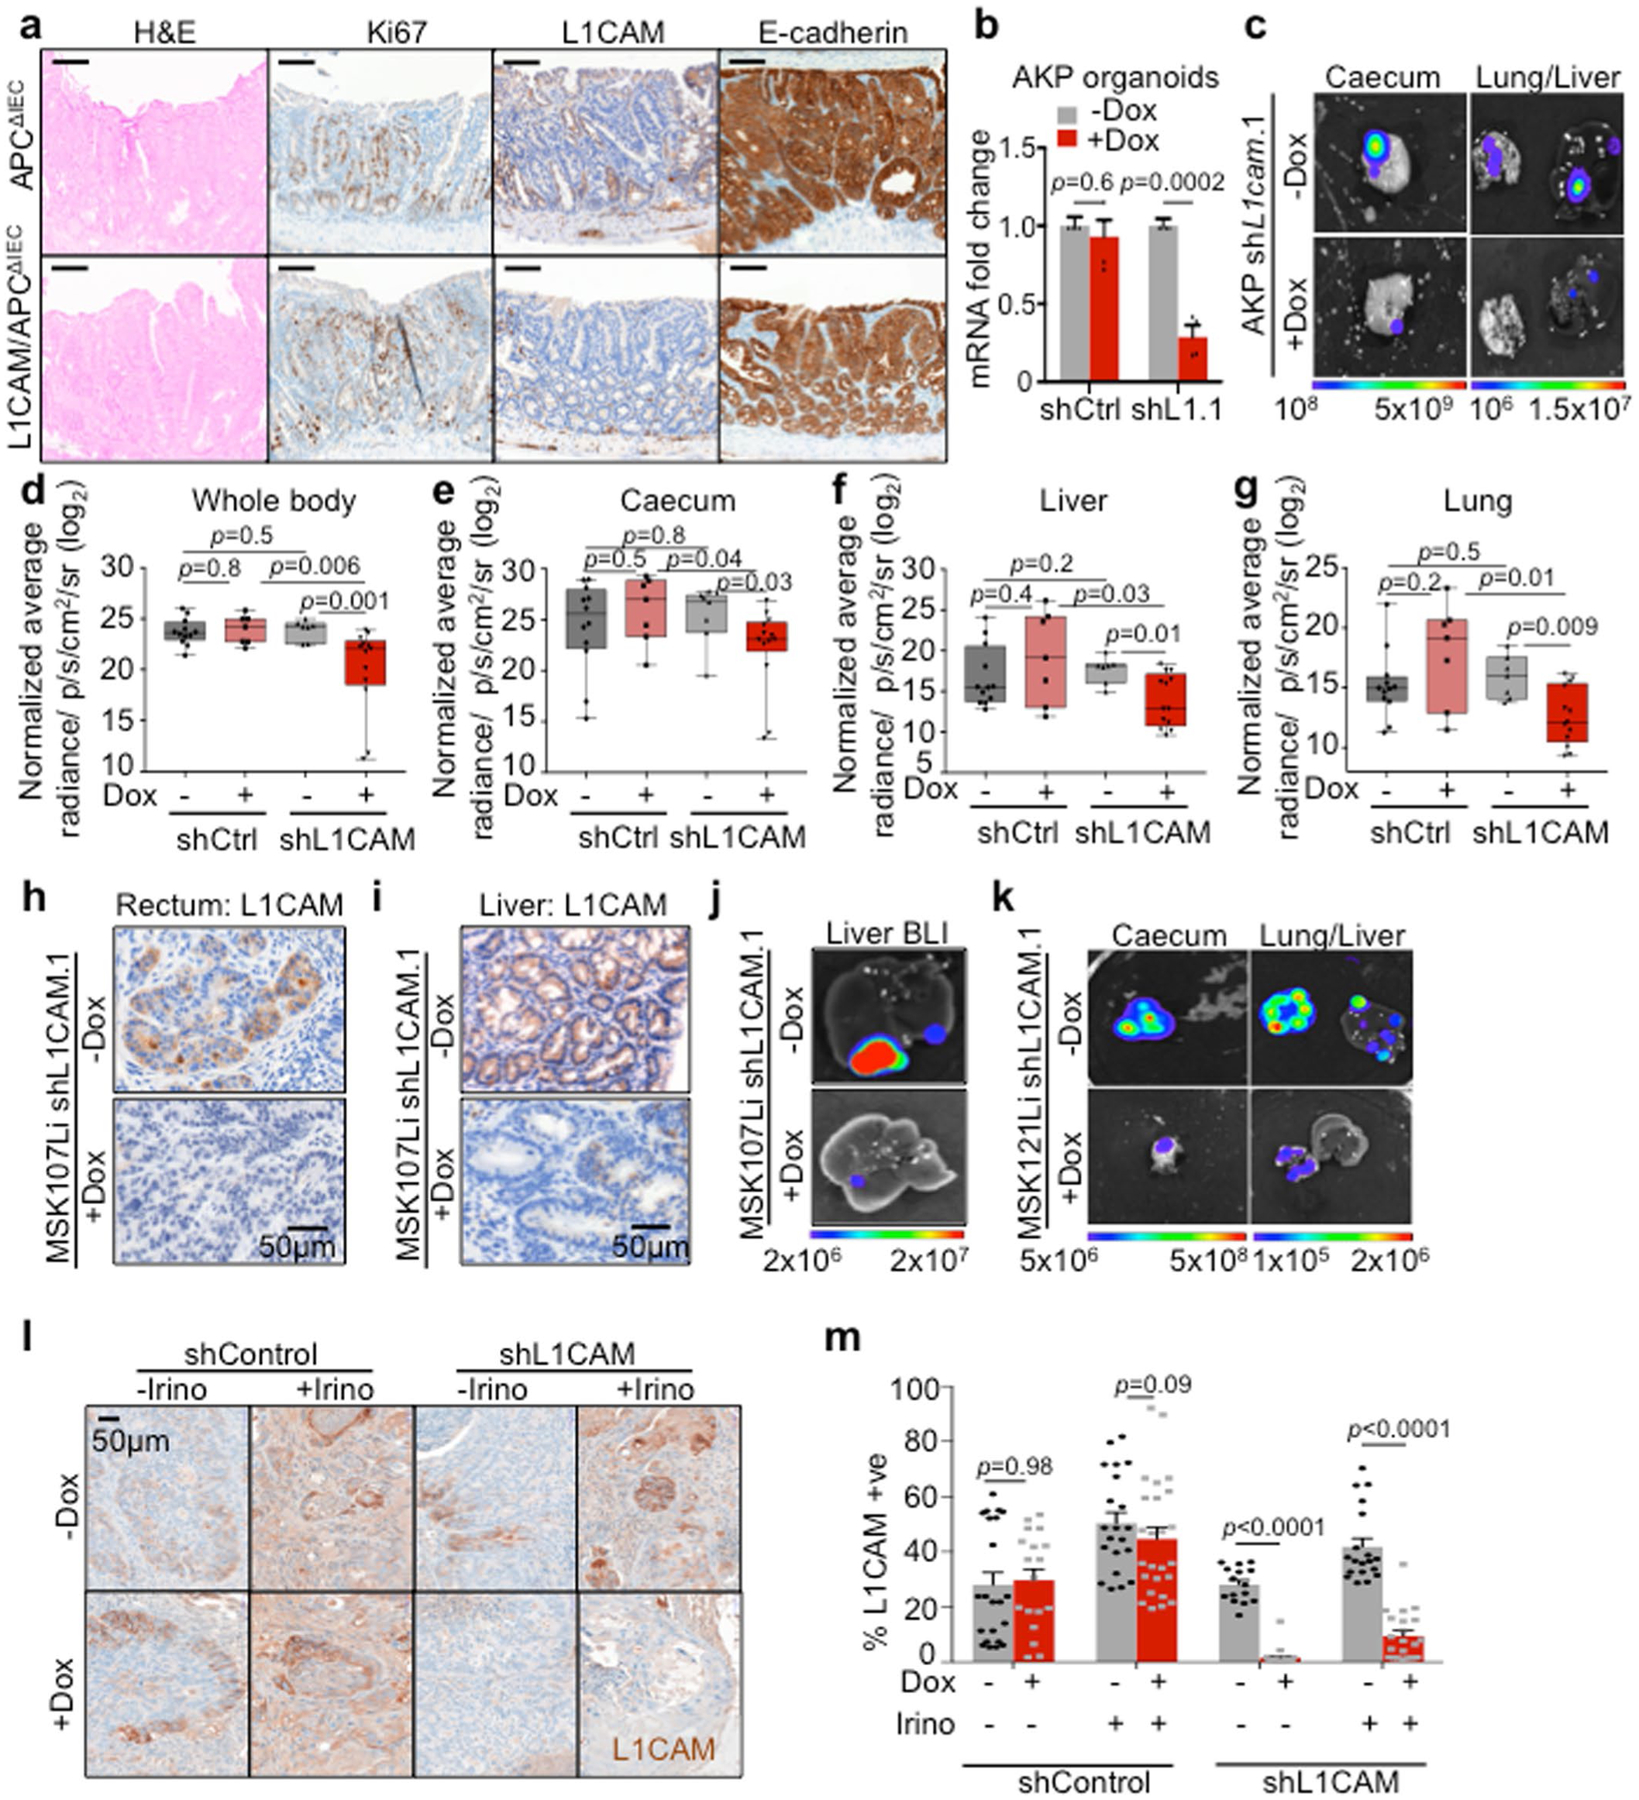
Representative sections of colons from APCΔIEC and L1CAM/APCΔIEC mice stained with hematoxylin & eosin, and antibodies against Ki67, L1CAM or E-cadherin, showing no histopathological differences between the two groups. Representative of 5 mice in each group. (b–g) L1CAM inhibition impairs local tumour expansion and metastasis from murine orthotopic caecal transplants. b, Relative L1cam mRNA expression (mean ± s.e.m) in murine AKP organoids stably transduced with lentivirus directing the expression of doxycycline-inducible shRNA targeting L1cam or control, and treated with or without doxycycline for 48 h. Data were normalized to Gapdh mRNA expression levels. n = 4 organoid cultures, two-sided Student’s t test. c, Dissociated cells derived from AKP organoids transduced with lentivirus directing the expression of tdTomato-luciferase and shRNA against L1cam or control were injected into the caecal submucosa. Mice were monitored until caecal tumours were evident by ex vivo BLI imaging 3 weeks following injection, randomized based on BLI signal, and maintained on or off doxycycline diet for 5 weeks prior to euthanasia. Representative of 7 (−Dox), 13 mice (+Dox). (d–g) Quantification of whole animal or ex vivo BLI signal in each indicated organ per group, normalized to BLI at the time of randomization, is shown. Boxplot, boxes show 25th–75th percentile with median, whiskers show min to max, n = 12, 7, 7, 13 mice per group (left to right), two-sided Mann-Whitney U test. h, L1CAM immunohistochemistry in sections of orthotopic rectal xenografts (representative of 3 animals analysed per group) or i, liver metastases (representative of 3 animals analysed per group) from mice injected with cells derived from MSK107Li organoids expressing doxycycline-inducible shRNA targeting L1CAM. Mice were maintained on or off doxycycline (dox) diet as indicated. j, Representative (n = 8 (−Dox), n = 9 (+Dox)) ex vivo liver bioluminescence images related to i. k, Representative (n = 12 (−Dox, n = 11 (+Dox)) bioluminescent images of orthotopic caecal xenografts, liver and lung metastases derived from MSK121Li organoids expressing doxycycline-inducible shRNA targeting L1CAM, and randomized to treatment with or without doxycycline. (l, m) L1CAM immunohistochemistry in sections of subcutaneous xenograft tumours derived from MSK107Li organoids expressing doxycycline-inducible shRNA targeting L1CAM. Mice were treated with doxycycline diet and/or irinotecan chemotherapy as indicated. Mean ± s.e.m, n = 22, 15, 21, 19, 18, 23, 25, 21 fields from 3 mice per group (left to right), two-sided Mann-Whitney U test.
Extended Data Fig. 5 |. Apoptosis and plasticity of L1CAMlow cells.
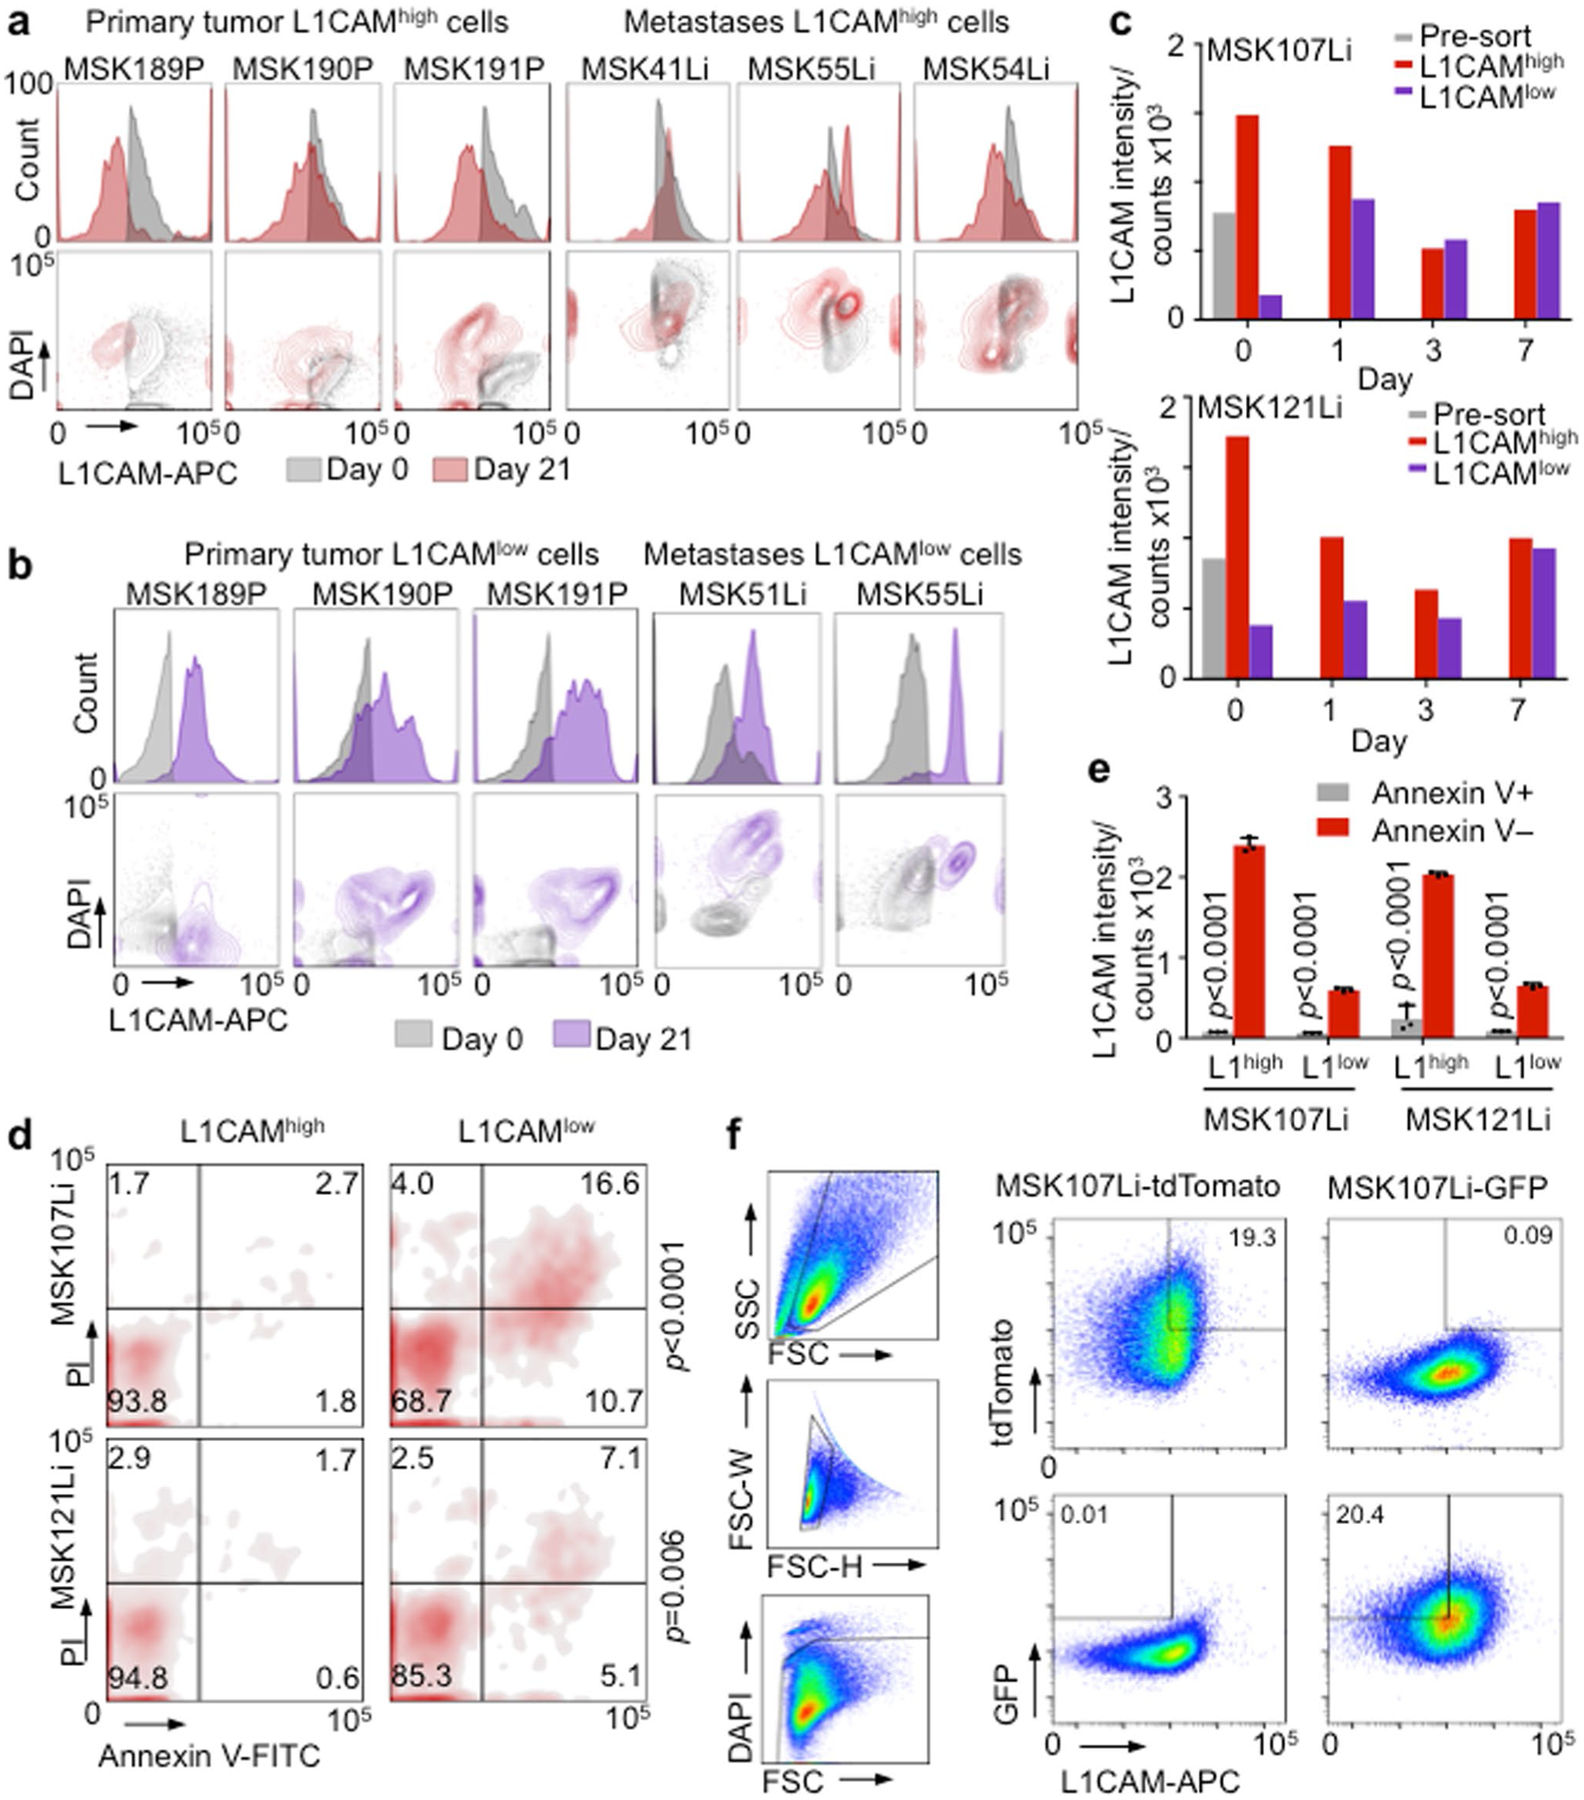
a, Proportion of L1CAM expressing cells decreases as organoids grow. Flow cytometry mode-normalized histograms (top) and contour plots (bottom) showing L1CAM expression in the L1CAMhigh population in freshly resected, dissociated and flow-sorted CRC primary tumours and liver metastases (grey), and in organoids grown from these L1CAMhigh cells 21 days following initial sorting (red), showing a left shift in the population over time. n = 6 independent patient tumours. b, Organoid generation selects for L1CAM expression in L1CAMlow cells. Flow cytometry mode-normalized histograms (top) and contour plots (bottom) showing L1CAM expression in the L1CAMlow population in freshly resected, dissociated and flow-sorted CRC primary tumours and liver metastases (grey), and in organoids grown from these L1CAMlow cells 21 days following initial sorting (purple), showing a right shift in the population over time. n = 5 independent patient tumours. c, Median L1CAM fluorescence intensity of the unselected population of MSK107Li (top) or MSK121Li (bottom) organoid derived cells pre-sort (grey), and viable cells regenerated from flow-sorted L1CAMhigh (red) or L1CAMlow (purple) populations at the indicated time points after sorting. Histograms indicating the distribution of the populations are shown in Fig. 5c. Representative of 3 independent experiments. d, Flow cytometry density plots showing staining with Annexin V-FITC and propidium iodide (PI) in populations derived from L1CAMhigh or L1CAMlow cells flow-sorted from MSK107Li (top) or MSK121Li (bottom) organoids and analysed 48 h after reseeding. Representative of 3 independent experiments. n = 2807 cells (MSK107Li), 2182 cells (MSK121Li), two-sided χ2 tests. e, Median L1CAM-APC staining intensity of Annexin V-FITC + (apoptotic) or Annexin V-FITC- (non-apoptotic) populations derived from L1CAMhigh or L1CAMlow cells flow-sorted from MSK107Li/MSK121Li organoids and analysed 48 h after reseeding, gated and distributed as in d. Mean ± s.e.m, n = 3 independent organoid cultures, two-sided Student’s t test. f, Gating strategy for isolating mutually exclusive tdTomato+;GFP−;L1CAMhigh and tdTomato−;GFP+;L1CAMlow cells from organoids stably expressing each fluorescent protein.
Extended Data Fig. 6 |. Loss of membrane E-cadherin contacts drives L1CAM expression.
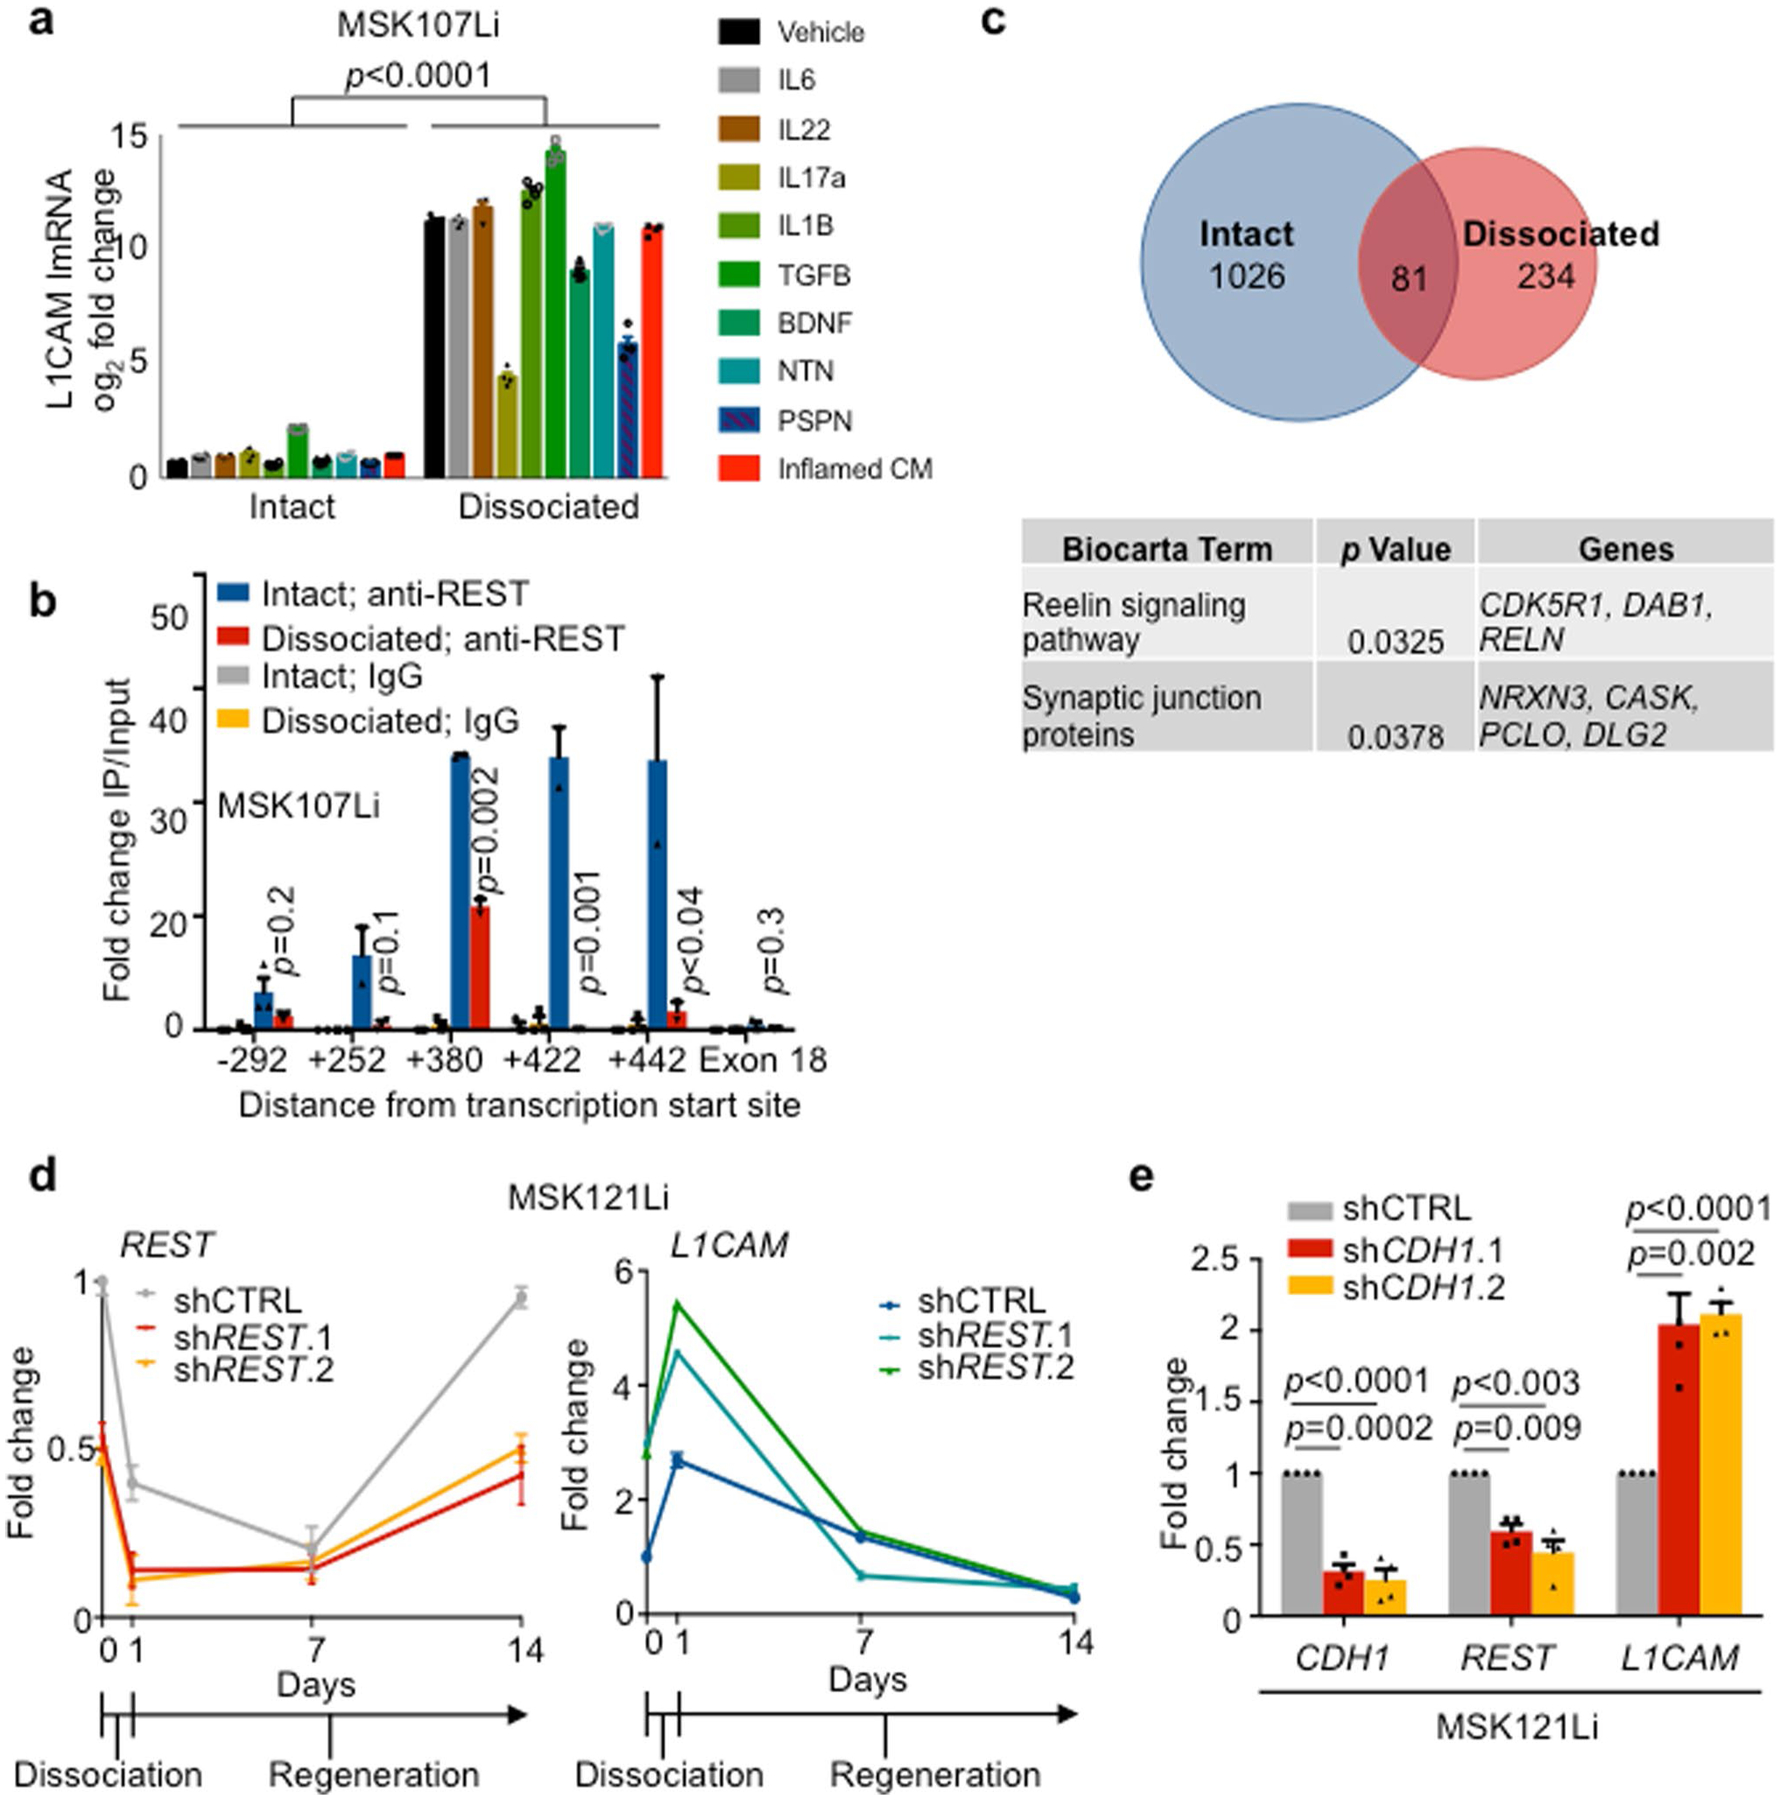
a, Epithelial disruption is a potent inducer of L1CAM expression. Relative L1CAM mRNA expression (mean ± s.e.m.) in intact normal colon organoids or organoid-derived single cells 24 h following dissociation. Gene expression was normalized to GAPDH mRNA expression. Organoids were cultured in media containing the indicated cytokines, or in conditioned media derived from DSS-colitis affected mouse colon. n = 4 organoid cultures per condition, two-sided Student’s t test. b, ChIP-PCR using antibodies against REST, or isotype control immunoglobulin in intact MSK107Li organoids or organoid-derived single cells 24 h following dissociation. Fold enrichment (mean ± s.e.m.) compared to the corresponding 2% input is shown. PCR primers (Extended Data Table 3) were selected to amplify immunoprecipitated DNA at the indicated number of residues from the L1CAM transcription site. p values indicate intact α-REST vs. dissociated α-REST, n = 3 independent experiments, two-sided Student’s t tests. c, Top: Venn diagram showing the number of genes in the vicinity of REST binding peaks observed in both MSK107Li and MSK121Li organoids, either in one integrity state or in both. Bottom: Table showing Biocarta pathway terms significantly enriched in the list of genes that lose REST ChIP-seq peaks upon dissociation of both MSK107Li and MSK121Li organoids. n = 2 independent experiments from 2 patient-derived organoids per integrity condition. Poisson-enrichment p value over background tag count. d, qRT-PCR showing relative REST and L1CAM mRNA expression (mean ± s.e.m.) in intact MSK121Li organoids (day 0), 24 h after dissociation and plating as single cells (day 1) and at the indicated time points during organoid regeneration. Organoids were transduced with lentivirus constitutively expressing shRNA targeting REST or control shRNA. Gene expression was normalized to the mRNA expression of GAPDH. Day 1 shCTRL vs. shREST.1: p = 0.01 (REST), p < 0.0001 (L1CAM); shCTRL vs. shREST.2: p = 0.02 (REST), p < 0.0001 (L1CAM); n = 4 organoid cultures per sample per time point, two-sided Student’s t tests. e, Relative mRNA expression (mean ± s.e.m.) of CDH1, REST and L1CAM in intact MSK121Li organoids transduced with lentivirus constitutively expressing shRNA targeting CDH1 or control shRNA. n = 4 organoid cultures per group, two-sided Student’s t tests.
Supplementary Material
Acknowledgements
We thank E. Batlle, F. Barriga and C. Morral for feedback and technical assistance, M. Schachner (Shantou University Medical College and Rutgers University) for the L1camfl/y mice, members of the Memorial Sloan Kettering Cancer Center core facilities, Colorectal, Hepatobiliary and Gastrointestinal Oncology Services and the Department of Pathology. This work was supported by NIH grants P01-CA129243 (J.M.), P01-CA094060 (J.M.), P30-CA008748 (MSKCC), K08-CA230213 (K.G.), T32-CA009207 (K.G.), T32-GM007739 (K.P.O. and Y.-H.H.) and F30-CA203238 (Y.-H.H.), Department of Defense Innovator Award W81XWH-12-0074 (J.M.), a Damon Runyon Clinical Investigator Award (K.G.), an American Cancer Society Postdoctoral Fellowship, an AACR Basic Cancer Research Fellowship, a Conquer Cancer Foundation of ASCO Young Investigator Award (K.G.), Shulamit Katzman Endowed Postdoctoral Research Fellowships (K.G. and E.E.E.), a Damon Runyon Postdoctoral Fellowship (H.B.), a Burroughs Wellcome Career Award at the Scientific Interface (A.M.L.) and the Alan and Sandra Gerry Metastasis and Tumour Ecosystems Center. K.G. recieves support as an investigator of the Stand Up To Cancer Colorectal Cancer Dream Team (grant number: SU2C AACR-DR22-17).
Footnotes
Data availability
ChIP-seq and scRNA-seq data that support the findings of this study have been deposited in the Gene Expression Omnibus (GEO) and Sequence Read Archive (SRA) under accession codes GSE112555 and SRP136919, respectively. Ranked differentially expressed genes in each LGR5-L1CAM cluster are listed in Supplementary Table 1. The human genes corresponding to the revival stem cell signature were derived from GSE117783 and are listed in Supplementary Table 2. Source data for Figs. 1–8 and Extended Data Figs. 1–6 are provided with this paper. All other data files supporting the findings of this study are available from the corresponding author upon reasonable request.
Code availability
All single-cell analyses and visualizations were performed in Python with the following open-source algorithms as described above: SEQC (https://github.com/ambrosejcarr/seqc), t-SNE (https://lvdmaaten.github.io/software/), MAGIC (https://github.com/dpeerlab/magic) and the Scikit-learn implementation of a Gaussian mixture model. Computer code is available upon reasonable request. ChIP-seq data analysis was performed in R and data were visualized with IGV.
Competing interests
J.M. is a science advisor for and owns company stock in Scholar Rock.
Extended data is available for this paper at https://doi.org/10.1038/s43018-019-0006-x.
Supplementary information is available for this paper at https://doi.org/10.1038/s43018-019-0006-x.
Publisher’s Note Springer Nature remains neutral with regard to jurisdictional claims in published maps and institutional affiliations.
References
- 1.Batlle E & Clevers H Cancer stem cells revisited. Nat. Med 23, 1124–1134 (2017). [DOI] [PubMed] [Google Scholar]
- 2.Celia-Terrassa T & Kang Y Distinctive properties of metastasis-initiating cells. Genes Dev. 30, 892–908 (2016). [DOI] [PMC free article] [PubMed] [Google Scholar]
- 3.Lambert AW, Pattabiraman DR & Weinberg RA Emerging biological principles of metastasis. Cell 168, 670–691 (2017). [DOI] [PMC free article] [PubMed] [Google Scholar]
- 4.Massague J & Obenauf AC Metastatic colonization by circulating tumour cells. Nature 529, 298–306 (2016). [DOI] [PMC free article] [PubMed] [Google Scholar]
- 5.Reya T, Morrison SJ, Clarke MF & Weissman IL Stem cells, cancer, and cancer stem cells. Nature 414, 105–111 (2001). [DOI] [PubMed] [Google Scholar]
- 6.Hanahan D & Weinberg RA Hallmarks of cancer: the next generation. Cell 144, 646–674 (2011). [DOI] [PubMed] [Google Scholar]
- 7.Rathjen FG & Schachner M Immunocytological and biochemical characterization of a new neuronal cell surface component (L1 antigen) which is involved in cell adhesion. EMBO J. 3, 1–10 (1984). [DOI] [PMC free article] [PubMed] [Google Scholar]
- 8.Valiente M et al. Serpins promote cancer cell survival and vascular co-option in brain metastasis. Cell 156, 1002–1016 (2014). [DOI] [PMC free article] [PubMed] [Google Scholar]
- 9.Er EE et al. Pericyte-like spreading by disseminated cancer cells activates YAP and MRTF for metastatic colonization. Nat. Cell Biol 20, 966–978 (2018). [DOI] [PMC free article] [PubMed] [Google Scholar]
- 10.Altevogt P, Doberstein K & Fogel M L1CAM in human cancer. Int. J. Cancer 138, 1565–1576 (2016). [DOI] [PubMed] [Google Scholar]
- 11.Sato T et al. Long-term expansion of epithelial organoids from human colon, adenoma, adenocarcinoma, and Barrett’s epithelium. Gastroenterology 141, 1762–1772 (2011). [DOI] [PubMed] [Google Scholar]
- 12.Jung P et al. Isolation and in vitro expansion of human colonic stem cells. Nat. Med 17, 1225–1227 (2011). [DOI] [PubMed] [Google Scholar]
- 13.Barker N et al. Identification of stem cells in small intestine and colon by marker gene Lgr5. Nature 449, 1003–1007 (2007). [DOI] [PubMed] [Google Scholar]
- 14.Barker N et al. Crypt stem cells as the cells-of-origin of intestinal cancer. Nature 457, 608–611 (2009). [DOI] [PubMed] [Google Scholar]
- 15.Ayyaz A et al. Single-cell transcriptomes of the regenerating intestine reveal a revival stem cell. Nature 569, 121–125 (2019). [DOI] [PubMed] [Google Scholar]
- 16.Pascual G et al. Targeting metastasis-initiating cells through the fatty acid receptor CD36. Nature 541, 41–45 (2017). [DOI] [PubMed] [Google Scholar]
- 17.Hallmann R et al. Expression and function of laminins in the embryonic and mature vasculature. Physiol. Rev 85, 979–1000 (2005). [DOI] [PubMed] [Google Scholar]
- 18.Simon-Assmann P et al. The laminins: role in intestinal morphogenesis and differentiation. Ann. NY Acad. Sci 859, 46–64 (1998). [DOI] [PubMed] [Google Scholar]
- 19.Kleinman HK et al. Basement membrane complexes with biological activity. Biochemistry 25, 312–318 (1986). [DOI] [PubMed] [Google Scholar]
- 20.Lemmon V, Farr KL & Lagenaur C L1-mediated axon outgrowth occurs via a homophilic binding mechanism. Neuron 2, 1597–1603 (1989). [DOI] [PubMed] [Google Scholar]
- 21.Hall H, Carbonetto S & Schachner M L1/HNK-1 carbohydrate- and β1 integrin-dependent neural cell adhesion to laminin-1. J. Neurochem 68, 544–553 (1997). [DOI] [PubMed] [Google Scholar]
- 22.Oskarsson T et al. Breast cancer cells produce tenascin C as a metastatic niche component to colonize the lungs. Nat. Med 17, 867–874 (2011). [DOI] [PMC free article] [PubMed] [Google Scholar]
- 23.Okayasu I et al. A novel method in the induction of reliable experimental acute and chronic ulcerative colitis in mice. Gastroenterology 98, 694–702 (1990). [DOI] [PubMed] [Google Scholar]
- 24.Dahme M et al. Disruption of the mouse L1 gene leads to malformations of the nervous system. Nat. Genet 17, 346–349 (1997). [DOI] [PubMed] [Google Scholar]
- 25.Madison BB et al. Cis elements of the villin gene control expression in restricted domains of the vertical (crypt) and horizontal (duodenum, cecum) axes of the intestine. J. Biol. Chem 277, 33275–33283 (2002). [DOI] [PubMed] [Google Scholar]
- 26.Ge Y et al. Stem cell lineage infidelity drives wound repair and cancer. Cell 169, 636–650 (2017). [DOI] [PMC free article] [PubMed] [Google Scholar]
- 27.Dvorak HF Tumors: wounds that do not heal. Similarities between tumor stroma generation and wound healing. N. Engl. J. Med 315, 1650–1659 (1986). [DOI] [PubMed] [Google Scholar]
- 28.Cheung AF et al. Complete deletion of Apc results in severe polyposis in mice. Oncogene 29, 1857–1864 (2010). [DOI] [PMC free article] [PubMed] [Google Scholar]
- 29.O’Rourke KP et al. Transplantation of engineered organoids enables rapid generation of metastatic mouse models of colorectal cancer. Nat. Biotechnol 35, 577–582 (2017). [DOI] [PMC free article] [PubMed] [Google Scholar]
- 30.Ghidini M, Petrelli F & Tomasello G Right versus left colon cancer: resectable and metastatic disease. Curr. Treat. Options Oncol 19, 31 (2018). [DOI] [PubMed] [Google Scholar]
- 31.Bettington M et al. The serrated pathway to colorectal carcinoma: current concepts and challenges. Histopathology 62, 367–386 (2013). [DOI] [PubMed] [Google Scholar]
- 32.Chen J et al. A restricted cell population propagates glioblastoma growth after chemotherapy. Nature 488, 522–526 (2012). [DOI] [PMC free article] [PubMed] [Google Scholar]
- 33.Driessens G, Beck B, Caauwe A, Simons BD & Blanpain C Defining the mode of tumour growth by clonal analysis. Nature 488, 527–530 (2012). [DOI] [PMC free article] [PubMed] [Google Scholar]
- 34.Schepers AG et al. Lineage tracing reveals Lgr5+ stem cell activity in mouse intestinal adenomas. Science 337, 730–735 (2012). [DOI] [PubMed] [Google Scholar]
- 35.He X et al. Promotion of spinal cord regeneration by neural stem cell-secreted trimerized cell adhesion molecule L1. PLoS One 7, e46223 (2012). [DOI] [PMC free article] [PubMed] [Google Scholar]
- 36.Guseva D, Loers G & Schachner M Function-triggering antibodies to the adhesion molecule L1 enhance recovery after injury of the adult mouse femoral nerve. PLoS One 9, e112984 (2014). [DOI] [PMC free article] [PubMed] [Google Scholar]
- 37.Schoenherr CJ & Anderson DJ The neuron-restrictive silencer factor (NRSF): a coordinate repressor of multiple neuron-specific genes. Science 267, 1360–1363 (1995). [DOI] [PubMed] [Google Scholar]
- 38.Mukherjee S, Brulet R, Zhang L & Hsieh J REST regulation of gene networks in adult neural stem cells. Nat. Commun 7, 13360 (2016). [DOI] [PMC free article] [PubMed] [Google Scholar]
- 39.Westbrook TF et al. A genetic screen for candidate tumor suppressors identifies REST. Cell 121, 837–848 (2005). [DOI] [PubMed] [Google Scholar]
- 40.Kourtidis A, Lu R, Pence LJ & Anastasiadis PZ A central role for cadherin signaling in cancer. Exp. Cell Res 358, 78–85 (2017). [DOI] [PMC free article] [PubMed] [Google Scholar]
- 41.Chong JA et al. REST: a mammalian silencer protein that restricts sodium channel gene expression to neurons. Cell 80, 949–957 (1995). [DOI] [PubMed] [Google Scholar]
- 42.Lim JS et al. Intratumoural heterogeneity generated by Notch signalling promotes small-cell lung cancer. Nature 545, 360–364 (2017). [DOI] [PMC free article] [PubMed] [Google Scholar]
- 43.Lapuk AV et al. From sequence to molecular pathology, and a mechanism driving the neuroendocrine phenotype in prostate cancer. J. Pathol 227, 286–297 (2012). [DOI] [PMC free article] [PubMed] [Google Scholar]
- 44.Lin TP et al. REST reduction is essential for hypoxia-induced neuroendocrine differentiation of prostate cancer cells by activating autophagy signaling. Oncotarget 7, 26137–26151 (2016). [DOI] [PMC free article] [PubMed] [Google Scholar]
- 45.Denny SK et al. Nfib promotes metastasis through a widespread increase in chromatin accessibility. Cell 166, 328–342 (2016). [DOI] [PMC free article] [PubMed] [Google Scholar]
- 46.Roe JS et al. Enhancer reprogramming promotes pancreatic cancer metastasis. Cell 170, 875–888 (2017). [DOI] [PMC free article] [PubMed] [Google Scholar]
- 47.Naik S et al. Inflammatory memory sensitizes skin epithelial stem cells to tissue damage. Nature 550, 475–480 (2017). [DOI] [PMC free article] [PubMed] [Google Scholar]
- 48.Tian H et al. A reserve stem cell population in small intestine renders Lgr5-positive cells dispensable. Nature 478, 255–259 (2011). [DOI] [PMC free article] [PubMed] [Google Scholar]
- 49.Schwitalla S et al. Intestinal tumorigenesis initiated by dedifferentiation and acquisition of stem-cell-like properties. Cell 152, 25–38 (2013). [DOI] [PubMed] [Google Scholar]
- 50.Shimokawa M et al. Visualization and targeting of LGR5+ human colon cancer stem cells. Nature 545, 187–192 (2017). [DOI] [PubMed] [Google Scholar]
- 51.Rompolas P et al. Spatiotemporal coordination of stem cell commitment during epidermal homeostasis. Science 352, 1471–1474 (2016). [DOI] [PMC free article] [PubMed] [Google Scholar]
- 52.Tata PR et al. Dedifferentiation of committed epithelial cells into stem cells in vivo. Nature 503, 218–223 (2013). [DOI] [PMC free article] [PubMed] [Google Scholar]
- 53.Stange DE et al. Differentiated Troy+ chief cells act as reserve stem cells to generate all lineages of the stomach epithelium. Cell 155, 357–368 (2013). [DOI] [PMC free article] [PubMed] [Google Scholar]
- 54.Varga J & Greten FR Cell plasticity in epithelial homeostasis and tumorigenesis. Nat. Cell Biol 19, 1133–1141 (2017). [DOI] [PubMed] [Google Scholar]
- 55.Yui S et al. YAP/TAZ-dependent reprogramming of colonic epithelium links ECM remodeling to tissue regeneration. Cell Stem Cell 22, 35–49 (2018). [DOI] [PMC free article] [PubMed] [Google Scholar]
- 56.Blanpain C, Lowry WE, Geoghegan A, Polak L & Fuchs E Self-renewal, multipotency, and the existence of two cell populations within an epithelial stem cell niche. Cell 118, 635–648 (2004). [DOI] [PubMed] [Google Scholar]
- 57.Stingl J et al. Purification and unique properties of mammary epithelial stem cells. Nature 439, 993–997 (2006). [DOI] [PubMed] [Google Scholar]
- 58.Shackleton M et al. Generation of a functional mammary gland from a single stem cell. Nature 439, 84–88 (2006). [DOI] [PubMed] [Google Scholar]
- 59.Ito M et al. Stem cells in the hair follicle bulge contribute to wound repair but not to homeostasis of the epidermis. Nat. Med 11, 1351–1354 (2005). [DOI] [PubMed] [Google Scholar]
- 60.Van Keymeulen A et al. Distinct stem cells contribute to mammary gland development and maintenance. Nature 479, 189–193 (2011). [DOI] [PubMed] [Google Scholar]
- 61.Cheng DT et al. Memorial Sloan Kettering-Integrated Mutation Profiling of Actionable Cancer Targets (MSK-IMPACT): a hybridization capture-based next-generation sequencing clinical assay for solid tumor molecular oncology. J. Mol. Diagn 17, 251–264 (2015). [DOI] [PMC free article] [PubMed] [Google Scholar]
- 62.Chakravarty D et al. OncoKB: a precision oncology knowledge base. JCO Precis. Oncol 10.1200/PO.17.00011 (2017). [DOI] [PMC free article] [PubMed] [Google Scholar]
- 63.Maru Y, Orihashi K & Hippo Y Lentivirus-based stable gene delivery into intestinal organoids. Methods Mol. Biol 1422, 13–21 (2016). [DOI] [PubMed] [Google Scholar]
- 64.Jackson EL et al. Analysis of lung tumor initiation and progression using conditional expression of oncogenic K-ras. Genes Dev. 15, 3243–3248 (2001). [DOI] [PMC free article] [PubMed] [Google Scholar]
- 65.Marino S, Vooijs M, van Der Gulden H, Jonkers J & Berns A Induction of medulloblastomas in p53-null mutant mice by somatic inactivation of Rb in the external granular layer cells of the cerebellum. Genes Dev. 14, 994–1004 (2000). [PMC free article] [PubMed] [Google Scholar]
- 66.Kim JJ, Shajib MS, Manocha MM & Khan WI Investigating intestinal inflammation in DSS-induced model of IBD. J. Vis. Exp 10.3791/3678 (2012). [DOI] [PMC free article] [PubMed] [Google Scholar]
- 67.Kreyberg L Main histological types of primary epithelial lung tumours. Br. J. Cancer 15, 206–210 (1961). [DOI] [PMC free article] [PubMed] [Google Scholar]
- 68.Shultz LD et al. NOD/LtSz-Rag1nullPfpnull mice: a new model system with increased levels of human peripheral leukocyte and hematopoietic stem-cell engraftment. Transplantation 76, 1036–1042 (2003). [DOI] [PubMed] [Google Scholar]
- 69.Cespedes MV et al. Orthotopic microinjection of human colon cancer cells in nude mice induces tumor foci in all clinically relevant metastatic sites. Am. J. Pathol 170, 1077–1085 (2007). [DOI] [PMC free article] [PubMed] [Google Scholar]
- 70.Azizi E et al. Single-cell map of diverse immune phenotypes in the breast tumor microenvironment. Cell 174, 1293–1308 (2018). [DOI] [PMC free article] [PubMed] [Google Scholar]
- 71.van Dijk D et al. Recovering gene interactions from single-cell data using data diffusion. Cell 174, 716–729 (2018). [DOI] [PMC free article] [PubMed] [Google Scholar]
- 72.Fellmann C et al. An optimized microRNA backbone for effective single-copy RNAi. Cell Rep. 5, 1704–1713 (2013). [DOI] [PubMed] [Google Scholar]
- 73.Basnet H et al. Tyrosine phosphorylation of histone H2A by CK2 regulates transcriptional elongation. Nature 516, 267–271 (2014). [DOI] [PMC free article] [PubMed] [Google Scholar]
- 74.Martin M Cutadapt removes adapter sequences from high-throughput sequencing reads. EMBnet J. 17, 10–12 (2011). [Google Scholar]
- 75.Andrews S FASTQC. A quality control tool for high throughput sequence data. Babrahan Bioinformatics http://www.bioinformatics.babraham.ac.uk/projects/fastqc/ (2010). [Google Scholar]
- 76.Langmead B & Salzberg SL Fast gapped-read alignment with Bowtie 2. Nat. Methods 9, 357–359 (2012). [DOI] [PMC free article] [PubMed] [Google Scholar]
- 77.Zhang Y et al. Model-based analysis of ChIP-Seq (MACS). Genome Biol. 9, R137 (2008). [DOI] [PMC free article] [PubMed] [Google Scholar]
- 78.Heinz S et al. Simple combinations of lineage-determining transcription factors prime cis-regulatory elements required for macrophage and B cell identities. Mol. Cell 38, 576–589 (2010). [DOI] [PMC free article] [PubMed] [Google Scholar]
- 79.Quinlan AR & Hall IM BEDTools: a flexible suite of utilities for comparing genomic features. Bioinformatics 26, 841–842 (2010). [DOI] [PMC free article] [PubMed] [Google Scholar]
Associated Data
This section collects any data citations, data availability statements, or supplementary materials included in this article.