

Abstract
Sanger sequencing remains an essential tool utilized by researchers. Despite competition from commercial sequencing providers, many academic sequencing core facilities continue to offer these services based on a model of competitive pricing, knowledgeable technical support, and rapid turnaround time. In-house Sanger sequencing remains a viable core service and, until recently, Applied Biosystems BigDye Terminator chemistry was the only commercially available solution for Sanger DNA sequencing on Applied Biosystems (ABI) instruments; however, several new products employing novel dye chemistries and reaction configurations have entered the market. As a result, there is a need to benchmark the performance of these new chemistries on various DNA templates, including difficult-to-sequence templates, and their amenability to commonly employed cost-saving measures, such as dye dilution and reaction miniaturization. To evaluate these new reagents, a study was designed to compare the quality of Sanger sequencing data produced by ABI BigDye and commercially available kits from 2 other vendors using both control and difficult-to-sequence DNA templates under various reaction conditions. This study will serve as a valuable resource to core facilities conducting Sanger sequencing that wish to evaluate the use of an alternative chemistry in their sequencing core.
Keywords: BigDye alternative, Sanger chemistry replacement, BrilliantDye, BrightDye, Sanger dye evaluation
INTRODUCTION
Sanger sequencing continues to be one of the most trusted technologies for DNA sequence interrogation and is used successfully in core facilities and commercial sequencing centers. Core facilities provide expert Sanger sequencing services and have worked to optimize all steps in the sequencing process to keep prices low while delivering the highest quality data to their users.1–3 With these improvements, it has been possible to obtain contiguous fragment lengths of nearly 1 kb and quality (Q)-scores >20 with all but the most difficult of templates.1, 4 However, innovation has been hampered by patents surrounding Applied Biosystems (ABI) BigDye dideoxy terminator chemistry.5 This limitation has been lifted with the recent patent expiration, and in its wake, a few companies have developed competing chemistries for Thermo Fisher Scientific’s dye for use with ABI instruments. These companies are focused on providing alternatives to the classic BigDye chemistry, and each has created its own drop-in–ready version to replace BigDye.7
The DNA Sequencing Research Group organized a study to evaluate the new commercially available chemistries, BrilliantDye from EdgeBio and BrightDye from Molecular Cloning Laboratories (MCLAB), and to assess the performance of each chemistry compared with BigDye. The study focused on chemistry performance of the standard terminator sequencing kits and the deoxyinosine triphosphate (dGTP) chemistry by sequencing both control and difficult-to-sequence DNA samples and their ability to be used as a direct substitution. The dyes were evaluated on overall data quality, read lengths, cumulative Quality Value ≥ 20 scores, and the ease of substitution into existing protocols in high-throughput core facilities.6 As such, this study will assist core facilities, commercial sequencing providers, and other units to most effectively choose from the new Sanger chemistries on the market for both routine and nonstandard sequencing templates.
MATERIALS AND METHODS
Study design
Three sequencing cores were selected to complete the study. Each of the cores are current members of the DNA Sequencing Research Group and perform Sanger sequencing as part of their facility services. Samples were shipped to the 3 sites, and each facility was asked to follow the same protocols in triplicate, which included an initial template quality check and then 3 parameters for testing: general benchmarking, performance on difficult-to-sequence templates, and direct substitution in each facility’s standard workflow.
First, to verify the integrity of the templates and primers, each site set up reactions and sequenced using the material received for the study using their own in-house BigDye chemistry following their site-specific standard operating procedure. Next, each site was instructed to follow 3 specific protocols. The first was a manufacturer-published method recommended for diluting a sequencing reaction,8 the second followed a peer-reviewed published protocol established for difficult-to-sequence templates that includes the addition of betaine and dGTP terminator to the standard dye,1 and the third method was each facility’s site-specific protocol substituting only the dye. The protocols will be identified as follows: manufacturer-recommended protocol when diluting the dye, optimal protocol for difficult templates, and site-specific protocol.
For detailed descriptions of the templates, primers, and sequencing dyes used, see Supplemental Study Design 1.
Sample and primer preparation
To ensure uniformity of DNA template materials, 1 site prepared all aliquots for the DNA, primers, and sequencing chemistries from stocks and then shipped them to the remaining facilities. Three DNA templates were used for the study: the pGEM-37f(+) control DNA and 2 known difficult-to-sequence templates. This included a 94% GC-rich sequence and a low-complexity sample with a 456-base nonrepeat T/C. (Fig. 1A, B). The concentrations for each template were verified using a Thermo Fisher Scientific Qubit (Waltham, MA, USA), and then they were normalized to 200 ng/µl. The difficult templates were courtesy of Jan Kieleczawa of Wyzer Biosciences.
FIGURE 1.

Chromatagrams for each of the difficult-to-sequence template samples. A) GC-rich DNA template, 94% GC-rich, 101-base nonrepeat (G/C). B) Low-complexity DNA template, 456-base nonrepeat T/C.
Sequencer
Each of the 3 sites performed the sequencing on an ABI 3730 XL (Thermo Fisher Scientific).
Protocols
Each of the 3 sites followed dideoxy terminator, cleanup, and Sanger instrument protocols implemented at their own institution in addition to the very detailed protocols outlined for the study. These included protocols used to check the DNA and primer quality and ones that have been adapted to handle difficult-to-sequence templates (Tables 1 and 2).1
TABLE 1.
Manufacturer 0.5-times–diluted reaction setup chart
| Reagent | Volume (μl) |
|---|---|
| Dye Ready Reaction Mix | 2 |
| 5× sequencing buffer | 1 |
| Primer 0.8 μM (1.6 pMol in reaction) | 2 |
| Water | 4 |
| Template | 1 |
| Reaction volume total | 10 |
| Cycling conditions | Seconds |
|---|---|
| 96 | 60 |
| 96 | 10 |
| 50 | 5 |
| 60 | 240 |
| 25 cycles | |
TABLE 2.
Setup chart for difficult-to-sequence samples using optimal protocol for difficult templates
| Reagent | Volume (μl) |
|---|---|
| Template (200 ng) | 1 |
| Primer (4 μM) 2 or 4 pmol | TBD |
| Dye (BD v3.1 or comparable) | 1.5 |
| dGTP v3.0 | 0.5 |
| 5× Buffer Sequencing Buffer | 0 |
| Additive (Betaine) | 2 |
| Water | TBD |
| Reaction volume total | 10 |
| Cycling conditions | Seconds |
|---|---|
| 96 | 10 |
| 50 | 5 |
| 60 | 240 |
| 35 cycles | |
TBD, to be determined.
Data analysis
The data files were generated at each facility using the Sequencing Analysis Software (Thermo Fisher Scientific) to produce the “.ab1” files. Applied Biosystems Sequence Scanner Software v2.0 (Thermo Fisher Scientific) was used to collect all the data produced from each of the sites and export it into an Excel file containing the Quality Value ≥ 20 and the contiguous read-length scores. The data collected focused on the QV20+ scores produced from the analysis software. These are the total number of bases in the trace that have a basecaller quality value ≥20.9, 10 In addition, we also evaluated the cumulative Quality Value ≥ 20 score ratios using sangerseqR.11
RESULTS
Baseline results and template quality check
Site-specific standard operating procedure with BigDye for quality check
Each of the 3 sites were instructed to set up reactions and sequence each of the DNA templates received using their standard protocol with their own reagents. Each one sequenced 200 ng of the 3 DNA templates using only the ABI BigDye chemistry in triplicate. These initial results would be used to set a benchmark for the expected sequencing results produced at each site and to check the quality of the templates shipped.
The pGEM-37f(+) control produced QV20+ scores ranging from the highest mean of 1130 with a coefficient of variation (CV) of 0.13% to the lowest mean QV20+ of 856 with a CV of 1.79%, respectively, for site 1 and site 3.
The 2 difficult-to-sequence templates produced significantly lower QV20+ scores for both the GC-rich and the low-complexity library. The GC-rich template produced QV20+ scores ranging from QV20+ scores of 158 to 434, and the low-complexity sample QV20+ scores ranging from 357 to 772, a demonstration that the templates could potentially benefit from the addition of additives to improve the quality of the read length. For the low-complexity sample, the lowest and highest QV20+ values were produced by the same site, possibly indicating a failure or another issue for one of the replicates, so the next-lowest QV20+ score to be considered should be QV20+ 440 (Fig. 2).
FIGURE 2.

Each site sequenced the 3 DNA templates with its site-specific protocol using Thermo Fisher Scientific BigDye with no additives. The results measured the QV20+ score for each sample, and these results were used to confirm the difficulty of sequencing these challenging samples and to establish a baseline between each of the 3 sites.
Results for each of the 3 protocols established for the study
Manufacturer recommended when diluting the dye
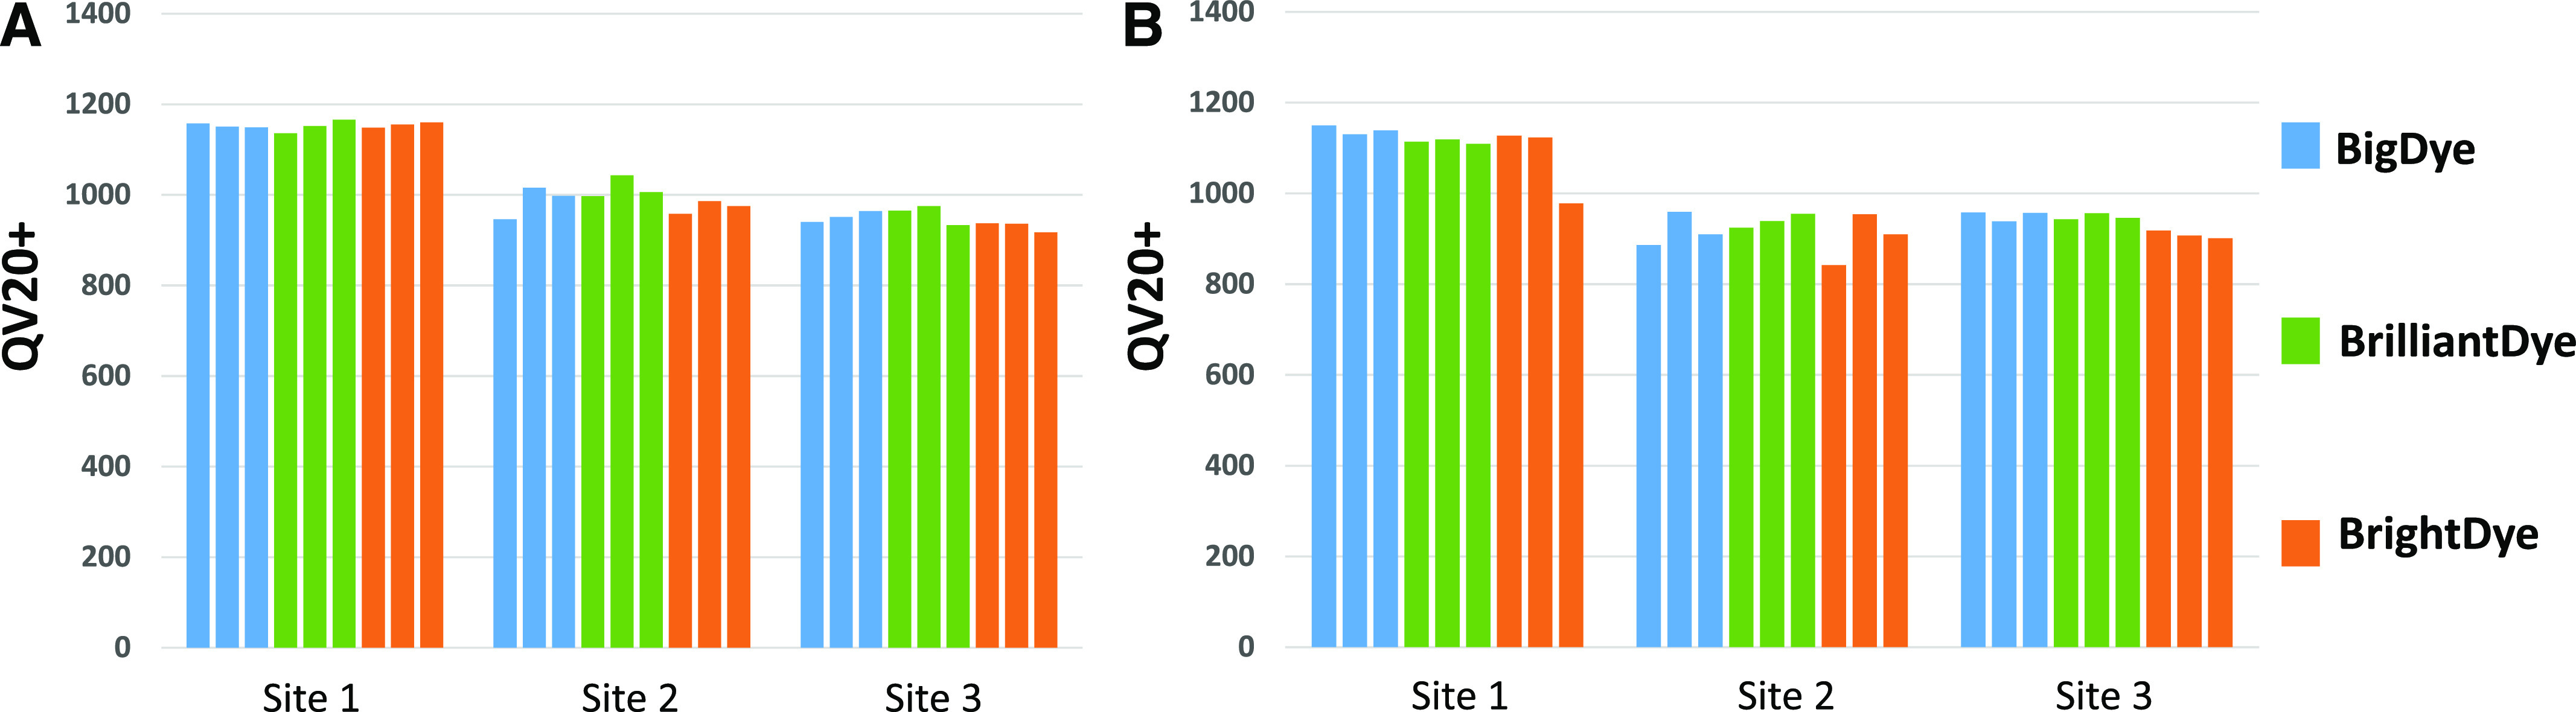
The first protocol used was to compare dyes across a “standard” manufacturer-recommended protocol. The pGEM-37f(+) control was sequenced using the ABI-suggested setup for a 0.5× diluted reaction8 with a slight modification, employing 10-µl reactions vs. 20-µl reactions. Each site produced high-quality results for the pGEM-37f(+) control and had reproducible data, demonstrating that the dye alternatives produced data comparable to the conventional dye (Fig. 3A, B).
FIGURE 3.

Each site sequenced the pGEM −37f(+) control following the manufacturer-recommended protocol for diluting a reaction; this was done at 0.5× from the standard setup.8 A) QV20+ scores. B) Cumulative quality >20 scores.
Optimal protocol for difficult templates
To demonstrate that the optimal protocol for difficult templates would perform equivalently to the manufacturer-recommended 0.5× diluted protocol, the pGEM-37f(+) control DNA was sequenced with both methods with each dye at all 3 sites. The results are comparable, with each site producing similar QV20+ scores across all data points; for example, site 3 produced mean scores for the pGEM-37f(+) control of QV20+ 946 with a CV of 1.96% using the manufacturer-recommended protocol vs. mean QV20+ 946 with a CV of 2.34% using the optimal protocol for difficult templates. This was important to demonstrate that a deviation from the manufacturer-recommended protocol was not biased toward any particular dye (Fig. 4A, B).
FIGURE 4.
Each site sequenced the pGEM −37f(+) control in triplicate following the manufacturer-recommended protocol for 0.5× dilution and the optimal protocol for difficult-to-sequence templates. This was used to verify that changing the protocol through the introduction of new sequencing chemistries, the addition of additives, and the change in cycling conditions would not impact the data. Demonstrating that the data produced from all 3 chemistries with both protocols were comparable eliminated any downstream questions in regards to whether it was the protocol or the chemistry used in the reaction. A) The 0.5× manufacturer protocol. B) Published protocol 1.
Next, the optimal protocol for difficult templates was used to produce 3 data sets: 2 for the GC-rich template using both the forward and reverse primers and 1 for the low-complexity sample forward only. The quality of the GC-rich template using the forward primer produced high, reproducible QV20+ scores with all 3 dyes among site 1, site 2, and site 3, averaging 1071, 852, and 850, respectively (Fig. 5A, B). The reverse primer for the GC-rich template produced more variable data, and the low-complexity sample using the forward primer produced the lowest-quality results, with reductions ranging from 9 to 26% in QV20+ scores when compared with the GS-rich sample with the same forward primer (Supplemental Fig. S1A, B).
FIGURE 5.

Optimal protocol for difficult templates, test GC-Rich template with FWD primer with each of the dyes. A) QV20+ scores. B) Cumulative quality >20 scores. FWD, forward.
Drop-in evaluation
Because BrightDye and BrilliantDye are marketed as direct substitutions for BigDye, the 3 sites were asked to use their standard in-house Sanger sequencing protocol and only substitute the sequencing dye; no additives or changes to their site-specific protocol were made, and only the pGEM-37f(+) control was sequenced (Fig. 6).
FIGURE 6.

Mean QV20+ scores including sd from each site using its in-house SOP when only substituting the dye. SOP, standard operating procedure.
DISCUSSION
The evaluation of 2 new commercially available Sanger sequencing dyes, BrightDye and BrilliantDye, to the industry standard BigDye demonstrated that they have the capability of producing high-quality, comparable data. This thorough examination covered the performance of each dye on a commonly used industry standard, evaluated each dye on its ability to sequence challenging samples, and tested how well the dyes performed as a direct substitution into the laboratory workflow. This held true for the performance on standard pGEM-37f(+) control and the difficult-to-sequence templates, both a GC-rich and low-complexity sample.
Because many sequencing cores encounter a variety of sample types, it was important for the study to demonstrate the performance of each chemistry in conjunction with their dGTP chemistry. Although it is important to know how each standard version of the chemistry would perform, it was also necessary to include each version of dGTP, which is used for difficult-to-sequence regions. This is an informative data set for any researcher considering the use of an alternative chemistry. The data demonstrated that all 3 dyes with the addition of dGTP, betaine, and a slight modification to the cycling conditions could handle the challenging samples as well as produce comparable results on the pGEM-37f(+) control with no additives. The sequencing results from the difficult-to-sequence templates do show site-to-site variation; however, none indicate that any 1 dye performs more favorably.
The final data set of the study was a direct substitution for BigDye into each facility’s standard workflow, and because sequencing cores commonly establish in-house protocols usually adapted around financial constraints, this cross-site evaluation was an excellent test. Such adaptations can include dilution of the sequencing dye, reaction miniaturization, and employment of cost-saving measures for the dye removal methods. Again, we found that they were all able to produce quality data, and drops in quality were linked to the sequencing facility rather than the dye.
One of the most unexpected observations in the data sets was the longer read lengths produced by one of the sites throughout the study. After investigation of cross-site variability, it was noted that a particular site used a modified version of the BDx_XLRSeq50_POP7_1 run module. Both the injection voltage and injection time were modified to improve read lengths. This modification will extend the run time to 3 h, which can be problematic for a sequencing facility trying to process large sample numbers daily on a limited number of instruments.
ACKNOWLEDGMENTS
The DNA Sequencing Research Group thanks Stuart Levine of MIT for his support and feedback throughout the study and Chris Lytle and the Molecular Biology Shared Resource and Dartmouth for their contribution with sequencing samples. This study was made possible through the support and funding from the Association of Biomolecular Resource Facilities and by EdgeBio for the donation of reagents and NCI Cancer Center Support Grant 5P30CA023108 for the Genomics and Molecular Biology Shared Resource at Dartmouth. This work is supported by the Harvard University Center for Aids Research (C.F.A.R.), an NIH award P30 AI060354 (Z.H.).
Footnotes
This article includes supplemental data. Please visit http://jbt.abrf.org/ to obtain this information.
REFERENCES
- 1.Kieleczawa J, Adam D, Bintzler D, et al. Identification of optimal protocols for sequencing difficult templates: results of the 2008 ABRF DNA Sequencing Research Group difficult template study 2008. J Biomol Tech. 2009;20:116–127. [PMC free article] [PubMed] [Google Scholar]
- 2.Kieleczawa J, ed. DNA Sequencing: Optimizing the Process and Analysis, Sudbury, MA: Jones and Bartlett, 2005. [Google Scholar]
- 3.Kieleczawa J, ed. DNA Sequencing II: Optimizing Preparation and Cleanup, Sudbury, MA: Jones and Bartlett, 2006. [Google Scholar]
- 4.Heather JM, Chain B. The sequence of sequencers: the history of sequencing DNA. Genomics. 2016;107:1–8. [DOI] [PMC free article] [PubMed] [Google Scholar]
- 5.Ansorge WJ. Next-generation DNA sequencing techniques. N Biotechnol. 2009;25:195–203. [DOI] [PubMed] [Google Scholar]
- 6.Gurson N. Your Sanger Sequencing Data Analysis Question – Seq It Out. ThermoFisher Scientific Behind the Bench Web site. Available at: https://www.thermofisher.com/blog/behindthebench/your-sanger-sequencing-data-analysis-question-seq-it-out. Accessed April 29, 2020.
- 7.BrilliantDye Terminator Cycle Sequencing Kits. Nimagen, a Biolegio Company. Available at: https://www.lubio.ch/assets/PDFs/EdgeBio_BrilliantDye_Brochure.pdf. Accessed April 29, 2020.
- 8.BigDye™ Terminator v3.1 Cycle Sequencing Kit. ThermoFisher Scientific; Pub. No. MAN0015666 Rev. A.0. Revised 22 April 2016. Available at: https://assets.thermofisher.com/TFS-Assets/LSG/manuals/MAN0015666_BigDyeTerminator_V3_1_CycleSeq_QR.pdf. Accessed April 29, 2020.
- 9.Ewing B, Green P. Base-calling of automated sequencer traces using phred. II. Error probabilities. Genome Res. 1998;8:186–194. [PubMed] [Google Scholar]
- 10.Ewing B, Hillier L, Wendl MC, Green P. Base-calling of automated sequencer traces using phred. I. Accuracy assessment. Genome Res. 1998;8:175–185. [DOI] [PubMed] [Google Scholar]
- 11.Hill JT, Demarest BL, Bisgrove BW, Su YC, Smith M, Yost HJ. Poly peak parser: method and software for identification of unknown indels using sanger sequencing of polymerase chain reaction products. Dev Dyn. 2014;243:1632–1636. [DOI] [PMC free article] [PubMed] [Google Scholar]