

SUMMARY
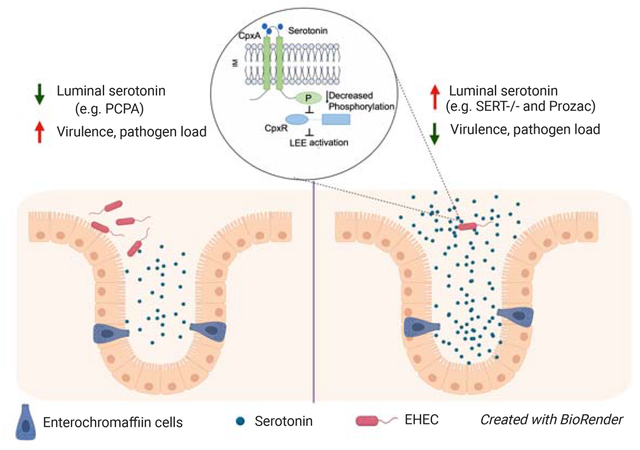
The gut-brain axis is crucial to microbial-host interactions. The neurotransmitter serotonin is primarily synthesized in the gastrointestinal (GI) tract, where it is secreted into the lumen and subsequently removed by the serotonin transporter, SERT. We show that serotonin decreases virulence gene expression by enterohemorrhagic E. coli (EHEC) and Citrobacter rodentium, a murine model for EHEC. The membrane bound histidine sensor kinase CpxA is a bacterial serotonin receptor. Serotonin induces dephosphorylation of CpxA, which inactivates the transcriptional factor CpxR controlling expression of virulence genes, notably those within the locus of enterocyte effacement (LEE). Increasing intestinal serotonin by genetically or pharmacologically inhibiting SERT decreases LEE expression and reduces C. rodentium loads. Conversely, inhibiting serotonin synthesis increases pathogenesis and decreases host survival. As other enteric bacteria contain CpxA, this signal exploitation may be engaged by other pathogens. Additionally, repurposing serotonin agonists to inhibit CpxA may represent a potential therapeutic intervention for enteric bacteria.
Keywords: enterohemorrhagic E. coli (EHEC), serotonin, inter-kingdom signaling, enteric infections, CpxA
Graphical Abstract
In brief
Kumar, Russell et al. demonstrate that changes in intestinal serotonin levels alter the pathogenesis of enteric bacteria. Serotonin decreases the expression of bacterial virulence genes by signaling through the bacterial histidine sensor kinase CpxA. Genetic or pharmacological enhancement of intestinal serotonin levels reduces bacterial loads and enhances host survival.
INTRODUCTION
The GI tract is highly innervated, and neurotransmitters are prominent in this environment. Neurotransmitters and the microbiota are intrinsically connected. Several studies link the composition of the microbiota with changes in behavior and neurological diseases, such as autism, as well as influencing the levels of active neurotransmitters in the GI tract (Hsiao et al., 2013; Reigstad et al., 2015; Sampson and Mazmanian, 2015). Moreover, neurotransmitters also modify bacterial behavior, and impact virulence of many pathogens (Kendall and Sperandio, 2016). Neurotransmitters alter gut physiology by modulating intestinal smooth muscle contraction, submucosal blood flow, barrier function, immune responses, and chloride and potassium secretion (Horger et al., 1998). The microbiota induces biosynthesis of serotonin (Yano et al., 2015) (Figure 1A), and a subset of its spore-forming members uptake serotonin through a homologue of the mammalian serotonin selective reuptake transporter (SERT) (Fung et al., 2019). Although a number of bacteria and viruses have been shown to influence serotonin signaling (Esmaili et al., 2009; Grondahl et al., 1998; Kordasti et al., 2004; O’Hara et al., 2006), the effect that serotonin has on bacterial pathogenesis remains elusive. This is particularly significant for enteric pathogens because 90% of serotonin is synthesized in the GI tract (Camilleri, 2009).
Figure 1: Serotonin decreases LEE gene expression and AE lesion formation in EHEC.
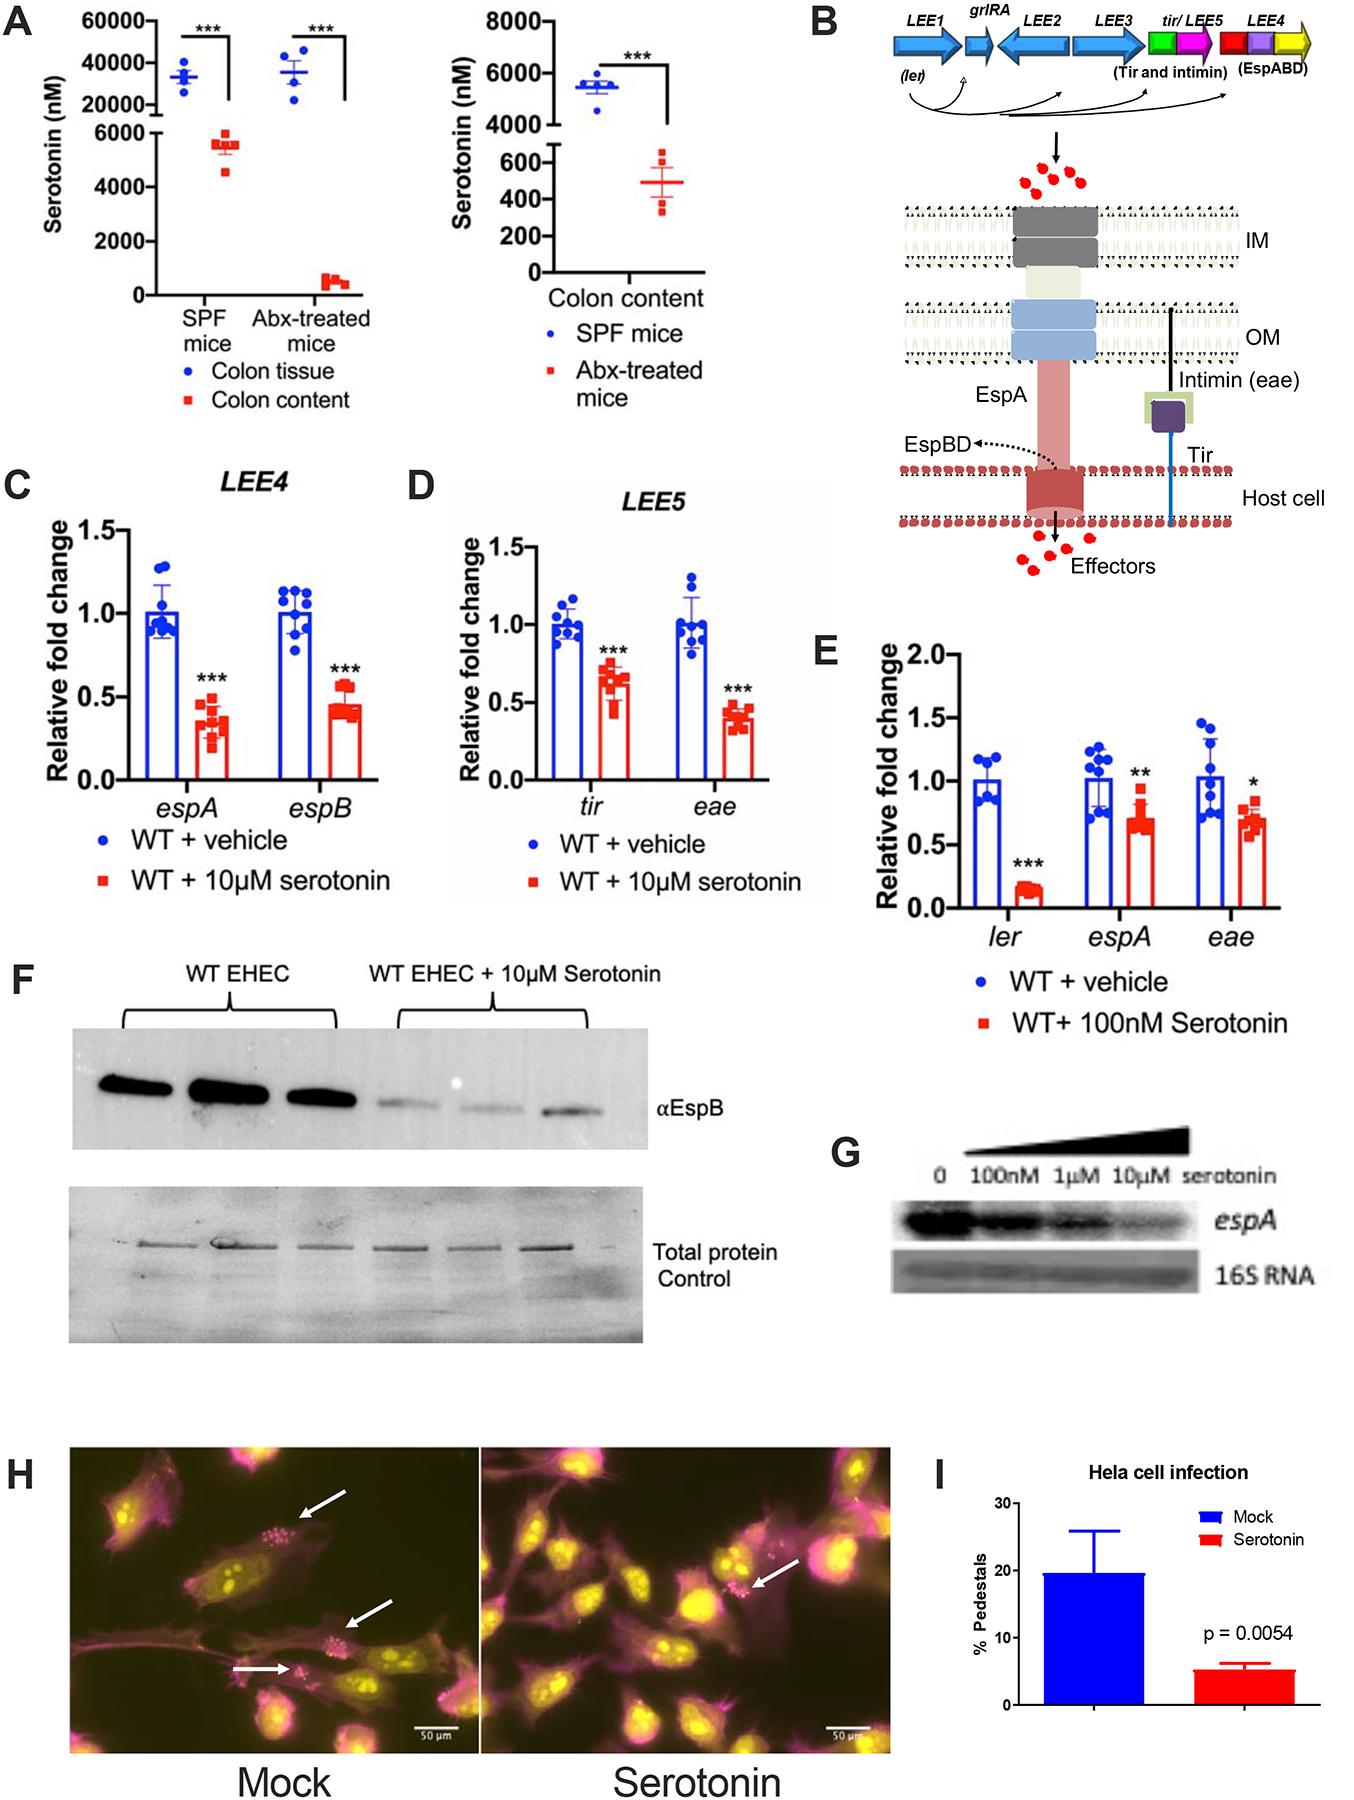
(A) Mass spectrometry measurement of serotonin concentrations obtained from colon tissue and colon contents of specific-pathogen free (SPF) or antibiotics treated microbiota-depleted (Abx-treated) C57BL/6 mice. Two-tailed unpaired t test was used to perform statistical analysis (n=4 mice per group, error bars represent standard error of mean (s.e.m), ***P<0.001).
(B) Cartoon representation of the LEE. The LEE harbors 41 genes organized in five operons (LEE1–5). The first gene within LEE1 encodes the Ler transcriptional activator of all LEE genes. Below is the schematic of type III secretion system that EHEC uses to inject effectors into the host cell.
(C-G) WT EHEC were grown aerobically in low glucose DMEM with or without serotonin. Bacterial cells were harvested in the late logarithmic phase at the same OD600 (same number of bacterial cells).
(C) qRT-PCR evaluating the transcription of espA and espB (LEE4) grown in the absence or presence of 10μM serotonin. ***P<0.001, Unpaired t test followed by multiple comparisons by Bonferroni-Dunn method.
(D) qRT-PCR evaluating the transcription of tir and eae (LEE5) grown in the absence or presence of 10μM serotonin. *** P<0.001, Unpaired t test followed by multiple comparisons by Bonferroni-Dunn method.
(E) qRT-PCR evaluating the transcription of ler, espA, and eae grown in the absence or presence of 100nM serotonin. ***P<0.001, **P<0.01, *P<0.05, Unpaired t test followed by multiple comparisons by Bonferroni-Dunn method. (C-E) rpoA was used as an internal control. Data are representative of three independent experiments.
(F) Secreted LEE-encoded EspB in WT with or without 10μM serotonin. BSA is used as a loading control. Total protein control is represented below the blot. Data are representative of two independent experiments.
(G) Northern blot showing the effect of increasing concentrations of serotonin on espA transcripts.
(H) AE lesion formation by EHEC in the absence or presence of 10μM serotonin. EHEC forms AE lesions on epithelial cells, whose hallmark is actin accumulation underneath the bacterial cell forming a pedestal-like structure. HeLa cells were left untreated or treated with 10μM serotonin. HeLa cells were then infected with EHEC for 6h at 5% CO2 at 37°C and subjected to fluorescent actin staining (FAS) assay depicting AE lesions. Cells were fixed, stained with FITC-phalloidin (actin; colored in pink) and propidium iodide (bacteria and HeLa DNA, colored in yellow) and observed with fluorescence microscopy.
(I) Quantification of FAS, pedestal/cell numbers (n=15). Scale bars, 50μm. Statistics were performed using unpaired t test. (C-E, and H) Data are mean ± standard deviation (s.d.). See also Figure S2.
The mammalian gut has a rich chemistry landscape, with metabolites, neurotransmitters and signals derived from both the host and the microbiota influencing the biogeography of the GI tract. Enteric bacterial pathogens sense and respond to these info-chemicals in their environment in a manner that culminates in the most spatiotemporal efficient expression of their virulence genes (Baumler and Sperandio, 2016). The colon contains tryptophan derivatives including the host-derived neurotransmitter serotonin (Esmaili et al., 2009; Grondahl et al., 1998; Kordasti et al., 2004; O’Hara et al., 2006) (Figure 1A), and the microbiota-derived indole (Kumar and Sperandio, 2019). Indole is absorbed by host cells and strengthens the integrity of the intestinal barrier, being regarded as a beneficial chemical cue within microbial/host interactions (Bansal et al., 2010). Indole also influences the gut-brain axis. Intestinal indole produced by the microbiota can accumulate in the brain leading to behavioral changes (Jaglin et al., 2018). Serotonin is synthesized by enterochromaffin cells by the enzyme tryptophan hydroxylase (TpH1). Upon its synthesis, serotonin is released into the lamina propria and is also secreted into the lumen. Serotonin signaling in the intestinal mucosa is terminated by its removal by SERT, which is expressed by enterocytes (Camilleri, 2009).
The neurotransmitters epinephrine and norepinephrine have been previously shown to be sensed by bacterial membrane-bound histidine sensor kinases (HKs) (Clarke et al., 2006a; Reading et al., 2009). HKs are the main sensory receptors in bacteria. They have both kinase and phosphatase activity. Upon sensing their signals, they can either be activated (kinase state) or deactivated (phosphatase state). As kinases they phosphorylate their cognate response regulators (RRs), the majority of which are transcriptional factors. Phosphorylation of RRs leads to conformational changes that increase their affinity to their DNA targets enhancing DNA binding. Termination of signaling occurs by auto-dephosphorylation of the HK, leading to dephosphorylation of the RR (Jung et al., 2012).
Here we show that serotonin decreases virulence gene expression of the human enteric pathogen EHEC, as well as the murine pathogen C. rodentium, which is extensively employed as a surrogate infection model for EHEC (Borenshtein et al., 2008). Transcriptomic, genetic and biochemical studies identified the HK CpxA as the serotonin receptor. CpxA also senses the bacterial signal indole, which is chemically similar to serotonin, comprising another example of inter-kingdom chemical signaling (Kumar and Sperandio, 2019). Utilizing knockout animals and pharmacological inhibitors for TpH1 and SERT, we also demonstrated that elevated intestinal levels of serotonin suppress virulence of C. rodentium, while elevated levels promote pathogenesis.
RESULTS
Serotonin decreases virulence gene expression in EHEC
It has been reported that the levels of serotonin varies within different GI compartments (Camilleri, 2009). Moreover, the microbiota itself induces the synthesis of serotonin (Fung et al., 2019; Hsiao et al., 2013). Here we show that the levels of serotonin in the colon tissues of mice remains similar at a mean concentration of 30μM whether or not they had their microbiota depleted through antibiotic treatment (Figure 1A). In contrast depletion of the microbiota has a profound effect on the luminal levels of serotonin, which decrease form a mean concentration of 5μM in microbiota replete to 500nM in microbiota depleted animals (Figure 1A). Because serotonin is structurally similar to indole, and indole decreases expression of virulence genes in EHEC (Kumar and Sperandio, 2019), we investigated whether serotonin would have a similar effect.
EHEC colonizes the human colon leading to outbreaks of bloody diarrhea and hemolytic uremic syndrome (HUS) worldwide (Kaper et al., 2004). EHEC virulence determinants include the production of the potent Shiga toxin (Stx) that causes HUS, and genes necessary for the attaching and effacing (AE) lesion formation on enterocytes. AE lesion formation requires genes contained within the locus of enterocyte effacement (LEE) pathogenicity island (PI) (McDaniel et al., 1995) (Figure 1B). The LEE region contains five major operons: LEE1–5 (Mellies et al., 1999), which encode the Ler transcriptional activator of all LEE genes, a type III secretion system (T3SS) that is a molecular syringe that injects bacterial effectors within the host cell, an adhesin (intimin that is encoded by the eae gene), and its receptor Tir that is itself translocated by the T3SS into the host cells (Stevens and Frankel, 2014). Expression of the LEE genes are decreased in the presence of physiological concentrations of serotonin (10μM and 100nM) as investigated through quantitative real-time PCR (qRT-PCR) (Figure 1C–E), Western (Figure 1F) and Northern blots (Figure 1G). Because serotonin decreases expression of the ler gene (Figure 1F) that encodes the transcription activator of all other LEE genes, it is congruent that expression of espA, espB, eae and tir are also decreased by serotonin (Figure 1C–G). Given that LEE expression is necessary for AE lesion formation, as expected, serotonin also decreases formation of these lesions by EHEC on epithelial cells (Fig. 1H,I).
To investigate the impact of serotonin in the EHEC transcriptome, RNAseq was performed. Serotonin treatment changed the expression of 68 genes, with 55 being downregulated and 13 up-regulated (GSE144795). Within the downregulated genes are the LEE genes (Figures 2A and S1). Notably, these small number of genes altered by serotonin in the EHEC transcriptome did not impact its growth (Figure S2A,B), or the expression of the flagella genes and motility (Figure S2C,D), suggesting that it is mostly involved in regulation of virulence gene expression.
Figure 2: CpxA is a bacterial serotonin sensor.

(A) Heat map showing expression of LEE encoded genes and the serotonin sensor kinase CpxA. WT EHEC in the presence or absence of 10μM serotonin were grown until late logarithmic phase aerobically. RNA sequencing analysis was performed from the extracted RNA.
(B) qRT-PCR of cpxA from WT EHEC grown in the presence of 10μM serotonin. ***P<0.001, unpaired t test.
(C) qRT-PCR of the LEE-encoded espA from WT and ΔcpxA EHEC grown in the presence or absence of 10μM serotonin. Bacterial cells were collected in late logarithmic phase at the same OD600 (same number of bacterial cells) and RNA were extracted for qRT-PCR. *P<0.05, ***P<0.001, one-way ANOVA followed by Tukey’s multiple comparisons test.
(D) Autophosphorylation of CpxA (loaded in liposomes) in the presence or absence of 10μM each of serotonin and tryptophan. Samples were run on 12% stain-free SDS-PAGE gel. CpxA loaded liposomes were visualized using Chemi-Doc. Autoradiography were obtained by using phosphorimager.
(E) Autophosphorylation signal were quantified using image quant. (n=3, one-way ANOVA followed by Tukey’s multiple comparison test, **P<0.01, ***P<0.001).
(F) Binding of 5μM tritiated serotonin to CpxA loaded liposomes. Tritiated signals were measured using scintillation counter. *P<0.05, unpaired t test.
(G) Binding of 5μM tritiated tryptophan to CpxA loaded liposomes. Tritiated signals were measured using scintillation counter.
(H) qRT-PCR of espA (LEE4) in WT, ΔcpxA, ΔcpxR, and complemented strains. **P<0.01, ****P<0.0001, one-way ANOVA followed by Tukey’s multiple comparisons test.
(I) FAS assays. HeLa actin was stained green with FITC phalloidin while HeLa nuclei and bacteria were stained red with propidium iodide. Formation of pedestals (AE lesions) was visualized as bright green (actin) cups onto which red bacterial dots bound. Scale bars, 20μm
(J) qRT-PCR of ler in WT and ΔcpxR strain. *P<0.05, unpaired t test. (B-C, H, and J), rpoA was used as an internal control.
(K) Electrophoretic mobility shift assay (EMSA) of kan (negative control) and LEE1 with phosphorylated CpxR.
(L) Cartoon depicting LEE regulation by CpxAR. Serotonin prevents CpxA autophosphorylation, and consequently CpxR phosphorylation leading to decreased LEE expression. (B-E, H, and J) Data are representative of three independent experiments. (F-G, I, and K) Data are representative of two independent experiments. (B-C, E-H, and J) Data are mean ± s.d. ns is not significant. See also Figures S1, S2, and S3.
The HK CpxA senses serotonin
Previous studies have linked neurotransmitter sensing by bacterial pathogens to membrane bound HKs (Clarke et al., 2006b; Moreira et al., 2009; Reading et al., 2009). HKs have both kinase and phosphatase activities, and can either increase or decrease their phosphorylation upon sensing a signal (Jung et al., 2012). QseC and QseE, for example, have been shown to sense epinephrine and norepinephrine (Clarke et al., 2006b; Moreira et al., 2009; Reading et al., 2009). Small molecules that are sensed by bacteria for differential gene regulation also tend to differentially regulate expression of their HK (Clarke et al., 2006b). Using the same concept, we searched the serotonin transcriptome for HKs that were differentially regulated by this neurotransmitter. The only HK whose expression was significantly regulated by serotonin was CpxA (Figures 2A,B and S1B). CpxA senses indole (Kumar and Sperandio, 2019), a tryptophan derived bacterial signal (Wang et al., 2001) that is structurally similar to serotonin, and has also been shown to decrease LEE gene expression in EHEC (Kumar and Sperandio, 2019). Using genetic and biochemical phenotypic analyses, we showed that CpxA also senses the mammalian neurotransmitter serotonin (Figure 2C–H). Transcription of espA is decreased by serotonin in EHEC WT but is not altered in ΔcpxA (Figure 2C). Moreover, serotonin, but not tryptophan, decreases CpxA auto-phosphorylation (Figure 2D,E). Tritiated serotonin binds to CpxA reconstituted in liposomes (Figure 2F), while tryptophan does not bind to CpxA (Figure 2G). CpxA is part of the CpxRA two-component system, where CpxA is a HK that upon autophosphorylation, phosphotransfers its phosphate to the RR CpxR, which is a transcriptional factor that regulates gene expression. HKs can phosphorylate and dephosphorylate their RRs, and in its phosphorylated state CpxR binds to its DNA targets. Dephosphorylation of RRs inhibits their function (Jung et al., 2012). In its active state the CpxRA system activates transcription of the LEE genes, with transcription of espA being decreased in ΔcpxA and ΔcpxR, and restored upon complementation (Figure 2H). EspA expression is needed for AE lesion formation, and congruently ΔcpxA is defective for AE lesion formation (Figure 2I). CpxRA regulation occurs at the level of ler (the first gene within the LEE1 operon) transcription (Figures 2J, S3A–D), consequently, impacting transcription of all LEE genes, inasmuch as Ler is needed for their expression (Mellies et al., 1999). In its phosphorylated state CpxR directly binds to and activates transcription of ler (LEE1) (Figures 2K and S3C). Dephosphorylation of RRs inhibits their function. Upon serotonin dependent dephosphorylation of CpxA (Figure 2D,E), CpxR is also dephosphorylated, and the dephosphorylated RR can no longer bind to the ler regulatory region to activate its transcription. Consequently, by blocking activation of CpxA, serotonin inhibits LEE gene expression in EHEC (Figure 2B–L).
To gain insights into the structure analysis relationship (SAR) of serotonin signaling to EHEC, we also investigated whether other synthetic serotonin analogs decreased LEE gene expression. All of the analogs tested (tryptamine, 3-indole acetonitrile, 5-hydroxyindole acetic acid, 3-indole acetic acid, 5-hydroxyindole) decreased LEE transcription (Figure S4), suggesting that minor chemical changes within the structure of serotonin does not ablate serotonin’s effect on LEE gene expression. This is congruent with CpxA also sensing indole (Kumar and Sperandio, 2019). These data show that CpxA biochemically converge inter-kingdom chemical signaling, with one receptor sensing both bacterial and host derived chemically related signals.
Serotonin also decreases expression of the LEE genes in C. rodentium in a CpxA-dependent manner (Figure S5A). C. rodentium is a natural murine pathogen that also harbors the LEE genes, colonizes the colon of mice leading to disease, and is extensively used as a surrogate murine infection model for EHEC, given that EHEC is unable to cause disease in mice (Luperchio and Schauer, 2001). The utilization of the C. rodentium model capitalizes in merging the powerful genetically tractability of host and pathogen to unravel the mechanisms involved in host recognition and infection. However, a C. rodentium cpxRA deletion strain is heavily attenuated and can’t colonize mice (Thomassin et al., 2015), as is a ΔcpxA strain (Kumar and Sperandio, 2019), thereby limiting the ability to analyze serotonin signaling through the CpxRA system during murine infection.
We note that congruent with our results, downregulation of the LEE (EspA, EspB and EspD proteins; as well as transcription of ler and grlRA) was reported in EHEC ΔcpxA. However, in contrast to our data, LEE expression was not altered in ΔcpxR (EspA, EspB and EspD proteins) in the De la Cruz study (De la Cruz et al., 2016). The discrepancy observed in CpxR regulation of the LEE can be explained by the use of different environmental conditions: we used low glucose DMEM (the in vitro condition in which the LEE is optimally expressed (Carlson-Banning and Sperandio, 2016; Njoroge et al., 2012)), while De La Cruz et al. (De la Cruz et al., 2016) used high glucose DMEM. Moreover, we also note that these studies employed different EHEC strains. Our study was performed with strain 86–24, which was isolated in 1986 from a patient that suffered from hemorrhagic colitis after eating undercooked meat (Griffin et al., 1988), and has been used in all EHEC animal models to study EHEC infection and disease (Dean-Nystrom et al., 1998; Donnenberg et al., 1993; McKee et al., 1995; Mohawk et al., 2010a; Mohawk et al., 2010b; Rasko et al., 2008a; Vazquez-Juarez et al., 2008; Woods et al., 2002). The De la Cruz study employed EHEC strain EDL933 (Riley et al., 1983). EspA, EspB and EspD proteins are encoded within the LEE4 operon, which is highly post-transcriptionally regulated (Gruber and Sperandio, 2014, 2015; Lodato et al., 2012; Lodato and Kaper, 2009). Moreover post-transcriptional regulation has opposing effects in LEE expression between strains 86–24 and EDL933 (Hansen and Kaper, 2009; Kendall et al., 2011; Shakhnovich et al., 2009). Previous transcriptomic studies in C. rodentium with ΔcpxRA mutants did not identify LEE genes (Giannakopoulou et al., 2018; Vogt et al., 2019). Although we did not perform transcriptome studies with our C. rodentium ΔcpxA, previous studies (Kumar and Sperandio, 2019) and Fig S5A show that transcription of the LEE is decreased in C. rodentium ΔcpxA in the conditions we used, we again, highlight different environmental conditions between these and our studies. The Giannakopoulou et al. and Vogt et al. studies employed DMEM high glucose, while we used DMEM low glucose.
Modulation of intestinal levels of serotonin impact C. rodentium pathogenesis
In our studies we use a C. rodentium strain engineered to produce Shiga toxin (Stx) (DBS770), which when inoculated into mice display key aspects of EHEC disease in humans: formation of AE lesions, Shiga toxin-dependent intestinal inflammation, kidney damage and lethality. Of note AE lesion formation was found to promote Shiga toxin systemic translocation, and consequently lethality in this model. The disease caused by the DBS770 strain has been extensively documented (Curtis et al., 2014; Kumar and Sperandio, 2019; Mallick et al., 2012; Pifer et al., 2018). Therefore the DBS770 mouse model is a strong in vivo model for studying EHEC pathogenesis.
SERT knockout mice (SERT−/−) have elevated levels of serotonin in the intestinal lumen (Fung et al., 2019) (Figure 3A), given that SERT removes serotonin from the mucosa (Camilleri, 2009). C. rodentium colonization, pathogenesis and virulence gene expression was decreased in SERT−/− mice compared to WT (Figure 3B–J). SERT−/− mice presented decreased loads of C. rodentium in feces and colon tissues (Figure 3B,C), and decreased mortality upon C. rodentium infection (Figure 3F) compared to WT animals. Given that colonization and attachment to the colon requires LEE expression (Deng et al., 2004), and serotonin decreases transcription of the LEE genes, as expected, transcription of espA and tir was decreased in the colon tissues of SERT−/− mice (Figure 3D,E). Moreover, although uninfected SERT−/− mice present increased intestinal pathology compared to WT, C. rodentium-induced overall pathology in SERT−/− is decreased compared to WT (Figure 3G,H). The baseline levels of the IL22 cytokine and the CXCL1 chemokine are similar in the colon tissues of uninfected WT and SERT−/− mice, and C. rodentium infection increase their levels only in WT animals (Figure 3I,J). To further probe whether increased levels of luminal serotonin decreased C. rodentium virulence gene expression and pathogenesis, we also pharmacologically inhibited SERT using fluoxetine (Prozac). Prozac treatment increases serotonin concentration in the intestine (Fung et al., 2019). In agreement with the SERT−/− data, animals treated with Prozac had decreased pathogen loads in feces, colon and cecum tissues and content, as well as decreased LEE gene (espA and tir) expression compared to untreated animals (Figure 4A–J). Although Prozac has been reported to have antimicrobial activity at a minimal inhibition concentration of 100μg/ml (Karine de Sousa et al., 2018), the estimated intestinal concentration for Prozac with a 20mg/kg dose in humans is approximately 20μM which is 6.2μg/ml (Maier et al., 2018), and at these concentrations we don’t think the growth inhibitory effect of Prozac will be relevant in the context of the present study. Moreover, growth of C. rodentium with this concentration of Prozac is not affected. Because the microbiota also increases the levels of serotonin in the intestine (Yano et al., 2015) (Fig. 1A), we also depleted the microbiota of WT and SERT−/− animals. This regimen of microbiota depletion with a 4 antibiotic cocktail, has been previously shown to deplete more than 90% of the microbiota (Curtis et al., 2014; Kumar and Sperandio, 2019; Kuss et al., 2011). The differences in susceptibility to infection between WT and SERT−/− animals were less prominent with depletion of the microbiota (Figure S5B). However, the expression of the LEE genes was significantly decreased in C. rodentium infecting SERT−/− animals compared to WT (Figure S5C). These data show that in vivo during murine infection, with or without the microbiota, the changes in serotonin levels in the intestine of SERT−/− mice are biologically relevant to change LEE transcription in C. rodentium. Although SERT−/− mice have been shown to have altered composition of the microbiota (Singhal et al., 2019), which could potentially impact the levels of indole in the gut, Bacteroidetes and Proteobacteria account for the majority of the indole in the gut (Kumar and Sperandio, 2019), and there is no significant change in the abundance of these phyla in the Singhal study (Singhal et al., 2019). Taken together these data indicate that serotonin accumulation in the intestine decreases virulence gene expression in C. rodentium, leading to decreased host susceptibility to this pathogen.
Figure 3: Accumulation of luminal serotonin decreases C. rodentium virulence during murine infection.

(A) Mass spectrometry measurements of serotonin levels recovered from cecum of WT C57BL/6 and SERT−/− mice. n=4, *P<0.05, two-tailed unpaired t test.
(B-C) Measurement of bacterial colony forming units (CFU) from WT C57BL/6 and SERT−/−mice infected with WT C. rodentium to estimate bacterial burden from (B) feces at day 3 post-infection and (C) attached bacteria from colon tissue at day 5 post-infection.
(D-E) qRT-PCR on select virulence genes (D) espA and (E) tir obtained from colon tissue attached bacterial cells at day 5 post-infection. rpoA was used as an internal control. (B-E) **P<0.01, *P<0.05, two-tailed Mann Whitney U test, each data point represents an individual mouse. (A-E) Data are mean ± s.e.m.
(F) Survival curves of WT (n = 10) and SERT−/− (n = 9) mice infected with WT C. rodentium. PBS (n =5) mice each group were used as a negative control. Statistics are shown using log-rank (Mantel-Cox) test, n = number of mice.
(G) Haematoxylin and eosin-stained colon tissues of uninfected or C. rodentium (DBS770) infected WT or SERT−/− mice at day 4 post-infection. Scale bars, 100μm.
(H) Blinded histopathology scores of uninfected or C. rodentium (DBS770) infected WT and SERT−/− mice. n=3–4 mice per group were used. * P <0.05, **P<0.01, ***P<0.001, Two-way ANOVA followed by Tukey’s multiple comparisons test. Data are mean ± s.e.m.
(I-J) WT C57BL/6 and SERT−/− mice were left uninfected or infected with WT C. rodentium. RNA was extracted from colon tissues and qRT-PCR were performed on select (I) cytokine IL22, and (J) chemokine CXCL1 at day 5 post-infection. Gapdh was used as an internal control. *P<0.05, **P<0.01, one-way ANOVA followed by Bonferroni’s multiple comparisons test. n = 5 mice per group infected with C. rodentium, n = 4 mice per PBS control group. Data are mean ± s.e.m. See also Figure S5.
Figure 4: Prozac decreases C. rodentium colonization and virulence in vivo.

(A) Schematic of proxac (Fluoxetine) treatment and mice infection. WT C57BL/6 mice were orally gavaged with 20mg/kg Prozac (Fluoxetine) or water, and mice were infected with C. rodentium.
(B-D) Bacterial counts (CFU) were enumerated from (B) feces day 4 post-infection, (C) colon contents, and (D) colon tissue at day 6 post-infection. *P<0.05, **P<0.01, unpaired t test.
(E-F) RNA extracted from colon tissue were used to perform qRT-PCR on select virulence genes (E) espA, and (F) tir at day 6 post-infection. rpoA was used as an internal control. ***P<0.001, *P<0.05, two-tailed Mann Whitney U test.
(G-H) Bacterial counts (CFU) were enumerated from (G) cecum content, (H) cecum tissue at day 6 post-infection.
(I-J) RNA was extracted from cecum tissue and qRT-PCR were performed on select virulence genes (I) espA, and (J) tir at day 6 post-infection. rpoA was used as an internal control. **P<0.01, *P<0.05, two-tailed Mann Whitney U test. (B-J) Data are mean ± s.e.m, each data point represents an individual mouse.
Enterochromaffin cells synthesize serotonin through the enzyme TpH1. Pharmacological inhibition of TpH1 in mice treated with 4-chloro-DL-phenylalanine methyl ester hydrochloride (PCPA) decreases the levels of luminal serotonin (Figure 5A,B). PCPA treated animals were more susceptible to C. rodentium infection succumbing more rapidly to disease and death whether their microbiota was depleted or not (Figures 5C and S6B). Microbiota depleted animals treated with PCPA presented increased CFUs in stools (Figure 5D), and pathology upon C. rodentium infection (Figure 5F,G). PCPA-treated microbiota deplete animals had more pronounced weight loss (Figure S6A). Expression of the LEE genes (espA and tir) was also increased in microbiota-depleted PCPA treated animals (Figure 5E). The effect of intestinal serotonin depletion in infection could be observed whether the animals were microbiota depleted (Figure 5) or not (Figure S6). Because this effect was noted in animals depleted of microbiota, it again indicates that the effect of serotonin on C. rodentium pathogenesis is host derived. It is worth noting that in animals treated with the TpH1 inhibitor PCPA, the use of ritanserin, which is a mammalian serotonin receptor antagonist that also antagonizes the effect of serotonin in LEE gene expression (Figure 6A), abolished the PCPA effect in promoting C. rodentium murine infection (Figure 6B). Altogether these murine infection studies support the in vitro data that serotonin inhibits virulence gene expression in EHEC and C. rodentium. However, the effect of this neurotransmitter may vary depending on the pathogen and disease process, as well as the age of the host. It is interesting, that serotonin supplementation enhanced Pseudomonas aeruginosa virulence in infant mice (Knecht et al., 2016).
Figure 5: Decrease of luminal serotonin increases C. rodentium virulence during murine infection.
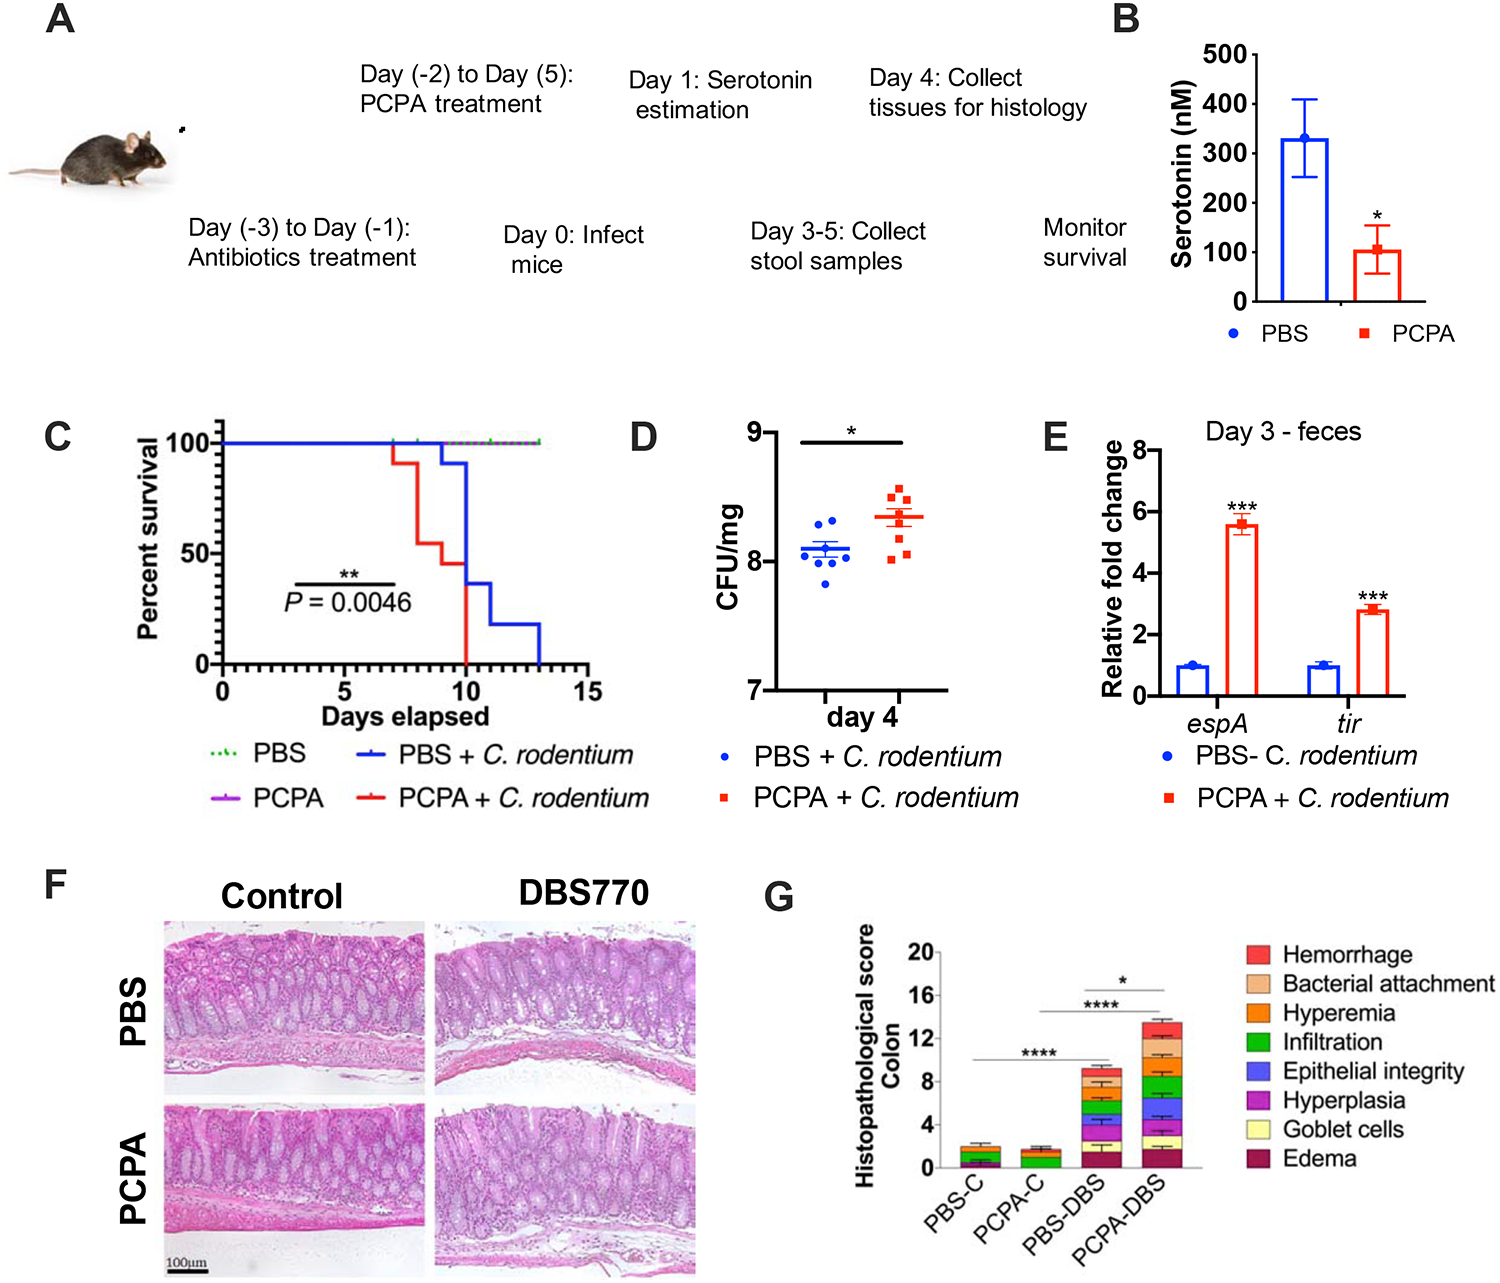
(A) Schematic of PCPA treatment and mice infection. Microbiota-depleted WT C57BL/6 mice were treated with PCPA and infected with C. rodentium. Samples were collected on the indicated days.
(B) Serotonin (5HT) quantification from the colon contents of the mice treated either with 300mg/kg 4-chloro-DL-phenylalanine methyl ester hydrochloride (PCPA) or equivalent amount of PBS per mice intraperitoneally. Administration of PCPA was started two days prior to infection and the measurements were made from mice sacrificed one day post-infection. *P<0.05, unpaired t test, n=4 mice per group, data are mean ± s.e.m.
(C) Survival curves of microbiota-depleted WT C57BL/6 mice treated intraperitoneally with either PBS or PCPA and then left uninfected (PBS negative control) or infected with WT C. rodentium. n =10 mice per group were used for C. rodentium infection, n = 4 mice per group were used as PBS control. Statistics are shown using log-rank (Mantel-Cox) test, n = number of mice.
(D) Bacterial counts (CFU) were enumerated from feces of untreated or PCPA-treated mice infected with C. rodentium, day 4 post-infection. *P<0.05, two-tailed Mann Whitney U test, each data point represents an individual mouse. Data are mean ± s.e.m.
(E) qRT-PCR on select virulence genes espA and tir obtained from RNA extracted using stools of PBS and PCPA treated animals infected with C. rodentium at day 3 post-infection. Pooled feces from three cages (n=3–4 mice per cage for a total of 10 mice per group) per group were used to obtain sufficient RNA. rpoA was used as an internal control. ***P<0.001, unpaired t test, followed by multiple comparisons using Bonferroni-Dunn method. Data are mean ± s.e.m.
(F) Haematoxylin and eosin-stained colon tissues of PBS and PCPA treated and then uninfected (PBS) or C. rodentium (DBS770) infected WT C57BL/6 mice at day 4 post-infection. Scale bars, 100μm.
(G) Blinded histopathology scores of uninfected or C. rodentium (DBS770) infected PBS or PCPA treated C57BL/6 mice. n=3–4 mice per group were used. * P <0.05, ****P<0.0001, Two-way ANOVA followed by Tukey’s multiple comparisons test. Data are mean ± s.e.m. See also Figure S6.
Figure 6: Serotonin receptor antagonist, ritanserin, augments EHEC virulence and C. rodentium infectivity in mice.

(A) WT EHEC were grown in the presence and absence of either serotonin, ritanserin or an equimolar mixture of ritanserin and serotonin in low glucose DMEM. qRT-PCR performed on select virulence gene espA. rpoA was used as an internal control. ***P<0.001, one-way ANOVA followed by Bonferroni’s multiple comparisons test.
(B) Survival curves of microbiota-depleted WT C57BL/6 mice treated intraperitoneally with either PBS, PCPA, or ritanserin and then left uninfected (PBS negative control) or infected with C. rodentium. n = 11 mice per group were used for C. rodentium infection, n = 4 mice per group were used as PBS control. Statistics are shown using log-rank (Mantel-Cox) test compared to PBS + C. rodentium group, n = number of mice.
DISCUSSION
The microbiota-gut-brain axis has gained increased attention as the microbiome field expanded. However, most of the work has been restricted to description of alterations in the microbiota membership and correlations with inflammation and neurological outcomes (Mayer et al., 2014), with a scarcity of mechanistic studies being performed. The enteric nervous system (ENS) highly innervates the GI tract, ensuring prominence of neurotransmitters in the gut. Here we identify a serotonin bacterial receptor, CpxA, which also alters the outcomes of infection with enteric pathogens. Importantly, the fact that bacteria have receptors to neurotransmitters opens a broad array of possibilities on how the gut-brain axis functions as a two-way street between microbes and their mammalian hosts. This knowledge is especially compelling given that various serotonin agonists and antagonists have been developed to treat diarrhea-predominant inflammatory bowel disease (IBD) and/or constipation. The fact that one can conceptually co-opt these drugs already used in the clinic (e.g. Prozac) to treat infectious diseases is potentially exciting.
CpxA also recognizes the microbiota-derived signal indole (Kumar and Sperandio, 2019; Wang et al., 2001). It is also noteworthy that indole produced by the gut microbiota can accumulate in the brain impacting host behavior (Jaglin et al., 2018). This integration of inter-kingdom signaling by one HK sensing a host neurotransmitter and a bacterial signal seems to be a recurring theme in biology. The bacterial adrenergic receptor QseC also senses the bacterial AI-3 signal, which is a family of pyrazinone molecules. Although AI-3 does not impact mammalian adrenergic signaling, it has immune modulatory activity (Kim et al., 2020). Importantly, these inter-kingdom signaling systems that engage neurotransmitters may not be restricted to impacting the pathogenesis of EHEC and C. rodentium. Many GI pathogens, such as Salmonella, Yersinia enterocolytica, Shigella disenteria, and others, encode the CpxA serotonin/indole receptor.
STAR METHODS
RESOURCE AVAILABILITY
Lead contact
Further information and requests for resources and reagents should be directed to and will be fulfilled by the Lead Contact, Vanessa Sperandio (vanessa.sperandio@utsouthwestern.edu).
Materials availability
This study did not generate new unique reagents.
Data and code availability
The RNA-Seq data generated during this study are available at NCBI GEO database and can be accessed using accession number GSE144795.
EXPERIMENTAL MODEL AND SUBJECT DETAILS
Mice
Mice were housed under specific pathogen-free conditions and maintained on a 12hr light/dark cycle with unlimited access to water and food (Telkad Global 16% Protein Rodent Diet, Envigo). We used 7–8 weeks old female C57BL/6 mice purchased from The Jackson Laboratory. Mice were subjected to randomized mixing between the experimental groups prior to every experiment. Mice were used as hosts for all our infection studies. All experiments were performed using protocols approved by UT Southwestern institutional animal care and use committee (IACUC).
Epithelial Cells
HeLa cells were obtained from ATCC and kept stored in liquid nitrogen until used. They were grown in DMEM supplemented with 10% fetal bovine serum (FBS) and 1% penicillin/streptomycin/gentamicin (PSG) antibiotic mix at 37°C, 5% CO2.
Microbial Strains
Enterohemorrhagic E. coli (EHEC) strains 86–24, and Citrobacter rodentium strain DBS770 were cultured in suspension on Luria Bertani (LB) broth or Dulbecco eagle medium (DMEM). EHEC and C. rodentium at log-phase growth was mixed with autoclaved glycerol (25% final concentration) and kept as stocks at 80°C.
METHOD DETAILS
Strains, plasmids, growth and culture conditions
Strains and plasmids are listed in Table S1. For aerophilic conditions, cultures were grown under shaking conditions at 37°C and 200 rpm. Bacterial strains were grown in low-glucose DMEM, and the cultures were harvested in late logarithmic growth phase (O.D600 = 1.0) unless stated otherwise. HeLa cells were routinely cultured in high-glucose DMEM, defined as 4.5 g/liter glucose, DMEM, 10% FBS, and penicillin plus streptomycin plus glutamine (PSG) cocktail. To express the type III secretion system (T3SS) low glucose (1g/l) Dulbecco’s modified eagle medium (DMEM) was used as these conditions have been shown to induce the T3SS (Njoroge et al., 2012).
Recombinant DNA techniques
Molecular biology techniques were performed as previously described(Sambrook, 1989). Primers used in qRT-PCR, cloning, and mutant construction are listed in Table S2.
Isogenic mutant construction
Construction of isogenic ΔcpxA and ΔcpxR in EHEC and C. rodentium was performed using lambda-red mutagenesis as previously described (Datsenko and Wanner, 2000). The primers used to construct mutations are described in Supplementary Table 2. Briefly, a PCR product was generated using primers containing homologous regions to sequences flanking cpxA and cpxR genes to amplify a kanamycin resistant gene from pKD4. EHEC cells harboring pKD46 were electroporated using the PCR product and colonies were selected from kanamycin LB plates. Nonpolar mutants were generated using resolvases contained into a pCP20 plasmid to cleave off the kanamycin-gene. Complementation experiments were conducted using PCR products flanked with cloned into pACYC184 (NEB) were used as backbones for complementation vectors created with the Gibson cloning kit (NEB).
RNA extraction and qRT-PCR
Strains were grown in the presence or absence of serotonin until late log phase. RNA from three biological replicates was extracted using the RiboPure bacterial isolation kit according to the manufacturer’s protocols (Ambion). Quantitative reverse transcription-PCR (qRT-PCR) was performed as follows. Briefly, 2μg of diluted extracted RNA was converted to cDNA with addition of superscript, random primers, DTT, and dNTPs. Validated primers (Supplementary table 2) and SYBR green were added to the cDNA, and the mix was run in Quantstudio 6 flex (Applied Biosystems). Data were collected using QuantStudio real-time PCR software v1.3, normalized to endogenous rpoA and rpoZ levels, and analyzed using the comparative cycle threshold (CT) method. For all the in vitro experiments, error bars indicate standard deviations (SD). A P value of less than 0.05 was considered significant.
Western blot for secreted proteins
From cultures grown in DMEM, secreted proteins were isolated as previously described (Jarvis et al., 1995). Ten micrograms of bovine serum albumin (BSA) was added to secreted protein samples as a loading control. Proteins were separated on a 12% SDS-PAGE gel, transferred to a polyvinylidene fluoride (PVDF) membrane, and blocked with 3% milk in PBS containing 0.05% Tween (PBST). Membranes were probed with anti-EspB primary antibody, washed, and then incubated with a secondary antibody conjugated to streptavidin-horseradish peroxidase. GE enhanced chemiluminescence (ECL) reagent was added and the membranes were exposed to either film or using the Bio-Rad ChemiDoc™ Touch Imaging System (Software 1.0.0.15) with Image Lab 5.2.1 software for image display. Each growth condition was repeated a minimum of three times.
Fluorescein actin staining assays
Assays were performed as described (Knutton et al., 1989). Briefly, HeLa cells were grown overnight to about 80% confluence at 37°C, 5% CO2 on coverslips in wells containing DMEM supplemented with 10% FBS and 1% PSG antibiotic mix. Prior to infection, fresh medium lacking antibiotics replaced overnight medium. To infect HeLa cells, overnight static bacterial cultures were infected with a MOI of 100. After 6 hrs of infection, the coverslips were washed, fixed, and permeabilized. The samples were treated with fluorescein Isothiocyanate (FITC)-labeled phalloidin to visualize actin accumulation and propidium iodide to visualize bacterial DNA and Hela nuclei, respectively. The coverslips were then mounted on slides and imaged with a Zeiss Axiovert microscope. Pedestal formation was quantified as percentage of pedestals formed per attached bacterium. Replicate coverslips from multiple experiments were quantified, and statistical analyses were performed using Student’s unpaired t test. Serially diluted samples of the original bacterial cultures were also plated to confirm that similar CFU ratios were used for infection.
Northern blots
RNA was extracted using the Ribopure kit (Ambion) and run on a 1% formaldehyde agarose gel and transferred overnight to a Zeta-Probe Membrane (Bio-Rad). RNA probes were created by PCR amplification of a segment of the gene of interest with T7 promoter and in vitro transcribing using the Maxiscript T7 kit (Ambion) with radiolabeled α-UTP. The oligo probe for the 16S endogenous control was labeled with γ-ATP using T4 polynucleotide kinase (NEB). The membranes were then hybridized ON using Ultrahyb (Ambion). The membranes were washed and exposed to a phosphorimager screen overnight and then visualized with a STORM scanner (GE Healthcare).
RNA sequencing library preparation and analysis
Briefly, RNAs extracted from three biological replicates were used to perform RNA sequencing experiments. Sequencing was run at the University of Texas (UT) Southwestern Medical Center Next Generation Sequencing (NGS) core. RNA libraries were prepared using Illumina ScriptSeq Complete kit (Bacteria). RNA libraries were run on an Illumina NextSeq sequencer with SE-75. To analyze the data, DNASTAR Lasergene software was used. Reads were mapped to the Escherichia coli O157:H7 strain sakai genome (NCBI txid 386585). Data were analyzed using ArrayStar, and all experiments were normalized by reads assigned per kilobase of target per million mapped reads (RPKM). Statistical significance was calculated using Student’s t test followed by FDR (Benjamini Hochberg) correction. A P value of ≤ 0.05 was considered significant.
Membrane protein purification
E. coli (BL21 DE3) bacteria harboring pET21a-CpxA (His tagged) were grown until stationary phase (optical density [OD] of ~0.7 to 0.8). Cultures were induced with 0.1 mM IPTG and grown further at 18°C overnight. The bacterial cultures were spun down at 10,000 rpm and 4°C for 30 min, and the pellets were stored at −80°C until further use. The bacterial pellets were resuspended in lysis buffer (50 mM Tris [pH 8.0], 150 mM NaCl, 2% lauryldimethylamine N-oxide [LDAO], 10% glycerol), and protease inhibitor cocktail (PIC) was added. The lysates were sonicated for 30 s (on) and 30 s off for 8 min at 85% amplitude, followed by centrifugation at 10,000 rpm and 4°C for 30 min. The supernatants were filtered using 0.22-μm filter tube. Ni-NTA beads (500μl) were added to 40 ml of lysate and kept on a shaker for up to 2hr at 4°C to allow protein binding to the Ni beads. The bound lysates were passed through 5-ml disposable columns twice. The column was washed with 5 column volumes (CV) of wash buffer (50 mM Tris [pH 8.0], 150 mM NaCl, 30 mM imidazole). Proteins were eluted from the column by adding elution buffer (50 mM Tris [pH 8.0], 150 mM NaCl, 250 mM imidazole). The eluted proteins were concentrated using Amicon Ultra 15 centrifugal filter units (10kDa), and excess imidazole was removed by adding 50 mM Tris (pH 8.0) and 150 mM NaCl as a dialyzing buffer. The protein concentration was estimated using Bradford assay and were immediately loaded on liposomes for autophosphorylation assays.
Autophosphorylation assays
These experiments were performed as previously described (Clarke et al., 2006b; Pacheco et al., 2012; Rasko et al., 2008b; Reading et al., 2009). Liposomes were reconstituted as described by Janausch et al. (Janausch et al., 2002). Briefly, 50 mg of E. coli phospholipids (Avanti Polar Lipids; 20 mg/ml in chloroform) were evaporated and then dissolved into 5 ml phosphate buffer containing 80 mg N-octyl-β-D-glucopyranoside. The solution was dialyzed overnight against phosphate buffer. The resulting liposome suspension underwent freeze/thawing in liquid N2. The liposomes were stored at −80°C until further use. The liposomes (1 ml) were then destabilized by the addition of 5.8 mg dodecylmaltoside, and CpxA-His was added in the ratio of 40:1, stirring at room temperature for 10 min. Biobeads (58 mg) were then added to remove the detergent, and the resulting solution was allowed to incubate at 4°C overnight. The supernatant was then incubated with fresh Biobeads (58 mg) for another hour. The resulting liposomes containing reconstituted CpxA-His was used for autophosphorylation experiments. Ten microliters of the CpxA-His liposome were adjusted to 10 mM MgCl2,1 mM DTT, 10μM serotonin, 10μM tryptophan or no signal, freeze/thawed rapidly in liquid N2, and kept at room temperature for 1 h. [γ−32P] ATP (0.25μl) was added to each reaction mixture. At each time point, 2μl of 5× SDS loading buffer was added to stop the reaction. The samples were run on 12% SDS-PAGE according to standard procedures and visualized via a phosphorimager (Typhoon FLA 9500; GE).
Binding studies
Binding of serotonin to CpxA were performed using liposomes that enabled CpxA to maintain its native conformation. Binding assays were performed as an extension to autophosphorylation assay as described previously (Clarke et al., 2006b; Pacheco et al., 2012; Rasko et al., 2008b; Reading et al., 2009). Briefly, 50 mg of E. coli phospholipids (Avanti Polar Lipids; 20 mg/ml in chloroform) were evaporated and then dissolved into 5 ml phosphate buffer containing 80 mg N-octyl-β-D-glucopyranoside. The solution was dialyzed overnight against phosphate buffer. The resulting liposome suspension underwent freeze/thawing in liquid N2. The liposomes were stored at −80°C until further use. The liposomes (1 ml) were then destabilized by the addition of 5.8 mg dodecylmaltoside, and CpxA-His was added in the ratio of 40:1, stirring at room temperature for 10 min. Biobeads (58 mg) were then added to remove the detergent, and the resulting solution was allowed to incubate at 4°C overnight. The supernatant was then incubated with fresh Biobeads (58 mg) for another hour. The resulting liposomes containing reconstituted CpxA-His was used for binding experiments. Ten microliters of the CpxA-His liposome were adjusted to 10 mM MgCl2,1 mM DTT, 5μM tritiated serotonin, 5μM tritiated tryptophan or no signal, freeze/thawed rapidly in liquid N2, and kept at room temperature for 1 h. 5X loading buffer (without SDS) was added to the reaction mixture and the mixture was run at 4°C, 90V on a 10% Native-PAGE. The gel was allowed to run nearly 3/4th of the gel size. Bands were excised from the gel and added on scintillation vials. The gel was cut into two halves, the bottom half containing the dye front was considered as the unbound fraction. The top half containing the protein was considered as the tritium-bound fraction. Total bound fraction was calculated as the ratio of bound to unbound tritium values obtained from the scintillation counter. Parallelly, the samples were run on 12% SDS-PAGE to monitor for equal loading of protein liposome mixture on to the gel.
Electrophoretic mobility shift assay
CpxR proteins were purified as previously described (Clarke and Sperandio, 2005; Reading et al., 2007). The ler promoter and kanamycin gene were amplified by PCR and radiolabeled using γ-ATP and T4 polynucleotide kinase (NEB). The labeled DNA was then incubated with increasing amounts of protein and run on a 6% polyacrylamide TB gel, dried and exposed to film overnight.
Beta-galactosidase assays
The beta-galactosidase assays were performed as previously described (Miller, 1972). Briefly, appropriate strains containing the LEE1-lacZ fusions expressing plasmids were grown overnight aerobically at 37°C in LB. 1:100 dilutions were grown in triplicate in clear DMEM (low glucose, 0.1M salt, 0.001M pyruvate) and appropriate antibiotics. Cells were diluted in Z buffer and lysed with chloroform and 0.1%SDS. After addition of o-nitrophenyl-β-D-galactopyranoside (ONPG), the reaction was timed and stopped using 1M Na2CO3. The OD420 was measured and used to calculate the Miller units as previously described (Miller, 1972). The Student’s unpaired t test was used to determine statistical significance. A P value of ≤ 0.05 was considered significant.
Murine infections
7 to 8 weeks old female C57BL/6J mice were purchased from The Jackson Laboratory and housed in a specific pathogen-free facility at UT Southwestern Medical Center. All experiments were performed under IACUC approved protocols. The mice in both groups were age matched before the experiment.
Microbiota depletion method
Female C57BL/6 mice were orally administered a combination of four antibiotics, ampicillin, neomycin, metronidazole, and vancomycin (Sigma-Aldrich), via oral gavage for 2 days to deplete gut microbiota (5 mg of each antibiotic per mouse per day). Fecal pellets were collected before and after antibiotic treatment to confirm depletion of the gut microbiota. Feces were resuspended in PBS at 1 g/ml and plated on brain heart infusion (BHI)-blood agar plates containing no antibiotics. Colony counts were performed after 48-h incubation at 37°C under both aerobic and anaerobic conditions. All microbiota-depleted mice infection was performed with 1 ×10⁷ CFU of C. rodentium.
Colony enumeration
The feces from infected mice were collected and placed in microcentrifuge tubes on ice. Feces were resuspended in PBS, normalized to feces weight, and plated on plates with the appropriate media and antibiotics. The colonies were counted, and the statistical comparison between groups were performed by unpaired Mann-Whitney U test.
Tissue and content collection for mass spectrometry, RNA isolation, and qRT-PCR
At the indicated time points, mice were euthanized, and the colon tissue and content were collected. The tissue was washed in PBS twice to remove any residual fecal content. The content and tissues were snap-frozen in liquid nitrogen. Mass spectrometry analysis was performed to estimate the amount of serotonin from those fractions. The tissues, contents and feces from infected mice were collected in tubes. The tubes were snap-frozen in liquid nitrogen and stored in −80°C until use. RNA was isolated from individual mouse fecal pellets using RNeasy Power Microbiome kit (Qiagen) per the manufacturer’s instructions. qRT-PCR was performed as described earlier using Quantstudio 6 flex (Applied Biosystems). The relative abundance of mammalian mRNA transcripts was calculated using the delta delta CT method and normalized to Gapdh levels. Table S2 lists qRT-PCR primers to amplify bacterial transcripts. The relative abundance of bacterial mRNA transcripts was calculated using the delta delta CT method and normalized to rpoA levels. Significance was determined either by unpaired t test or Mann-Whitney U test as stated in figure legends.
SERT knockout experiments
7–8 weeks old C57BL/6 SERT knockout mice and its WT control littermates were purchased from The Jackson Laboratory and housed in a specific pathogen-free facility at UT Southwestern Medical Center. Mice from each group were then inoculated with 1 ×10⁸ CFU of C. rodentium by oral gavage. Control mice group were given an equivalent dose of PBS by oral gavage. The mice were monitored for survival. The experiments were performed at least twice. Feces were collected to monitor bacterial colonization. The mice were sacrificed on day 6 post-infection. Colon and cecum tissues and contents were collected for analyzing bacterial load, bacterial and host gene expression.
PCPA experiments
7–8 weeks old C57BL/6J mice were purchased from The Jackson Laboratory. Two days prior to infection one group of mice was administered Tph1 inhibitor PCPA at 300mg/kg per mice per day intraperitoneally throughout the experiment. The other group was given an equivalent amount of PBS intraperitoneally. The mice in both groups were age matched before the experiment. Mice from each group were inoculated with 1 ×10⁷ CFU of C. rodentium by oral gavage. As a control, mice per group were given an equivalent dose of PBS by oral gavage. Feces were collected for RNA extraction and qRT-PCR. PCPA treatment exacerbates C. rodentium infectivity, making mice extremely sick with very little fecal content obtained from each mouse. In such cases, fecal samples from three or four mice in the same cage were combined and RNA was extracted from the combined material. The feces from infected mice were collected and placed in Trizol. RNA was extracted from these pellets using Ribopure bacteria RNA extraction kit from Invitrogen. 1μg of RNA was converted to cDNA which was then further used for doing qRT-PCR. Quantstudio6 flex from applied biosystem was used to run the experiment and data were analyzed using comparative critical threshold method. All primers used in the screen were validated amplification efficiency and template specificity. Significance was determined by using student’s t test for fold change in each target. The mice were also monitored for survival. The experiments were performed at least twice. Number of mice are indicated in figure legends and statistical significance was determined as stated in figure legends.
Fluoxetine experiments
7–8 weeks old C57BL/6J mice were purchased from The Jackson Laboratory. Two days prior to infection one group of mice was administered Fluoxetine (Prozac) at 20mg/kg per mice per day by oral gavage throughout the experiment. The other group was given an equivalent amount of water orally. The mice in both groups were age matched before the experiment. Mice from each group were inoculated with 1 ×10⁸ CFU of C. rodentium by oral gavage. Feces were collected on indicated days for bacterial colonization, RNA extraction and qRT-PCR. The experiments were performed at least twice. Number of mice are indicated in figure legends and statistical significance was determined as stated in figure legends. The mice were sacrificed on day 6 post-infection. Colon and cecum tissues and contents were collected for analyzing bacterial load, bacterial virulence gene expression.
Mass spectrometry analysis of serotonin
Tissue and content/feces weights were homogenized in a threefold volume of methanol (3 × weight of tissue in grams = volume methanol in milliliters; total homogenate volume [in milliliters] = 4 × weight of tissue). Homogenates were made using a BeadBug microtube homogenizer run for 2 min at 2,800 rpm and BeadBug-prefilled tubes with 3.0-mm zirconium beads (catalog no. Z763802; Sigma). Standards were made by spiking 100μl of control background matrix (BM) homogenate with various known concentrations of serotonin and processed like samples. Serotonin standards used background homogenate diluted 1:5000 in methanol and were spiked with varying known concentrations of serotonin. The tissue homogenate samples were incubated at room temperature for 10 min. Samples were spun at 13,000 for 5 min. The supernatant (100μl) was combined 50:50 with ddH2O containing 0.2% formic acid and 100 ng/ml 13Trp IS and spun again, the supernatant was transferred to an HPLC vial w/insert and analyzed by HPLC/MS. The Qtrap 6500 and analytical conditions follow: buffer A was ddH2O plus 0.1% formic acid; buffer B was MeOH plus 0.1% formic acid; column, Agilent C18 XDB column with 5-μm packing and 50- by 4.6-mm size. The gradient conditions were as follows: 0 to 1.0 min, 0% buffer B; 1 to 1.5 min, gradient to 100% buffer B; 1.5 to 3.5 min, 100% buffer B; 3.5 to 4.0 min, gradient to 0% buffer B; 4 to 5 min, 0% buffer B. The ion source/gas parameters follow: CUR = 30, CAD = 9, IS = 5500, TEM = 200, GS1 = 20, GS2 = 10. Serotonin transition: 176.998 to 160, 13 Trp IS transition: 216.043 to 155.2.
Mass spectrometry analysis of serotonin from SERT−/− mice
Cecal content samples were collected and frozen immediately at −80°C and then processed as described earlier(Wojnicz et al., 2016). Briefly, the samples were homogenized for protein precipitation in an ice-cold solution containing 75% acetonitrile, 1% formic acid and 0.2 μM of the internal standard (IS) in a 4:1 proportion (solvent: cecum content). The samples were then centrifugated at high speed (~17000g) for 40 min at 4°C. 200 μL of the supernatant were collected, evaporated to dryness at 45°C, resuspended in 100 μL of mobile phase (95:5, 0.2%formic acid:acetonitrile) and injected directly into the Liquid Chromatography with tandem mass spectrometry (LC-MS-MS) apparatus.
Histopathological staining and analysis
Portions of the distal colon were harvested 4 days post infection (high pathology time-point) with C. rodentium. The tissues were washed in PBS and then fixed in Bouin’s fixative for 48 hr. The tissues were embedded in paraffin, cut into 5-μm sections, and stained with hematoxylin and eosin (H&E) in the UT Southwestern Pathology Core. The histologic score was obtained based on the intensity of mononuclear and polymorphonuclear infiltrates in the lamina propria, changes in the architecture of the mucosa, villus height, goblet cell depletion, hyperaemia, edema, haemorrhage and attached bacteria. For each parameter, the changes were graded according to the following scale: 0, absent; 1, mild; 2, moderate; and 3, intense. The histologic analysis was performed by a single examiner masked to the experimental group’s status.
QUANTIFICATION AND STATISTICAL ANALYSIS
For all in vitro experiments (qRT-PCR and FAS) and mass spectrometry data, a Student’s unpaired t test was used when comparing two groups and a one-way ANOVA was used when comparing more than two groups. Multiple-comparison correction using Bonferroni-Dunn method was used wherever required. For experiments with mice, the nonparametric Mann-Whitney U test was used to determine the statistical significance. For number of mice ≤ 5, data were tested for normality and if passed, statistics were determined by unpaired t test comparing two groups, and one-way ANOVA comparing more than two groups. Statistics for survival analysis was calculated using log rank (Mantel-Cox) test. A P value of <0.05 was considered significant. Detailed information on the numbers of biological samples and animals used can be found in the figure legends. Detailed information on the n of biological samples and animals used can be found in figure legends and STAR Methods.
Supplementary Material
KEY RESOURCES TABLE
| REAGENT or RESOURCE | SOURCE | IDENTIFIER |
|---|---|---|
| Antibodies | ||
| anti-EspA-polyclonal rabbit | UT Southwestern, Vanessa Sperandio | N/A |
| anti-EspB-polyclonal rabbit | UT Southwestern, Vanessa Sperandio | N/A |
| goat-anti-rabbit-HRP | BioRad | Cat# 1706515 |
| Bacterial and Virus Strains | ||
| EHEC str 86-24 | U of Maryland, James Kaper | N/A |
| E. coli DH5α | UT Southwestern, Vanessa Sperandio | N/A |
| E. coli TOP10 | Invitrogen | Cat# C404052 |
| E. coli BL21 | Invitrogen | Cat# C600003 |
| Citrobacter rodentium DBS770 | Tufts University, John Leong | N/A |
| Chemicals, Peptides, and Recombinant Proteins | ||
| 12 well Falcon plates | Fisher Scientific | Cat# 353043 |
| 12% Mini-PROTEAN TGX Stain Free protein gels | Biorad | Cat# 4568044 |
| 125 mL Polycarbonate Erlenmeyer Flask with Vent Cap | Corning | Cat# 431143 |
| 18mm coverslips | Fisher Scientific | Cat# 125461 |
| 1ml Disposable syringe | Becton Dickinson | Cat# 309602 |
| 5ml Disposable columns | Qiagen | Cat# 1018597 |
| 30% Acrylamide/Bis solution | Biorad | Cat# 161-0156 |
| 4–20% Mini-PROTEAN TGX Stain Free protein gels | Biorad | Cat# 4568094 |
| 3-indole acetonitrile | Sigma-Aldrich | Cat# 129453 |
| 3-indole acetic acid | Sigma-Aldrich | Cat# I2886 |
| 5-Hydroxyindole | Sigma-Aldrich | Cat# H31859 |
| Adenosine triphosphate | PerkinElmer | Cat# BLU002A250UC |
| Amicon ultra-15 centrifugal filter unit | Millipore | Cat# UFC901024 |
| Ammonium persulfate | Sigma-Aldrich | Cat# A3678-256 |
| Ampicillin powder | Sigma-Aldrich | Cat# A9518 |
| Antifade reagent | Life technologies | Cat# P36934 |
| Bio-Beads SM-2 Adsorbent media | Biorad | Cat# 152-8920 |
| Bio-Safe- Coomassie Stain | Biorad | Cat# 1610787 |
| Bovine Serum Albumin | Sigma-Aldrich | Cat# A2153 |
| Brain heart infusion agar | Becton Dickinson | Cat# 241810 |
| Calcium chloride | Sigma-Aldrich | Cat# C1016 |
| Chloramphenicol | Omnipur | Cat# 3130 |
| Chloroform | IBM Scientific | Cat# 67-66-3 |
| D-(+)- Glucose | Sigma-Aldrich | Cat# G8270 |
| Dithiothreitol (DTT) | Fisher Scientific | Cat# BP172-25 |
| DL-Histidine monohydrochloride monohydrate | Sigma-Aldrich | Cat# H7875 |
| dNTP mix 10mM | Invitrogen | Cat# 18-427-088 |
| Dulbecco eagle medium (DMEM) high glucose | Invitrogen | Cat# 11965-092 |
| Dulbecco eagle medium (DMEM) low glucose | Invitrogen | Cat# 11885-084 |
| E. coli polar lipid extract | Avanti polar lipids, Inc. | Cat# 100600 |
| Ethanol anhydrous | IBM Scientific | Cat# 64-17.5 |
| Ficoll solution | Sigma-Aldrich | Cat# F5415-25 |
| FITC-Phalloidin | Sigma-Aldrich | Cat# P5282 |
| Flouxetine hydrochloride | United States Pharmacopeia | Cat# 1279804 |
| Formaldehyde | Fisher Scientific | Cat# BP539 |
| Gibson assembly master mix | New England Biolabs | Cat# M5510A |
| Heat inactivated Fetal Bovine serum (FBS) | Thermo Fisher | Cat# 10082-147 |
| Horse blood serum | Colorado serum company | Cat# 31324 |
| Hydrochloric acid solution | Sigma-Aldrich | Cat# 318949-500 |
| Imidazole | Sigma-Aldrich | Cat# I2399 |
| Immun-Blot Low Fluorescence PVDF sets | Biorad | Cat# 1620260 |
| Indole | Sigma-Aldrich | Cat# I3408 |
| Isopropyl β-D-1-thiogalactopyranoside (IPTG) | Sigma-Aldrich | Cat# I6758 |
| Kanamycin sulfate powder | Sigma-Aldrich | Cat# K1876 |
| L-(+)-Arabinose | Sigma-Aldrich | Cat# A3256 |
| L-Cysteine HCl | Sigma-Aldrich | Cat# C1276 |
| L-Tryptophan | Sigma-Aldrich | Cat# T0254 |
| LB Agar, Miller | Fisher Scientific | Cat# BP1425 |
| LB broth, Miller | Fisher Scientific | Cat# BP9723 |
| Lysing matrix C, glass beads | MP biomedicals | Cat# 6912100 |
| Magensium chloride hexahydrate | Fisher Scientific | Cat# M35-500 |
| Magnesium acetate | Fisher Scientific | Cat# BP215-500 |
| Magnesium sulfate heptahydrate | Sigma-Aldrich | Cat# 230391 |
| Metronidazole | MP biomedicals | Cat# 0215571025 |
| n-Dodecyl β-D-maltoside | Sigma-Aldrich | Cat# D4641 |
| Neomycin trisulfate salt hydrate | Sigma-Aldrich | Cat# N5285 |
| Ni-NTA Agarose | Qiagen | Cat# 1018244 |
| N,N-Dimethyldodecylamine N-oxide | Sigma-Aldrich | Cat# 40234 |
| Octyl β-D-glucopyranoside | Sigma-Aldrich | Cat# O8001 |
| PCPA (4-Chloro-DL-phenylalanine) | Sigma-Aldrich | Cat# C6506 |
| Penicillin-Streptomycin solution | Thermo Fisher | Cat# 15140-122 |
| Phosphate Buffered Saline | Fisher Scientific | Cat# BP399-4 |
| Phusion High fidelity PCR master mix | Thermo Fisher | Cat# F-531L |
| Poly(2-deoxyinosinic2-deoxycytidylic acid) | Sigma-Aldrich | Cat# 81345-500 |
| Potassium phosphate dibasic | Fisher Scientific | Cat# BP363 |
| Potassium phosphate monobasic | Fisher Scientific | Cat# P286 |
| Precision Plus Protein Dual Color Standards | Biorad | Cat# 161-0374 |
| Propidium Iodine | Sigma-Aldrich | Cat# P4864 |
| Protease inhibitor cocktail | Sigma-Aldrich | Cat# P8849-5 |
| Proteinase K from Tritirachium album | Sigma-Aldrich | Cat# P2308 |
| Randon primers | Invitrogen | Cat# 48190-011 |
| Reusable animal feeding needle | Cadence science | Cat# 7920 |
| Reverse transcriptase | Thermo Fisher | Cat# 4308228 |
| Ritanserin | Sigma | Cat# R103 |
| RnaseA inhibitor | Thermo Fisher | Cat# 100021540 |
| RNaseA powder | Fisher Scientific | Cat# BP23391 |
| Serotonin | Sigma | Cat# 14927 |
| Serotonin hydrochloride | Tocris | Cat# 3547 |
| Sodium chloride | Sigma-Aldrich | Cat# S9888-1 |
| Sodium hydroxide solution 10N | Millipore | Cat# SX0607N-6 |
| Steriflip-GP sterile centrifuge tube top filter unit | Millipore | Cat# SCGP00525 |
| Streptomycin powder | Sigma-Aldrich | Cat# S6501 |
| Super script II reverse transcriptase | Invitrogen | Cat# 18064-014 |
| SuperSignal West Dura Extended Duration Substrate | Thermo Fisher | Cat# 34075 |
| Sybr green master mix | Thermo Fisher | Cat# 4309155 |
| T4 DNA Ligase | New england Biolabs | Cat# MO202L |
| T4 polynucleotide kinase | New england Biolabs | Cat# M0201S |
| TEMED | Biorad | Cat# 161-0801 |
| Terminal Deoxynucleotidyl transferase | Promega | Cat# M1875 |
| TrackIt 1 Kb Plus DNA Ladder | Thermo Fisher | Cat# 10488085 |
| Trans-Blot Turbo Mini PVDF Transfer Packs | Biorad | Cat# 1704156 |
| Tris base | Fisher Scientific | Cat# BP152-10 |
| Tritiated serotonin | Perkin Elmer | Cat# NET498001MC |
| Tritiated tryptophan | Perkin Elmer | Cat# NEC367010UC |
| Triton X-100 | Fisher Scientific | Cat# BP151 |
| Trizol reagent | Thermo Fisher | Cat# 1559618 |
| Tryptamine | Sigma-Aldrich | Cat# 193747 |
| Tryptone | Fisher Scientific | Cat# BP1421-2 |
| Tryptophan | Sigma-Aldrich | Cat# T0254 |
| Tween 20 | Fisher Scientific | Cat# BP337-500 |
| Vancomycin hydrochloride | Research Products International | Cat# V06500 |
| Yeast Extract | Fisher Scientific | Cat# BP1422-2 |
| Zicronium beadsBeadBug prefilled tubes | Sigma-Aldrich | Cat# Z763802 |
| Critical Commercial Assays | ||
| Rnasy power microbiome | Qiagen | Cat# 26000-50 |
| Ribopure-bacteria | Ambion | Cat# 1405072 |
| Genelute Plasmid Miniprep | Sigma | Cat# PLN350-1KT |
| QIAquick PCR purification kit | Qiagen | Cat# 28906 |
| QIAquick gel ectraction kit | Qiagen | Cat# 28704 |
| Illumina ScriptSeq Complete Kit | Illumina | BB1224 |
| Deposited Data | ||
| RNA sequencing data | GEO GSE144795 | GEO GSE144795 |
| Experimental Models: Cell Lines | ||
| HeLa cell line | ATCC | Cat# ATCC® CCL-2.1 |
| Experimental Models: Organisms/Strains | ||
| Mouse C57BL/6J mice | The Jackson laboratory | Cat# 000664 |
| B6.129(Cg)-Slc6a4 tm1Kpl/J | The Jackson laboratory | Cat# 008355|5-HTT- |
| Oligonucleotides | ||
| Primers used in this study, see Table S2 | This paper | N/A |
| Software and Algorithms | ||
| GraphPad Prism 7 for Mac | https://www.graphpad.com/ | N/A |
| Clustal Omega | https://www.ebi.ac.uk/Tools/msa/clustalo/ | N/A |
| DNASTAR Lasergene software version 15.0.0 | DNASTAR, Inc. | N/A |
| Fiji | https://fiji.sc | doi:10.1038/nmeth.2019 |
| Image Lab software version 5.2.1 | Biorad | N/A |
Highlights.
Enterohemorrhagic E. coli (EHEC) and C. rodentium sense serotonin in the gut
Bacterial CpxA acts as a serotonin sensor
Serotonin decreases virulence of EHEC in vitro and C. rodentium during murine infection
Genetic and pharmacological changes in gut serotonin modulate C. rodentium disease
ACKNOWLEDGEMENTS
We thank Sebastian Winter at UT Southwestern for comments. We thank Noelle Williams, Hamid Baniasadi, and Jessica Kilgore from the UT Southwestern Pharmacology Core facility for their help with the serotonin measurements. This work was supported by the National Institute of Health (NIH) Grants AI053067 and AI114511. R.P. was supported through NIH Training Grant 5 T32 AI7520-14.
Footnotes
Publisher's Disclaimer: This is a PDF file of an unedited manuscript that has been accepted for publication. As a service to our customers we are providing this early version of the manuscript. The manuscript will undergo copyediting, typesetting, and review of the resulting proof before it is published in its final form. Please note that during the production process errors may be discovered which could affect the content, and all legal disclaimers that apply to the journal pertain.
DECLARATION OF INTERESTS
The authors declare no competing interests.
REFERENCES
- Bansal T, Alaniz RC, Wood TK, and Jayaraman A (2010). The bacterial signal indole increases epithelial-cell tight-junction resistance and attenuates indicators of inflammation. Proc Natl Acad Sci U S A 107, 228–233. [DOI] [PMC free article] [PubMed] [Google Scholar]
- Baumler AJ, and Sperandio V (2016). Interactions between the microbiota and pathogenic bacteria in the gut. Nature 535, 85–93. [DOI] [PMC free article] [PubMed] [Google Scholar]
- Borenshtein D, McBee ME, and Schauer DB (2008). Utility of the Citrobacter rodentium infection model in laboratory mice. Current opinion in gastroenterology 24, 32–37. [DOI] [PubMed] [Google Scholar]
- Camilleri M (2009). Serotonin in the gastrointestinal tract. Curr Opin Endocrinol Diabetes Obes 16, 53–59. [DOI] [PMC free article] [PubMed] [Google Scholar]
- Carlson-Banning KM, and Sperandio V (2016). Catabolite and Oxygen Regulation of Enterohemorrhagic Escherichia coli Virulence. MBio 7. [DOI] [PMC free article] [PubMed] [Google Scholar]
- Clarke MB, Hughes DT, Zhu C, Boedeker EC, and Sperandio V (2006a). The QseC sensor kinase: a bacterial adrenergic receptor. Proceedings of the National Academy of Sciences of the United States of America 103, 10420–10425. [DOI] [PMC free article] [PubMed] [Google Scholar]
- Clarke MB, Hughes DT, Zhu C, Boedeker EC, and Sperandio V (2006b). The QseC sensor kinase: a bacterial adrenergic receptor. Proc Natl Acad Sci U S A 103, 10420–10425. [DOI] [PMC free article] [PubMed] [Google Scholar]
- Clarke MB, and Sperandio V (2005). Transcriptional regulation of flhDC by QseBC and sigma (FliA) in enterohaemorrhagic Escherichia coli. Mol Microbiol 57, 1734–1749. [DOI] [PubMed] [Google Scholar]
- Curtis MM, Hu Z, Klimko C, Narayanan S, Deberardinis R, and Sperandio V (2014). The gut commensal Bacteroides thetaiotaomicron exacerbates enteric infection through modification of the metabolic landscape. Cell Host Microbe 16, 759–769. [DOI] [PMC free article] [PubMed] [Google Scholar]
- Datsenko KA, and Wanner BL (2000). One-step inactivation of chromosomal genes in Escherichia coli K-12 using PCR products. Proceedings of the National Academy of Sciences of the United States of America 97, 6640–6645. [DOI] [PMC free article] [PubMed] [Google Scholar]
- De la Cruz MA, Morgan JK, Ares MA, Yanez-Santos JA, Riordan JT, and Giron JA (2016). The Two-Component System CpxRA Negatively Regulates the Locus of Enterocyte Effacement of Enterohemorrhagic Escherichia coli Involving sigma(32) and Lon protease. Frontiers in cellular and infection microbiology 6, 11. [DOI] [PMC free article] [PubMed] [Google Scholar] [Retracted]
- Dean-Nystrom EA, Bosworth BT, Moon HW, and O’Brien AD (1998). Escherichia coli O157:H7 requires intimin for enteropathogenicity in calves. Infect Immun 66, 4560–4563. [DOI] [PMC free article] [PubMed] [Google Scholar]
- Deng W, Puente JL, Gruenheid S, Li Y, Vallance BA, Vazquez A, Barba J, Ibarra JA, O’Donnell P, Metalnikov P, et al. (2004). Dissecting virulence: systematic and functional analyses of a pathogenicity island. Proceedings of the National Academy of Sciences of the United States of America 101, 3597–3602. [DOI] [PMC free article] [PubMed] [Google Scholar]
- Donnenberg MS, Tacket CO, James SP, Losonsky G, Nataro JP, Wasserman SS, Kaper JB, and Levine MM (1993). Role of the eaeA gene in experimental enteropathogenic Escherichia coli infection. J Clin Invest 92, 1412–1417. [DOI] [PMC free article] [PubMed] [Google Scholar]
- Esmaili A, Nazir SF, Borthakur A, Yu D, Turner JR, Saksena S, Singla A, Hecht GA, Alrefai WA, and Gill RK (2009). Enteropathogenic Escherichia coli infection inhibits intestinal serotonin transporter function and expression. Gastroenterology 137, 2074–2083. [DOI] [PMC free article] [PubMed] [Google Scholar]
- Fung TC, Vuong HE, Luna CDG, Pronovost GN, Aleksandrova AA, Riley NG, Vavilina A, McGinn J, Rendon T, Forrest LR, et al. (2019). Intestinal serotonin and fluoxetine exposure modulate bacterial colonization in the gut. Nature microbiology 4, 2064–2073. [DOI] [PMC free article] [PubMed] [Google Scholar]
- Giannakopoulou N, Mendis N, Zhu L, Gruenheid S, Faucher SP, and Le Moual H (2018). The Virulence Effect of CpxRA in Citrobacter rodentium Is Independent of the Auxiliary Proteins NlpE and CpxP. Frontiers in cellular and infection microbiology 8, 320. [DOI] [PMC free article] [PubMed] [Google Scholar]
- Griffin PM, Ostroff SM, Tauxe RV, Greene KD, Wells JG, Lewis JH, and Blake PA (1988). Illnesses associated with Escherichia coli O157:H7. Ann Intern Med 109, 705–712. [DOI] [PubMed] [Google Scholar]
- Grondahl ML, Jensen GM, Nielsen CG, Skadhauge E, Olsen JE, and Hansen MB (1998). Secretory pathways in Salmonella Typhimurium-induced fluid accumulation in the porcine small intestine. J Med Microbiol 47, 151–157. [DOI] [PubMed] [Google Scholar]
- Gruber CC, and Sperandio V (2014). Posttranscriptional control of microbe-induced rearrangement of host cell actin. MBio 5, e01025–01013. [DOI] [PMC free article] [PubMed] [Google Scholar]
- Gruber CC, and Sperandio V (2015). Global analysis of posttranscriptional regulation by GlmY and GlmZ in enterohemorrhagic Escherichia coli O157:H7. Infection and immunity 83, 1286–1295. [DOI] [PMC free article] [PubMed] [Google Scholar]
- Hansen AM, and Kaper JB (2009). Hfq affects the expression of the LEE pathogenicity island in enterohaemorrhagic Escherichia coli. Mol Microbiol 73, 446–465. [DOI] [PMC free article] [PubMed] [Google Scholar]
- Horger S, Schultheiss G, and Diener M (1998). Segment-specific effects of epinephrine on ion transport in the colon of the rat. Am J Physiol 275, G1367–1376. [DOI] [PubMed] [Google Scholar]
- Hsiao EY, McBride SW, Hsien S, Sharon G, Hyde ER, McCue T, Codelli JA, Chow J, Reisman SE, Petrosino JF, et al. (2013). Microbiota modulate behavioral and physiological abnormalities associated with neurodevelopmental disorders. Cell 155, 1451–1463. [DOI] [PMC free article] [PubMed] [Google Scholar]
- Jaglin M, Rhimi M, Philippe C, Pons N, Bruneau A, Goustard B, Dauge V, Maguin E, Naudon L, and Rabot S (2018). Indole, a Signaling Molecule Produced by the Gut Microbiota, Negatively Impacts Emotional Behaviors in Rats. Frontiers in neuroscience 12, 216. [DOI] [PMC free article] [PubMed] [Google Scholar]
- Janausch IG, Garcia-Moreno I, and Unden G (2002). Function of DcuS from Escherichia coli as a fumarate-stimulated histidine protein kinase in vitro. J Biol Chem 277, 39809–39814. [DOI] [PubMed] [Google Scholar]
- Jarvis KG, Giron JA, Jerse AE, McDaniel TK, Donnenberg MS, and Kaper JB (1995). Enteropathogenic Escherichia coli contains a putative type III secretion system necessary for the export of proteins involved in attaching and effacing lesion formation. Proc Natl Acad Sci U S A 92, 7996–8000. [DOI] [PMC free article] [PubMed] [Google Scholar]
- Jung K, Fried L, Behr S, and Heermann R (2012). Histidine kinases and response regulators in networks. Curr Opin Microbiol 15, 118–124. [DOI] [PubMed] [Google Scholar]
- Kaper JB, Nataro JP, and Mobley HL (2004). Pathogenic Escherichia coli. Nature reviews Microbiology 2, 123–140. [DOI] [PubMed] [Google Scholar]
- Karine de Sousa A, Rocha JE, Goncalves de Souza T, Sampaio de Freitas T, Ribeiro-Filho J, and Melo Coutinho HD (2018). New roles of fluoxetine in pharmacology: Antibacterial effect and modulation of antibiotic activity. Microb Pathog 123, 368–371. [DOI] [PubMed] [Google Scholar]
- Kendall MM, Gruber CC, Rasko DA, Hughes DT, and Sperandio V (2011). Hfq virulence regulation in enterohemorrhagic Escherichia coli O157:H7 strain 86–24. Journal of bacteriology 193, 6843–6851. [DOI] [PMC free article] [PubMed] [Google Scholar]
- Kendall MM, and Sperandio V (2016). What a Dinner Party! Mechanisms and Functions of Interkingdom Signaling in Host-Pathogen Associations. MBio 7, e01748. [DOI] [PMC free article] [PubMed] [Google Scholar]
- Kim CS, Gatsios A, Cuesta S, Lam YC, Wei Z, Chen H, Russell RM, Shine EE, Wang R, Wyche TP, et al. (2020). Characterization od the autoinducer-3 structure and biosynthesis in E. coli. ACSCS In Press. [DOI] [PMC free article] [PubMed] [Google Scholar]
- Knecht LD, O’Connor G, Mittal R, Liu XZ, Daftarian P, Deo SK, and Daunert S (2016). Serotonin Activates Bacterial Quorum Sensing and Enhances the Virulence of Pseudomonas aeruginosa in the Host. EBioMedicine 9, 161–169. [DOI] [PMC free article] [PubMed] [Google Scholar]
- Knutton S, Baldwin T, Williams PH, and McNeish AS (1989). Actin accumulation at sites of bacterial adhesion to tissue culture cells: basis of a new diagnostic test for enteropathogenic and enterohemorrhagic Escherichia coli. Infect Immun 57, 1290–1298. [DOI] [PMC free article] [PubMed] [Google Scholar]
- Kordasti S, Sjovall H, Lundgren O, and Svensson L (2004). Serotonin and vasoactive intestinal peptide antagonists attenuate rotavirus diarrhoea. Gut 53, 952–957. [DOI] [PMC free article] [PubMed] [Google Scholar]
- Kumar A, and Sperandio V (2019). Indole Signaling at the Host-Microbiota-Pathogen Interface. mBio 10. [DOI] [PMC free article] [PubMed] [Google Scholar]
- Kuss SK, Best GT, Etheredge CA, Pruijssers AJ, Frierson JM, Hooper LV, Dermody TS, and Pfeiffer JK (2011). Intestinal microbiota promote enteric virus replication and systemic pathogenesis. Science 334, 249–252. [DOI] [PMC free article] [PubMed] [Google Scholar]
- Lodato PB, Hsieh PK, Belasco JG, and Kaper JB (2012). The ribosome binding site of a mini-ORF protects a T3SS mRNA from degradation by RNase E. Mol Microbiol 86, 1167–1182. [DOI] [PMC free article] [PubMed] [Google Scholar]
- Lodato PB, and Kaper JB (2009). Post-transcriptional processing of the LEE4 operon in enterohaemorrhagic Escherichia coli. Molecular microbiology 71, 273–290. [DOI] [PMC free article] [PubMed] [Google Scholar]
- Luperchio SA, and Schauer DB (2001). Molecular pathogenesis of Citrobacter rodentium and transmissible murine colonic hyperplasia. Microbes Infect 3, 333–340. [DOI] [PubMed] [Google Scholar]
- Maier L, Pruteanu M, Kuhn M, Zeller G, Telzerow A, Anderson EE, Brochado AR, Fernandez KC, Dose H, Mori H, et al. (2018). Extensive impact of non-antibiotic drugs on human gut bacteria. Nature 555, 623–628. [DOI] [PMC free article] [PubMed] [Google Scholar]
- Mallick EM, McBee ME, Vanguri VK, Melton-Celsa AR, Schlieper K, Karalius BJ, O’Brien AD, Butterton JR, Leong JM, and Schauer DB (2012). A novel murine infection model for Shiga toxin-producing Escherichia coli. J Clin Invest 122, 4012–4024. [DOI] [PMC free article] [PubMed] [Google Scholar]
- Mayer EA, Knight R, Mazmanian SK, Cryan JF, and Tillisch K (2014). Gut microbes and the brain: paradigm shift in neuroscience. J Neurosci 34, 15490–15496. [DOI] [PMC free article] [PubMed] [Google Scholar]
- McDaniel TK, Jarvis KG, Donnenberg MS, and Kaper JB (1995). A genetic locus of enterocyte effacement conserved among diverse enterobacterial pathogens. Proceedings of the National Academy of Sciences of the United States of America 92, 1664–1668. [DOI] [PMC free article] [PubMed] [Google Scholar]
- McKee ML, Melton-Celsa AR, Moxley RA, Francis DH, and O’Brien AD (1995). Enterohemorrhagic Escherichia coli O157:H7 requires intimin to colonize the gnotobiotic pig intestine and to adhere to HEp-2 cells. Infect Immun 63, 3739–3744. [DOI] [PMC free article] [PubMed] [Google Scholar]
- Mellies JL, Elliott SJ, Sperandio V, Donnenberg MS, and Kaper JB (1999). The Per regulon of enteropathogenic Escherichia coli : identification of a regulatory cascade and a novel transcriptional activator, the locus of enterocyte effacement (LEE)-encoded regulator (Ler). Molecular microbiology 33, 296–306. [DOI] [PubMed] [Google Scholar]
- Miller JH (1972). Experiments in molecular genetics (Cold Spring Harbor, NY: Cold Spring Harbor Laboratory Press; ). [Google Scholar]
- Mohawk KL, Melton-Celsa AR, Robinson CM, and O’Brien AD (2010a). Neutralizing antibodies to Shiga toxin type 2 (Stx2) reduce colonization of mice by Stx2-expressing Escherichia coli O157:H7. Vaccine 28, 4777–4785. [DOI] [PMC free article] [PubMed] [Google Scholar]
- Mohawk KL, Melton-Celsa AR, Zangari T, Carroll EE, and O’Brien AD (2010b). Pathogenesis of Escherichia coli O157:H7 strain 86–24 following oral infection of BALB/c mice with an intact commensal flora. Microbial Path 48, 131–142. [DOI] [PMC free article] [PubMed] [Google Scholar]
- Moreira CG, Weinshenker D, and Sperandio V (2009). QseC mediates Salmonella enterica serovar typhimurium virulence in vitro and in vivo. Infect Immun 78, 914–926. [DOI] [PMC free article] [PubMed] [Google Scholar]
- Njoroge JW, Nguyen Y, Curtis MM, Moreira CG, and Sperandio V (2012). Virulence meets metabolism: Cra and KdpE gene regulation in enterohemorrhagic Escherichia coli. MBio 3, e00280–00212. [DOI] [PMC free article] [PubMed] [Google Scholar]
- O’Hara JR, Skinn AC, MacNaughton WK, Sherman PM, and Sharkey KA (2006). Consequences of Citrobacter rodentium infection on enteroendocrine cells and the enteric nervous system in the mouse colon. Cell Microbiol 8, 646–660. [DOI] [PubMed] [Google Scholar]
- Pacheco AR, Curtis MM, Ritchie JM, Munera D, Waldor MK, Moreira CG, and Sperandio V (2012). Fucose sensing regulates bacterial intestinal colonization. Nature 492, 113–117. [DOI] [PMC free article] [PubMed] [Google Scholar]
- Pifer R, Russell RM, Kumar A, Curtis MM, and Sperandio V (2018). Redox, amino acid, and fatty acid metabolism intersect with bacterial virulence in the gut. Proc Natl Acad Sci U S A 115, E10712–E10719. [DOI] [PMC free article] [PubMed] [Google Scholar]
- Rasko DA, Moreira CG, Li DR, Reading NC, Ritchie JM, Waldor MK, Williams N, Taussig R, Wei S, Roth M, et al. (2008a). Targeting QseC signaling and virulence for antibiotic development. Science 321, 1078–1080. [DOI] [PMC free article] [PubMed] [Google Scholar]
- Rasko DA, Moreira CG, Li de R, Reading NC, Ritchie JM, Waldor MK, Williams N, Taussig R, Wei S, Roth M, et al. (2008b). Targeting QseC signaling and virulence for antibiotic development. Science 321, 1078–1080. [DOI] [PMC free article] [PubMed] [Google Scholar]
- Reading NC, Rasko DA, Torres AG, and Sperandio V (2009). The two-component system QseEF and the membrane protein QseG link adrenergic and stress sensing to bacterial pathogenesis. Proc Natl Acad Sci U S A 106, 5889–5894. [DOI] [PMC free article] [PubMed] [Google Scholar]
- Reading NC, Torres AG, Kendall MM, Hughes DT, Yamamoto K, and Sperandio V (2007). A novel two-component signaling system that activates transcription of an enterohemorrhagic Escherichia coli effector involved in remodeling of host actin. J Bacteriol 189, 2468–2476. [DOI] [PMC free article] [PubMed] [Google Scholar]
- Reigstad CS, Salmonson CE, Rainey JF 3rd, Szurszewski JH, Linden DR, Sonnenburg JL, Farrugia G, and Kashyap PC (2015). Gut microbes promote colonic serotonin production through an effect of short-chain fatty acids on enterochromaffin cells. FASEB J 29, 1395–1403. [DOI] [PMC free article] [PubMed] [Google Scholar]
- Riley LW, Remis RS, Helgerson SD, McGee HB, Wells JG, Davis BR, Hebert RJ, Olcott ES, Johnson LM, Hargrett NT, et al. (1983). Hemorrhagic colitis associated with a rare Escherichia coli serotype. The New England journal of medicine 308, 681–685. [DOI] [PubMed] [Google Scholar]
- Sambrook J, Fritsch EF and Maniatis T (1989). Molecular Cloning: A Laboratory Manual. 2nd ed (N.Y: Cold Spring Harbor Laboratory Press,). [Google Scholar]
- Sampson TR, and Mazmanian SK (2015). Control of brain development, function, and behavior by the microbiome. Cell Host Microbe 17, 565–576. [DOI] [PMC free article] [PubMed] [Google Scholar]
- Shakhnovich EA, Davis BM, and Waldor MK (2009). Hfq negatively regulates type III secretion in EHEC and several other pathogens. Mol Microbiol 74, 347–363. [DOI] [PMC free article] [PubMed] [Google Scholar]
- Singhal M, Turturice BA, Manzella CR, Ranjan R, Metwally AA, Theorell J, Huang Y, Alrefai WA, Dudeja PK, Finn PW, et al. (2019). Serotonin Transporter Deficiency is Associated with Dysbiosis and Changes in Metabolic Function of the Mouse Intestinal Microbiome. Scientific reports 9, 2138. [DOI] [PMC free article] [PubMed] [Google Scholar]
- Stevens MP, and Frankel GM (2014). The Locus of Enterocyte Effacement and Associated Virulence Factors of Enterohemorrhagic Escherichia coli. Microbiology spectrum 2, EHEC-0007–2013. [DOI] [PubMed] [Google Scholar]
- Thomassin JL, Giannakopoulou N, Zhu L, Gross J, Salmon K, Leclerc JM, Daigle F, Le Moual H, and Gruenheid S (2015). The CpxRA two-component system is essential for Citrobacter rodentium virulence. Infect Immun 83, 1919–1928. [DOI] [PMC free article] [PubMed] [Google Scholar]
- Vazquez-Juarez RC, Kuriakose JA, Rasko DA, Ritchie JM, Kendall MM, Slater TM, Sinha M, Luxon BA, Popov VL, Waldor MK, et al. (2008). CadA negatively regulates Escherichia coli O157:H7 adherence and intestinal colonization. Infect Immun 76, 5072–5081. [DOI] [PMC free article] [PubMed] [Google Scholar]
- Vogt SL, Scholz R, Peng Y, Guest RL, Scott NE, Woodward SE, Foster LJ, Raivio TL, and Finlay BB (2019). Characterization of the Citrobacter rodentium Cpx regulon and its role in host infection. Molecular microbiology 111, 700–716. [DOI] [PubMed] [Google Scholar]
- Wang D, Ding X, and Rather PN (2001). Indole can act as an extracellular signal in Escherichia coli. Journal of bacteriology 183, 4210–4216. [DOI] [PMC free article] [PubMed] [Google Scholar]
- Wojnicz A, Ortiz JA, Casas AI, Freitas AE, Lopez MG, and Ruiz-Nuno A (2016). Data supporting the rat brain sample preparation and validation assays for simultaneous determination of 8 neurotransmitters and their metabolites using liquid chromatography-tandem mass spectrometry. Data in brief 7, 714–720. [DOI] [PMC free article] [PubMed] [Google Scholar]
- Woods JB, Schmitt CK, Darnell SC, Meysick KC, and O’Brien AD (2002). Ferrets as a model system for renal disease secondary to intestinal infection with Escherichia coli O157:H7 and other Shiga toxin-producing E. coli. J Infect Dis 185, 550–554. [DOI] [PubMed] [Google Scholar]
- Yano JM, Yu K, Donaldson GP, Shastri GG, Ann P, Ma L, Nagler CR, Ismagilov RF, Mazmanian SK, and Hsiao EY (2015). Indigenous bacteria from the gut microbiota regulate host serotonin biosynthesis. Cell 161, 264–276. [DOI] [PMC free article] [PubMed] [Google Scholar]
Associated Data
This section collects any data citations, data availability statements, or supplementary materials included in this article.
Supplementary Materials
Data Availability Statement
The RNA-Seq data generated during this study are available at NCBI GEO database and can be accessed using accession number GSE144795.