

SUMMARY
Optogenetics is among the most widely employed techniques to manipulate neuronal activity. However, a major drawback is the need for invasive implantation of optical fibers. To develop a minimally invasive optogenetic method that overcomes this challenge, we engineered SOUL, a new step-function opsin with ultra-high light sensitivity. We show that SOUL can activate neurons located in deep mouse brain regions via transcranial optical stimulation and elicit behavioral changes in SOUL knock-in mice. Moreover, SOUL can be used to modulate neuronal spiking and induce oscillations reversibly in macaque cortex via optical stimulation from outside the dura. By enabling external light delivery, our new opsin offers a minimally invasive tool for manipulating neuronal activity in rodent and primate models with fewer limitations on the depth and size of target brain regions, and may further facilitate the development of minimally invasive optogenetic tools for the treatment of neurological disorders.
eTOC blurb:
Is it possible to turn on and off neurons inside the brain by shining light from outside the head? Now it is. SOUL, a newly-developed light-responsive molecule, is so sensitive to light that it can activate neurons inside the brain of mice and monkeys with external illumination.
INTRODUCTION
Methods to modulate neuronal activity in specific brain regions have led to fundamental insights into the causal role that these regions play in a wide variety of brain functions. Additionally, these methods have been used for the treatment of neurological diseases in which activation or inactivation of neuronal activity in a target brain region restores lost functions or ameliorates symptoms (Dzirasa and Lisanby, 2012). Most of these studies and clinical applications utilize direct electrical stimulation to the brain (Weaver et al., 2012). In the last decade, optogenetics has become increasingly popular as a viable alternative to these methods, providing cell-type and neural circuit specificity, millisecond temporal resolution, and high spatial precision, among other advantages (Bergs et al., 2018; Berndt et al., 2011; Boyden et al., 2005; Cavanaugh et al., 2012; Chow et al., 2010; Dawydow et al., 2014; Han et al., 2009; Hososhima et al., 2015; Kleinlogel et al., 2011; Lin et al., 2009; Nandy et al., 2019; Thyagarajan et al., 2010; Yizhar et al., 2011a). However, a significant disadvantage in the application of optogenetics, as with other perturbation methods, is the requirement to surgically implant devices that cause permanent damage to the brain, such as optical fibers. Mechanical strain associated with the implantation procedures causes the severing of capillaries and processes of neurons and glia, leading to significant neuronal loss and altered spine turnover, acute inflammatory responses, and chronic foreign body reactions (Polikov et al., 2005; Xu et al., 2007). These responses activate microglia and astrocytes within 500-600 μm from the implants (Szarowski et al., 2003), which subsequently affect neuronal activity, plasticity (Hauss-Wegrzyniak et al., 2002), and homeostasis (Luo and Chen, 2012). Lastly, device implantation into the brain increases susceptibility to infection, which poses a significant health risk.
Another challenge in the application of optogenetics is that, because light is severely attenuated as it passes through brain tissue, the volume of brain around an implanted optical fiber that receives enough light for neurons to be optogenetically modulated is relatively small (Aravanis et al., 2007; Diester et al., 2011). This is particularly problematic when applying optogenetics to brains several orders of magnitude larger than the mouse, such as the macaque monkey. While optogenetics similarly modulates the spiking activity of neurons in macaques and mice (Gerits and Vanduffel, 2013), one difference between these animal models is that because the macaque brain is magnitudes larger than the mouse brain, the number of neurons modulated by standard optogenetic methods represents a smaller fraction of a functional region in macaques than in mice (Diester et al., 2011).
To overcome the aforementioned challenges, we developed a new step-function opsin with ultra-high light sensitivity (SOUL) for minimally invasive optogenetics via external optical stimulation. The step-function opsin (SFO) family was chosen as the parental base due to several advantages over other opsins (Berndt et al., 2009). Firstly, the slow off kinetics of SFOs enables the ion channel to stay open for more than 30 minutes after light stimulation (Yizhar et al., 2011b). Thus, animals can be released from the light source while the neurons remain activated, a feature that is especially beneficial in large or freely-moving animals and for long-term, developmental, and clinical applications. Second, in contrast to traditional opsins that drive synchronized spiking in all opsin-expressing cells at a firing rate determined by the researcher, SFOs induce subthreshold depolarization that sensitizes the neurons to endogenous synaptic input and thus generates a modulated state of increased excitability (Berndt et al., 2009). Since neurons do not usually fire in millisecond-precise synchrony and the firing codes of neuronal ensembles under many specific contexts are largely unknown, using SFOs to effectively and reversibly increase neuronal excitability may be a more suitable way to define the physiological and causal importance of optogenetically-targeted neurons. Importantly, SFOs are highly sensitive to light due to their capability for photointegration (Mattis et al., 2011), and we have combined particular mutations that increase the operational light sensitivity to generate a new step-function opsin with ultra-high light sensitivity – SOUL. SOUL has extremely high light sensitivity that can undergo photoactivation under conditions of significantly attenuated light power.
We show that transcranial optical stimulation of SOUL causes reversible activation of neurons located in the lateral hypothalamus, one of the deepest regions of the mouse brain (as deep as 5.5 to 6.2 mm). These effects were strong enough to disrupt mouse feeding behaviors, which can be restored by the deactivation of SOUL with orange light. Furthermore, we demonstrate that in macaque monkeys, optical stimulation of SOUL from outside the dura modulates neuronal spiking and induces local field potential oscillations in the cortex. Thus, SOUL provides a minimally invasive approach to optogenetically manipulate neuronal activity in the living brain.
RESULTS
Development and validation of a Cre-inducible SOUL knock-in mouse line
One family of opsins known to possess high light sensitivity – due to their slow off kinetics – is the step-function opsins (SFOs). To create an SFO variant with enhanced operational light sensitivity, we combined the stabilized step-function opsin (SSFO) mutations C128S and D156A (Selimbeyoglu et al., 2017; Yizhar et al., 2011b), known to slow the photocycle kinetics, with the T159C mutation (Berndt et al., 2011; Ullrich et al., 2013), which dramatically increases photocurrents in channelrhodopsin-2 and thus imparts a higher operational light sensitivity (Mattis et al., 2011). We then compared the photocurrent properties of our new opsin to the parental opsin SSFO by expressing both opsins in primary cultures of mouse hippocampal neurons and performing whole-cell patch-clamp recordings. We found that SOUL-expressing neurons had a significantly higher operational light sensitivity compared to SSFO (Fig. 1a, b) and a peak photocurrent amplitude of 391.36 ± 38.88 pA, which was almost double that of SSFO-expressing neurons at 233.66 ± 26.14 pA (Fig. 1c). Also, the expression of SOUL channels does not affect the basic electrical properties of neurons (Supplementary Fig. 1a–d).
Figure 1. In-vitro characterization of SOUL.

(a) Representative traces of primary cultured hippocampal neurons expressing SSFO (top) and SOUL (bottom) photocurrent responses to 470 nm light pulses of indicated power (3μW/mm2, 8μW/mm2, 20μW/mm2, 60μW/mm2, 1mW/mm2).
(b) Summary data for the photocurrents in response to different levels of laser powers (Unpaired t-test with Holm-Sidak post-hoc analysis, *, P < 0.05; **, P < 0.01; P = 0.013, 0.019, 0.010, 0.002 and 0.004 from lowest to highest irradiance. SOUL, n = 17 neurons; SSFO, n = 15 neurons. Bar graph represents ± SEM).
(c) Maximal photocurrent amplitude recorded from neurons expressing SSFO or SOUL (Unpaired t-test; **, P < 0.01, P = 0.0027; SOUL, n = 17 neurons; SSFO, n = 15 neurons. Bar graph represents ± SEM).
Next, we created a Cre-inducible SOUL-P2A-tdTomato knock-in mouse line that enables targeted, cell type-specific expression of SOUL. The Cre-inducible SOUL expression is under the control of the CAG promoter and the target cassette was inserted into the endogenous Rosa26 locus (Supplementary Fig. 1e). Expression of Cre recombinase leads to the excision of the floxed-STOP cassette and subsequent expression of SOUL and tdTomato fluorescence (Supplementary Fig. 1f). To test the Cre-dependent expression of the SOUL knock-in line, we crossed our knock-in line with the parvalbumin (PV)-IRES-Cre and ChAT-Cre driver mouse lines. Both PV-Cre:SOUL mice and ChAT-Cre:SOUL mice displayed robust tdTomato fluorescence that was consistent with the expected recombination patterns for these Cre mouse lines (Hippenmeyer et al., 2005; Rossi et al., 2011; Zhao et al., 2011). PV-Cre:SOUL mice showed strong native fluorescence throughout the brain, including the cortex, globus pallidus, thalamic reticular nucleus, striatum, hippocampus and cerebellum (Supplementary Fig. 2a); while ChAT-Cre:SOUL mice exhibited tdTomato fluorescence in various brain areas including the basal forebrain, striatum, and brainstem nuclei (Supplementary Fig. 2b). To further examine the fidelity and completeness of expression in specific neuronal cell types, we compared the expression patterns of tdTomato with endogenous cell type markers using immunostaining with antibodies and found that tdTomato was selectively expressed in the targeted neuronal populations (Supplementary Fig. 2c, d; Supplementary Table 1). Furthermore, while the cytoplasmic tdTomato fluorescence facilitated visualization of SOUL expressing neurons (Supplementary Fig. 2e), the P2A-mediated self-cleavage physically uncoupled tdTomato from SOUL (Kim et al., 2011) (as identified by the 2A fragment remaining at the SOUL C-terminus), and thus prevented the possible interference of the fluorophore with the opsin’s function (Madisen et al., 2012).
To test our ability to optically activate and deactivate SOUL in this mouse line, we performed whole-cell recordings in acute brain slices of PV-IRES-Cre:SOUL mice. Parvalbumin-expressing neurons in the dorsolateral striatum were identified by tdTomato fluorescence. In SOUL-expressing PV neurons, the membrane was depolarized with a brief (2 seconds) blue light pulse and brought back to the resting potential with an equivalent pulse of orange light illumination (Fig. 2a, b). Exposure to blue light initiated a robust photocurrent, and this photocurrent was readily terminated by the orange light (Fig. 2c, d), demonstrating that SOUL is capable of causing a robust and reversible increase in neuronal activity in transgenic mice. In addition, step function opsins are distinguished by their prolonged open state; we therefore performed whole-cell recordings in SOUL-expressing D1 neurons in Drd1a-Cre:SOUL mouse brain slices and confirmed that SOUL retains a prolonged open state (deactivation time constant τ = 31.1 min) which is the hallmark of SFOs (Fig. 2e, f). Thus, SOUL was expressed in a Cre-dependent manner and functions robustly in SOUL knock-in mice, demonstrating that this line may be used to manipulate activity of various types of neurons.
Figure 2. Ex-vivo characterization of SOUL.

(a) Representative voltage trace over time for a SOUL-expressing PV+ neuron in acute brain slices upon blue-light activation (blue bar) and orange-light deactivation (orange bar). Scale bars: 8 mV and 15 s.
(b) Membrane potentials of individual neurons’ (dashed lines) mean (±SEM, solid line) during baseline (BS), upon blue light activation (ON) and orange light deactivation (OFF).
(c) Representative current trace over time for a SOUL-expressing PV neuron upon blue-light activation (blue bar) and orange-light deactivation (orange bar). Scale bars: 50 pA and 30 s.
(d) Photocurrents of individual neurons (dots) and mean (±SEM, solid line).
(e) Representative current trace over time for a SOUL-expressing D1 neuron upon SOUL activation (blue bar) and deactivation (orange bar).
(f) Peak current-normalized activity of SOUL over time with mono-exponential fit (solid line; τ = 31.1 min).
Noninvasive transcranial activation of SOUL in mice
As mentioned above, while activation of neurons in vivo using non-invasive transcranial optogenetic stimulation has many advantages, one major challenge is that it requires light to penetrate through various tissues such as skull bone, gray and white matter, and blood vessels, which significantly attenuates light power density due to light scattering and absorption. As a result, the light power reaching the target brain regions is only a small fraction of the source power, making it difficult for opsins to be activated. However, we reasoned that such low light power may be sufficient to activate SOUL, given its high photosensitivity.
To test the ability of SOUL to modulate neuronal firing rates by transcranial light delivery in vivo, we injected titer-matched adeno-associated viruses (AAVs) encoding SSFO or SOUL into the mediodorsal thalamus (MD) in opposite hemispheres of the same mice. We recorded neuronal spiking activity while delivering transcranial optical stimulations through an optical fiber positioned above the midline of the intact skull (Fig. 3a). Upon transcranial photostimulation, MD neurons in the SOUL-expressing hemisphere showed a significant increase in firing rate (Fig. 3b, Supplementary Fig. 3a) that scaled with light power (Fig. 3c), whereas MD neurons in the SSFO-expressing hemisphere were not significantly activated (Fig. 3b, c; Supplementary Fig. 3a). In contrast, optical stimulation delivered through implanted fibers within the MD thalamus was sufficient to significantly increase the firing rates of neurons in both SOUL and SSFO-expressing MD (Supplementary Fig. 3b–d). Together, these results demonstrate that under matched conditions, SOUL, but not SSFO, can be activated via transcranial optical stimulation in mice.
Figure 3. Non-invasive transcranial stimulation of SOUL and SSFO in vivo.
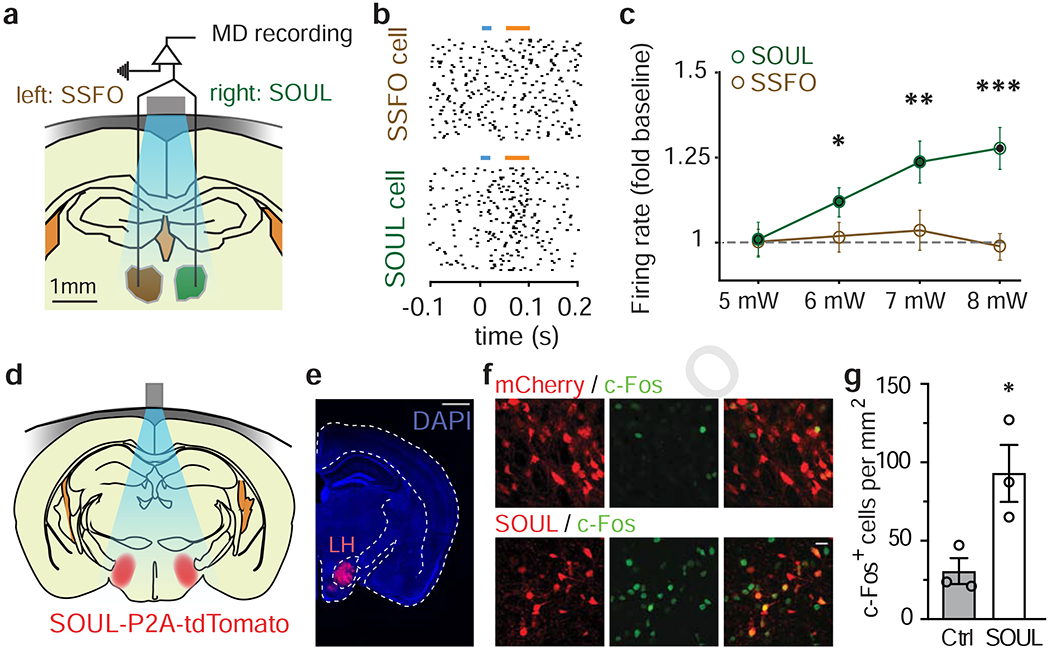
(a) Schematic of in vivo recording and transcranial stimulation of MD with SOUL (left) or SSFO (right) in awake mice. Scale bar, 1 mm. Gray bar, optical fiber; blue region, illumination.
(b) Raster plot of the representative recording of the neuron from SSFO- (top panel) or SOUL-expressing (bottom panel) MD during blue and orange light illumination (colored bars).
(c) Mean (± SEM) firing rate (normalized to baseline) across neurons in SOUL- (dark green circle) or SSFO-expressing (brown circle) MD transcranially stimulated with blue light of different intensities (*, P < 0.05; **, P < 0.01; ***, P < 0.001; two-tailed Wilcoxon Signed Rank Tests; SOUL, n = 36; SSFO, n = 31 neurons from 2 mice).
(d) Schematic of transcranial optical stimulation (blue) of SOUL-expressing lateral hypothalamus (LH, red) through the intact skull (gray) of awake mice.
(e) Coronal section of mice injected with SOUL-P2A-tdTomato in LH, expressing tdTomato (red) in LH and stained for DAPI (blue). Scale bar, 1 mm.
(f) Representative confocal images of LH sections from mice expressing mCherry (red, top panel) or SOUL-P2A-tdTomato (red, bottom panel) and stained for c-Fos (green). Scale bar, 20 μm.
(g) Mean cell counts of c-Fos+ cells in LH of mice injected with AAVs coding SOUL or mCherry (Cont.), as in (e). (Unpaired t-test; *, P < 0.05, P = 0.035; SOUL, n = 3 mice; mCherry, n = 3 mice; Bar graph represents ± SEM).
To address whether SOUL has sufficient photosensitivity to allow for transcranial optogenetic stimulation of the deepest regions in the mouse brain, we selected the lateral hypothalamus (LH) as a target region for two reasons: first, it is one of the deepest areas in the mouse brain (~5.5-6.2 mm below the skull surface); second, it has well-characterized functions that can be readily assessed behaviorally (Jennings et al., 2013). To test whether transcranial activation of SOUL increases neuronal activity in LH, we injected an AAV encoding SOUL-P2A-tdTomato or a mCherry control into the LH of wildtype mice, waited four weeks, performed transcranial optical stimulation (60s, 50mW) via a removable optical fiber placed above the midline of the skull, and then stained LH for c-Fos immunoreactivity. In this condition, light had to travel a distance of up to 6.2mm through the intact skull and brain to reach LH (Fig. 3d, e). Following light stimulation above the skull midline, the number of c-Fos-positive LH neurons was significantly higher in SOUL-expressing mice than in control mice expressing only the fluorophore (Fig. 3f, g). This indicates that non-invasive transcranial optical stimulation can activate SOUL-expressing neurons even in the deepest regions of the mouse brain.
Because of high sensitivity of SOUL we also tested whether ambient light will activate SOUL-expressing neurons in the brain. We examined c-fos protein expression in PV-Cre:SOUL mice, ChAT-Cre:SOUL mice and Nex-Cre:SOUL mice under dark and room light (150 lux) conditions. We found no significant differences in c-fos expression in the brain of these mice between dark and light conditions (Supplementary Fig. 4, 5a, b), suggesting that ambient light will not cause significant activation of SOUL-expression neurons in the mouse brain. However, under strong light (468 lux in a fume hood) we observed strong c-fos staining in the brain, especially in the visual and somatosensory cortex (Supplementary Fig. 5c). Since Nex-Cre is highly expressed in retinal ganglion cells, we examined SOUL-P2A-tdTomato expression in the wholemount retina and noticed a strong tdTomato expression in the retina (Supplementary Fig. 5d), which may contribute to the cortical neuronal activation under strong light. Thus, cautions should be taken to avoid exposing SOUL-expression mice to strong light.
SOUL allows transcranial optogenetic control of mouse behavior
We next tested whether transcranial optogenetic activation of LH is sufficient to cause observable behavioral effects in mice. Previously, it has been shown that photoactivation of excitatory neurons in LH suppressed feeding in food-deprived mice (Jennings et al., 2013). We thus tested whether such effects can be induced by transcranial SOUL activation of CaMKII+ LH neurons and reversed by SOUL deactivation. To do this, we bilaterally injected an AAV encoding CaMKII-Cre into the LH of SOUL knock-in mice, thereby specifically expressing SOUL in CaMKII+ LH neurons (Fig. 4a–c). AAV encoding mCherry under CaMKII promoter was used for control group. Light was delivered through a removable patch cable placed above the skull midline, allowing equivalent illumination of LH in both hemispheres (Fig. 4a). Food-deprived SOUL-expressing mice showed significantly reduced food consumption during a 10-minute window after SOUL activation by blue light (473 nm, 60 s, 50 mW). Moreover, this behavioral effect was completely reversed following deactivation of SOUL via transcranial illumination with orange light (589 nm, 100 s, 25 mW; Fig. 4d). Also, the illumination itself did not activate the mouse’s visual system (Supplementary Fig. 5e–j). Thus, our results show that SOUL can be used to manipulate neuronal activity and behavior through non-invasive transcranial delivery of light in the deepest mouse brain region.
Figure 4. Transcranial stimulation of SOUL in lateral hypothalamus (LH) CaMKII+ neurons inhibits feeding behavior.

(a) Schematic of transcranial stimulation of SOUL expressed in bilateral LH (red) in awake food-deprived mice.
(b) Coronal section of SOUL knock-in mice injected with CaMKII-Cre in LH, expressing tdTomato (red) in LH and stained for DAPI (blue). Scale bar, 1 mm.
(c) Confocal image of SOUL-P2A-tdTomato expression in LH neurons. Scale bar, 40 μm.
(d) Mean (± SEM) food consumption during 10 minutes after SOUL activation (ON) and during 10 minutes after SOUL deactivation (OFF) of LH across SOUL-expressing mice and control mice (CaMKIIa::SOUL, n = 4 mice; Control, n = 4 mice, two-way ANOVA with Bonferroni post-hoc analysis; *, P < 0.05, F(1, 12) = 7.647).
Next, we assessed the safety of transcranial light stimulations as well as compared intracranial and transcranial stimulation methods in terms of brain tissue injury. Potential cell inflammation and injury was assessed by microglia activation (Kreutzberg, 1996). For this purpose, we measured Iba-1 immunoreactivity 24 hours after transcranial light delivery (same procedure as those used in the feeding behavior experiment) to naive WT mice (no viral injection) or two weeks after fiber implantation in naive WT mice. We also included naive WT mice without any treatment as a baseline control group. There was no increase in lba-1 immunoreactivity in mice after transcranial light stimulation as compared to control mice. In contrast, the lba-1 immunoreactivity of mice with fiber implantation was 2.4-fold greater than that of control mice (Fig. 5), indicating a significant inflammatory response. Therefore, transcranial stimulation of SOUL does not cause brain inflammation and injury that can be associated with optogenetic fiber implantation.
Figure 5. Microglia activity in response to transcranial optical stimulation or fiber implantation.

(a) Schematic of in vivo transcranial stimulation and the cortical area (black square) right underneath the stimulation site. The black squared area was used for lba-1 immunoactiviy quantifications.
(b,c) Representative confocal images (b) and quantification (c, fluorescence intensity arbitrary units) of lba-1 immunoactivity of black squared area in (a) of mice with no treatment (NT), mice with blue and orange light transcranial illumination (Transcranial); mice with fiber implantation (Fiber); or corresponding cortical area contralateral to implant hemisphere of the fiber-implanted mice (Contralateral) (Scale bar, 20 μm; One way ANOVA with Tukey’s post-hoc analysis; ****, P < 0.0001; F(3, 16) = 60.51; NS, not significant; n = 5 mice for each group; bars and error bars represents mean ± SEM.).
SOUL-mediated large-scale optogenetic activation of macaque cortex by transdural illumination
We next tested a method for large-scale, minimally invasive optogenetic stimulation of macaque cortical neurons by transdural illumination. By replacing the traditional illumination approach – an implanted optical fiber – with an external fiber outside the dura, we overcame the limitation imposed by an implanted fiber on the total volume of brain tissue that can be illuminated, since the volume can be increased by increasing the diameter of the beam that illuminates the cortical surface while increasing the total power to maintain the same power density. Furthermore, transdural illumination not only prevents the damage typically caused by implantation of light delivery devices, but further minimizes potential inflammation or infections caused by perforating the dura to reach the brain. We hypothesized that the high photosensitivity of SOUL would allow it to activate deep cortical neurons in macaques by light delivered above the dura, despite light attenuation by both the dura and the brain (Fig. 6a).
Figure 6. SOUL-mediated modulation of spiking activity in macaque neurons by transdural optical stimulation.

(a) Schematic illustration of a cross-section of the chamber and our minimally invasive optogenetic method.
(b), (d) Raster plot (top panel) and mean firing rate over time (bottom pannel) for two example single neurons during multiple trials with blue and orange light illumination (color bars), BS: baseline; BL: blue-light; PB: post-blue; OL: orange light; PO: post-orange.
(c), (e) Firing rate of the units in (b,d), respectively, during baseline (BS), post-blue (PB) and post-orange (PO) periods. ***, P < 0.001, paired t-test; NS, not significant. Spikes are downsampled in (b) and (d) for better visulization.
(f) Percentage of units with significantly increased (←) or decreased (↓) firing rate after blue light stimulation (compared to baseline; paired t-tests, alpha < 0.05; see Methods), with (black) or without (grey) returning to baseline after orange light illumination (Paired t-tests, alpha < 0.05; n = 215).
(g) Frequency histogram of firing rate modulation magnitudes (percent change from baseline, logarithmic scale) among modulated units (n = 128).
(h) Frequency histogram of firing rate modulation latency (logarithmic scale) after blue light onset among modulated units.
(i) Percentage of modulated units with a modulation duration of at least 40, 80 or 120 s (complete post-blue period) after blue light offset.
(j) Recording depth and magnitude of all modulated units (circles).
(k) Percent of modulated units at different recording depths.
While keeping the dura intact, a standard cranial chamber was implanted around a craniotomy performed above the left lateral prefrontal cortex (area 8A(Paxinos, 2000)) of a Rhesus macaque monkey (Macaca mulatto). This allowed the region of interest to be accessible for virus injections, laser illumination and electrophysiological recordings. We performed injections of AAV9 encoding SOUL-P2A-tdTomato under the human synapsin (hSyn) promoter along three penetrations 2 mm from each other and forming a triangle. In each penetration, injections were made at 7 depths from the brain surface distributed between 0.5 and 5.6 mm. Injections into cortex at such depths were possible due to their placement near the dorsal lip of the principal sulcus. We measured the total superficial cortical area with opsin expression to be 28 mm2 (see Methods and Supplementary Fig. 6a, b). Based on this observation and on the pattern of injection depths, we estimated the cortical volume with expression to be approximately 140 mm3 (see Methods).
Before each recording session, we placed a step-index optical fiber 4 to 10 mm above the dura, which allowed us to generate a blue or orange light beam between 1.8 mm and 4.4 mm in diameter covering a cortical area of up to 15 mm2 with a lower power distribution disparity than a regular fiber or an implanted fiber. We recorded single neuron and multiunit activity with a 16- or 32-channel linear probe implanted within the injected region (Fig. 6a; see Methods). In each trial, we recorded 30 s of baseline activity, and then delivered 10 s of blue light. Two minutes later, we delivered 20 s of orange light. This regime was repeated multiple times.
As shown in Fig. 6b–e for two example single neurons, spiking activity increased upon blue light delivery and remained elevated after blue light offset (post-blue period, PB). After orange light delivery (post-orange period, PO), activity decreased back to baseline (BS, before blue delivery). To test whether each single neuron and multiunit was activated by blue light (e.g., Fig. 6c, e), we statistically compared the firing rates during baseline and post-blue periods; to test the effectiveness of the orange light deactivation, we compared the firing rate during the baseline and post-orange periods. We found that for 60% of all recorded units (128/215), the firing rate was significantly increased after blue light delivery (Fig. 6f; Supplementary Fig. 6e; paired t-test, P < 0.05). Among all significantly activated units, 89% returned to baseline activity following orange light delivery (Fig. 6f, Supplementary Fig. 6e; paired t-test, P < 0.05). Interestingly, other response types were observed in a minority of units: 3.4% of all units showed no significant activity increases after blue light but significant activity decreases after orange light, and 2.3% showed a significant decrease in activity in the post-blue period (Fig. 6f, Supplementary Fig. 6e), a phenomenon that may be due to inhibition either by SOUL-expressing interneurons or by inhibitory interneurons activated by SOUL-expressing pyramidal neurons. We tested whether there was a relationship between each unit’s baseline firing rate and the presence of significant activation, but found no significant difference in baseline firing rate between units that showed activation and those that did not (Supplementary Fig. 6f; Wilcoxon rank-sum test, P = 0.13). Importantly, our light stimulation paradigm did not cause any observable temperature increases inside the cortex, as measured by a temperature probe placed at multiple depths from the cortical surface (Supplementary Fig. 7; see Methods).
For all units showing significant increased activity in the post-blue period, we then quantified the magnitude, latency, and duration of this effect. On average across these units, firing rates during the post-blue period were more than double the baseline (Fig. 6g; magnitude of activity increase = 113%, std. dev. = 214%, n = 128). This effect emerged around 4.6s after blue light onset (median latency), varying largely across units (Fig. 6h; std. dev. = 28.7 s). In 43% of the modulated units, the firing rate remained elevated for the entire 2 minutes post-blue period and returned to baseline only after orange light illumination (Fig. 6i).
To examine the effects of optogenetic stimulation on units at various cortical depths, we recorded units using a multi-contact linear electrophysiological probe (Fig. 6a). Modulated units were found across all recorded depths, including our deepest recordings. Across significant units (but not across non-significant units; Supplementary Fig. 6g), mean magnitude showed an overall decrease as a function of depth (Fig. 6j, correlation coefficient = −0.26, p = 9.6 × 10”5), while the highest percentage of modulated units was observed between 2 and 3 mm deep (Fig. 6k). Since the thickness of Rhesus macaque cortex typically ranges between 2 and 3 mm, our results indicate that external optical stimulation of SOUL allows activation of neurons across all depths in superficial cortical regions. To what extent neurons in deeper brain regions can be activated with external stimulation of SOUL remains to be determined by additional tests with injections and recordings in a wider range of regions and depths.
In addition to the experimental procedures performed on the left prefrontal cortex chamber, we also performed identical virus injections in a chamber placed over the right prefrontal cortex of the same animal, where the native dura was surgically removed and replaced with a transparent artificial dura (Supplementary Fig. 6a, see Methods). These injections were performed on the same day as those on the left prefrontal cortex. The transparency of the artificial dura provided visual access to the cortical surface, thus allowing us to track the spatial pattern of SOUL expression across the cortical surface over time by measuring red fluorescence due to co-expression of tdTomato. This procedure thus allowed us to schedule the experimental sessions on the left prefrontal chamber (intact native dura) for a period during which high levels of tdTomato fluorescence were visible on the right prefrontal chamber (artificial dura). High levels of red fluorescence were visible as early as 14 days, and as late as 5 months, after virus injections (Supplementary Fig. 6b). All experimental sessions were performed during this period. Viruses may have persisted for longer, but it was not monitored beyond this period. Fluorescence covered an oval area of 28 mm2 around the 3 injection locations and the average expression radius around each location was 2.1 mm (see Methods). Measuring the spatial extent of expression served as a guide in deciding the extent of locations of electrode penetrations and the diameter of the laser beam. By further recording spiking activity with a linear electrode implanted through the artificial dura, we confirmed that neurons showed activation and deactivation in response to blue and orange light illumination, respectively (Supplementary Fig. 6c, d). This demonstrates the feasibility of SOUL-mediated optogenetic activation using an artificial dura method. While an artificial dura implant is more invasive and may require additional care than an intact dura chamber to prevent infections or inflammation, it has the advantage of allowing experimenters to track the spatial and temporal patterns of virus expression in order to optimize the performance of experimental procedures, as our results demonstrate.
SOUL induces local field potential oscillations in macaque cortex
Visual inspection of the raw electrophysiological signals recorded during most sessions revealed the presence of strong rhythmic fluctuations in the local field potentials (LFPs) following blue light delivery (Fig. 7a). This suggested the possibility that optogenetic activation of macaque cortex expressing hSyn-SOUL-P2A-tdTomato induced synchronized oscillations in the synaptic activity of the underlying neuronal population. We therefore performed time-frequency power analysis in each recorded channel to examine whether the power at different LFP oscillatory frequencies was modulated upon blue light delivery compared to the baseline period. As shown in Fig. 7b, c for two example LFP channels, the power of oscillations in several frequency bands was significantly elevated during the post-blue period with respect to the baseline period (cluster-based randomization test, alpha < 0.05, see Methods).
Figure 7. Modulation of LFP oscillations in macaque cortex by transdural optical stimulation of SOUL.

(a) Local field potential amplitude over time for an example recording channel before (top panel) and after (bottom panel) blue light stimulation in one representative trial.
(b), (c) Spectrograms of two example recording channels showing mean LFP power across trials (% change from baseline, color scale) as a function of time and frequency. Colored bars, blue and orange light illumination periods. Time-frequency clusters with significant modulation compared to baseline are indicated by black outlines (see Methods). High and low frequencies are shown at different scales.
(d) Percentage of channels (n = 176) with significant power modulation at each frequency. Color bars indicate frequency bands with significant peaks.
(e-g) Mean (±SEM) power modulation magnitude (% change, e), latency (f) and duration (g) across all modulated channels.
We repeated the above analysis for each of the 160 recorded channels and calculated the percentage of channels showing a significant modulation in power at each frequency during the post-blue period with respect to the baseline period (Fig. 7d). Among all channels, only significant power increases, but not decreases, were present. We found that LFP power modulation did not occur randomly throughout all frequencies but was instead clustered into 3 large peaks (labeled alpha/theta, gamma2, and gamma3), and a smaller but still significant peak (labeled gamma1). These 4 peaks were detected using a quantitative analysis (see Methods).
Across all channels, the increases in power were strongest in the alpha/theta band, with a 361% average increase from baseline, while increases of 53-63% were observed in the gamma bands (Fig. 7e). For each of the above frequency bands, we also quantified the latency and duration of the power modulation between the blue light onset and the orange light offset. Across all channels, the mean latency showed an inverse relationship with the frequency of each band, with the highest frequency band (gamma3) showing the earliest effect (17 s), and the lowest band (alpha/theta) showing the latest effect (37 s, Fig. 7f). The alpha/theta band had the longest mean duration of modulation (58 s), in contrast with 30-45 s for the gamma bands (Fig. 7g).
Lastly, to examine whether the power modulation in each frequency band ceased with orange light delivery, we tested for each modulated channel whether the modulation remained present in the post-orange period. In 91% of modulated channels, the alpha/theta power modulation ceased after orange laser illumination, while the modulation in all gamma bands ceased in 100% of the channels. This indicates that deactivation of SOUL disrupts the optogenetically-induced oscillations.
DISCUSSION
To develop a minimally invasive optogenetic tool, we engineered SOUL, a new step-function opsin with ultra-high light sensitivity. Taking advantage of this unique photosensitivity, we were able to activate SOUL in the awake mouse brain by a brief pulse of transcranial optical stimulation, causing a long-lasting increase in neuronal spiking activity even in the deepest regions of the mouse brain. While previous studies have developed various methods for noninvasive neuronal activation by optogenetics (Hira et al., 2009; Lin et al., 2013; Tanaka et al., 2012), our study is the first to demonstrate a method for activation of any mouse brain region independent of its location via transcranial opsin stimulation, due to SOUL’s superior light sensitivity.
The superior photosensitivity of SOUL allows several improvements in the application of optogenetics methods. The noninvasiveness of transcranial optogenetic stimulation conveys the advantage of minimizing the requirements for surgical procedures and avoiding physical and inflammatory damages of neural tissues. Furthermore, because SOUL can be activated by lower-power light, neural tissue heating by light delivery is minimized. In mouse behavioral experiments requiring perturbations of neural activity, optogenetics offers the advantage of higher temporal resolution, yet tissue damage is always a concern. And while chemogenetics is non-invasive, it has the drawback of low temporal resolution (Alexander et al., 2009; Armbruster et al., 2007). Optogenetic stimulation with SOUL offers a solution to both of these limitations. In addition, SOUL can also be useful in longitudinal experiments requiring non-invasive perturbations of neuronal activity throughout the developmental stages of mice, since it does not require the chronic implantation of optical fibers in infants, which may lead to severe tissue damage and abnormal brain development. Moreover, SOUL will be an ideal tool for experiments requiring activation of multiple brain areas, since transcranial illumination can span the entire brain and can therefore activate any number of SOUL-expressing regions; this will eliminate complications from the insertion of multiple fibers. Furthermore, once activated with blue light, SOUL remains in the open state for tens of minutes. This allows researchers to activate brain regions and subsequently free the animals from the optical fibers, thus facilitating experiments requiring animals to be disconnected from all equipment, particularly species whose behaviors involve long-range movements.
Prior to our study, a few studies have contributed in various ways to the development of non-invasive optogenetic stimulation methods (Chen et al., 2018; Hira et al., 2009; Prakash et al., 2012; Tanaka et al., 2012). ReaChR, a fast-cycling opsin, was shown to induce action potentials in mice using particular combinations of target regions and illumination regimes, i.e., activation in superficial regions (motor cortex) by illumination through the closed skull, or in the brainstem by illumination at the opening of the external auditory canal(Lin et al., 2013). Jaws, a recently reported red-shifted crux-halorhodopsin, mediates strong noninvasive neural inhibition in brain structures up to 3 mm deep (Chuong et al., 2014). Whether transcranial illumination can activate ReaChR or Jaws in any mouse brain region independent of its depth remains to be tested.
Importantly, we also showed optogenetic activation of macaque cortical neurons with external illumination through a transparent artificial dura using SOUL. This method was first implemented by previous studies using other opsins (Nassi et al., 2015; Ruiz et al., 2013). Because an artificial dura provides optical access to the cortical surface, it allowed precise localization of the virus injections, electrodes and laser beams with respect to anatomical landmarks, as well as day-by-day visualization of the extent of virus expression on the cortical surface as indicated by epifluorescence. However, the method has some disadvantages including additional surgical procedures for removal of the native dura, implantation of the artificial dura and increased risk of infection and inflammatory reactions. Our study further introduced an important methodological advance that overcomes these problems: taking advantage of the superior photosensitivity of SOUL, we demonstrate a method for optogenetic stimulation of macaque cortex with external illumination through the intact dura. To our knowledge, no study to date has demonstrated an optogenetic method with such minimal invasiveness in macaques. Our method offers some of the same benefits in macaques as it does in mice, including the prevention of tissue damage, infection and inflammation due to surgical invasiveness. Our demonstration of transcranial optogenetic stimulation in mice raises the possibility of accomplishing the same in macaques. However, a major difference between these species is that the skull is much thinner in the mouse than in the macaque. This may be overcome using methods for skull thinning (Frostig et al., 1990; Schiessl and McLoughlin, 2003) or skull clearing (Zhao et al., 2018) in macaques, although this remains to be tested.
Due to the use of external illumination, our method in macaques offers the potential to simultaneously activate neurons within a region of cortex in the scale of hundreds of squared millimeters, a magnitude or two larger than what can be achieved with internal illumination (Acker et al., 2016). We performed virus injections in three cortical penetrations separated by approximately 2 mm, leading to an expression area of 28.4 mm2 and a volume of 140 mm3. However, the method offers the potential to activate a much larger volume of surface cortex within the cranial chamber by performing a larger number of injections and increasing the laser beam size. Perturbing activity in the scale of an entire functional region of cortex will allow experimenters to address more effectively its contribution to a given brain process or behavior. To date, a major challenge faced by primate optogenetic studies has been to obtain behavioral effects with a magnitude comparable to those observed in mice. This challenge may be due to the limits in the anatomical scale of primate optogenetic effects with internal illumination (Galvan et al., 2017). By increasing the spatial scale of the perturbation, our external illumination method offers a putative solution to this challenge, although this remains to be tested.
A few special considerations must be made to ensure the success of this large-scale optogenetic method. First, while our temperature measures revealed no systematic temperature increases in the brain with the laser power levels used here, the need to increase the total power to illuminate larger regions could lead to more heating around the illuminated area. Future tests will be needed to measure temperature changes during illumination of larger cortical surfaces, and their potential short-term and long-term effects on the brain, and to help develop cooling methods to prevent such effects if necessary. Second, with the use of higher levels of total light power, it becomes particularly important to ensure that the chamber is completely light-sealed (as was done in our study) to prevent the laser light from reaching the exterior and causing visually-driven activation of neurons; such confounder, however, is partly controlled for by the fact that our step-function opsin activates neurons beyond the period of optical stimulation. Third, while our experiments used step-index fibers to maximize the even spread of light across the cortical surface, light scattering might result in an uneven distribution of light, particularly at the beam edges. To prevent this effect at the edges of targeted region, it might be necessary to extend the beam size slightly beyond these edges. Lastly, for large-scale activation of deeper structures of the primate brain, our method will require modifications to ensure that the appropriate amount and spread of light power is provided, accounting for light scattering.
We also demonstrated that optogenetically inducing an activated state in prefrontal cortex via SOUL caused neurons to synchronize their activity and generate oscillatory patterns in the LFPs. These oscillations were expressed in both low (theta/alpha) and high (gamma) frequency bands. While our study does not allow us to determine why SOUL-mediated activation leads to the generation of oscillatory patterns, it is possible that a long, sustained increase in the activity of a cortical circuit is sufficient for neurons to engage in massive synchronization that leads to the emergence of rhythmic activity. While the power modulation was much larger in the theta/alpha frequency range than in the gamma range, there was an inverse relationship between band frequency and modulation latency, with the highest gamma modulation appearing first (an average of 12.4 s after the appearance of the spiking modulation) and the theta/alpha modulation appearing last. This suggests that upon increases in cortical activity, it takes longer for neurons to synchronize their activity into lower-frequency rhythms than high-frequency ones. Why lower-frequency oscillations in the theta/alpha range show such a late onset remains to be investigated.
Theta and gamma rhythms have previously been related to multiple brain functions, including feedforward information flow, working memory maintenance, decision making, sleep, and visual attention (Dzirasa et al., 2009; Fries, 2015; Schaich Borg et al., 2017). However, almost all of these studies have been correlational, since causal tests require experimentally inducing or perturbing specific oscillations in a systematic and controlled fashion – a major challenge to date. Our work offers a new toolbox for induction of oscillations at theta and gamma frequencies, which we hope will facilitate causal tests for their role in brain functions and disorders. This technique offers one important advantage: the fact that the induced oscillations emerge following a 10 s square pulse of blue light and remain beyond this period means that they are not generated by rhythmic optical stimulation (Iaccarino et al., 2016) , nor do they require the presence of optical stimulation to persist. Instead, they emerge as an intrinsic property of the network in response to activation. Future studies with cell type-specific activation may help us dissect the mechanisms underlying brain rhythms.
Besides being a useful tool for understanding the mechanisms underlying certain neurological and psychiatric disorders in animal models, optogenetics also has the potential for clinical use in the treatment of such disorders in humans. Particularly, disorders caused by neuronal activity or neurotransmitter imbalance may be treated by restoring this imbalance using optogenetic stimulation. Examples of this are studies that have used optogenetics in mouse models to control symptoms of absence seizures (Sorokin et al., 2017) and autistic-like behaviors (Yizhar et al., 2011b), Parkinson’s disease (Gradinaru et al., 2009) and stroke (Cheng et al., 2014).
Traditional neurological treatments such as deep brain stimulation, pharmacological intervention and surgical ablation are all known to have major side effects due to their limited specificity. Optogenetics, in contrast, allows neuronal manipulation with higher temporal and spatial specificity and has the potential for cell type-specific targeting (El-Shamayleh et al., 2016) . However, several goals will need to be accomplished before optogenetics can be considered a viable treatment option (Williams and Denison, 2013): The first and most important will be to carefully evaluate the potential risks of trying such treatments in patients, especially risks associated with transfer and expression of the opsin genes (Frederic et al., 2014); second, to find solutions to excitotoxicity, which may affect the longevity of SOUL-expressing neurons due to undesirable intracellular acidification and/or mitochondria-mediated apoptosis (Maimon et al., 2018); third, to deliver an appropriate amount of light that is high enough to activate the opsin across an entire target region, but low enough to prevent noxious levels of heating; fourth, to ensure that the implanted optical device will cause minimal damage to the patients’ brain. The properties of SOUL may help accomplish some of these goals. Due to its superior photosensitivity, it can activate a larger volume of cortex with minimal light power. This advantage will be essential, given that the regions to be targeted for treatment are larger than the regions of interest typically targeted in mouse and macaque optogenetic studies. To target superficial cortical regions, it may be possible to deliver light noninvasively from outside the cortical surface or, perhaps, even outside the dura, as shown here for the macaque. To target deeper regions, the higher photosensitivity of SOUL will also be advantageous in that despite the potential need for implantation of an optical fiber, the brain volume receiving enough light for SOUL activation will be larger. Due to these advantages, SOUL-based optogenetics may be explored for minimally invasive treatment for neurological and psychiatric disorders.
STAR METHODS
Resource Availability
Lead Contact
Further information and requests for resources and reagents should be directed to and will be fulfilled by the Lead Contact, Guoping Feng (fengg@mit.edu).
Materials Availability
The Mouse line generated in this study have been deposited to Jackson Laboratory and named R26-LSL-SOUL-P2A-tdT mice, JAX Stock No. 032301.
Data and Code Availability
The custom written scripts supporting this study have not been deposited in a public repository because they require extensive user experience to navigate but are available from the corresponding author on request.
Experimental Model and Subject Details
Hippocampal neuron cultures
Hippocampal neurons were prepared from postnatal day 0-3 Swiss Webster (Taconic) mice as previously described (Chow et al., 2010; Klapoetke et al., 2014) but with the following modifications: dissected hippocampal tissue was digested with 100-200 units of papain (Worthington Biochem) for 8 min, and the digestion was stopped with ovomucoid trypsin inhibitor (Worthington Biochem). Cells were plated at a density of 52,000-64,000 per glass coverslip coated with Matrigel (BD Biosciences). Neurons were seeded in 75 ul Plating Medium containing MEM (500 mL, Life Technologies), glucose(2.5 g, Sigma), transferrin (50 mg, Sigma), Hepes (1.19 g, Sigma), glutagro (5 mL, 200 mM stock, Corning), insulin(1 mL, 12.5 mg/mL stock, Millipore), B27 supplement (10 mL, Gibco), heat inactivated fetal bovine serum (50 mL, Corning). After cell adhesion, additional 1 mL of Plating Medium was added. When glia density was 50-70% (about 2 days later), 1 mL of AraC Medium containing MEM (500 mL, Life Technologies), glucose (2.5 g, Sigma), transferrin (50 mg, Sigma), Hepes (1.19 g, Sigma), glutagro (1.25 mL, 200 mM stock, Corning), AraC (500 uL, 4 mM stock, Millipore), B27 supplement (10 mL, Gibco), heat inactivated fetal bovine serum (25 mL, Corning) was added. Neurons were grown at 37C degree and 5% CO2 in a humidified atmosphere. Cell plating density was determined using Countess II cell counter (Thermofisher).
Mouse lines
All husbandry and experimental procedures in this study were approved by the Committee for Animal Care of the Massachusetts Institute of Technology, conformed to the guidelines of the Division of Comparative Medicine, and were consistent with the Guide for Care and Use of Laboratory Animals (Eighth Edition, 2011).
The following mouse lines were used to crossed with the SOUL knock-in mice generated in this study: Parvalbumin-IRES-Cre (PV-Cre, Stock No. 017320, The Jackson Laboratory), Drd1a-Cre (D1-Cre, GENSAT BAC transgenic EY217) or ChAT-IRES-Cre driver mice (ChAT-Cre, Stock No. 006410, The Jackson Laboratory), to generate PV-Cre:SOUL, D1-Cre:SOUL and ChAT-Cre:SOUL mice. C57Bl/6J mice (Stock no. 000664, The Jackson Laboratory) were used for virus injection and behavior test. Adult mice of both genders, between 12-20 weeks old were used. Mice were housed at 22-25 °C on a circadian cycle of 12-hour light and 12-hour dark with ad-libitum access to food and water, unless placed on the food restriction schedule. In selected experiments, mice were food deprived the night before and given ad libitum food during the experiment (fasting not to exceed 16 hours in total). Mice were housed with cage mates except after surgery when they were housed individually.
Macaque
All procedures were approved by the Committee for Animal Care of the Massachusetts Institute of Technology, conformed to the guidelines of the Division of Comparative Medicine, and in accordance with NIH guidelines for animal research. A 19-year old adult male rhesus macaque (Macaca mulatto) weighing 12.5 kg was used in the study. The animal was housed in a cage on a circadian cycle of 12-hour light and 12-hour dark, with ad-libitum access to food and water, as well as toys and other objects for environmental enrichment.
Method Details
Mouse Methods
Cre-dependent SOUL knock-in mouse line
The SOUL construct was created by introducing the T159C mutation into the SSFO (ChR2 C128S/D156A) cDNA by Quikchange mutagenesis. The SOUL cDNA was subcloned into the rAAV-hSyn1-P2A-tdTomato vector using NheI and HpaI restriction enzyme sites, thereby generating rAAV-hSyn1-SOUL-P2A-tdTomato construct. To create the Rosa26 targeting vector, first, the Ai9 targeting vector (a gift from Hongkui Zeng; Addgene vector #22799) was modified by replacing the FseI-tdTomato-FseI fragment with a new FseI-BstBI-EYFP-MluI-FseI fragment, yielding vector Ai9-EYFPmod. The SOUL-P2A-tdTomato expression cassette was then subcloned into Ai9-EYFPmod using BstBI and MluI restriction sites on the vector and BstBI and AscI restriction sites on the insert. The ligation reaction reconstituted the 5’ BstBI site but destroyed the 3’ MluI site in the resultant Ai9-SOUL-P2A-tdTomato targeting vector. Critical elements were verified by DNA sequencing. The targeting vector was linearized with KpnI and purified by phenol/choloroform extraction prior to electroporation into R1 mouse embryonic stem cells for homologous recombination. ES cells were grown under G418 selection, and correctly targeted ES cell clones were identified by PCR screening with primers R26SA-F5: 5’-TTGGTGCGTTTGCGGGGATG-3’ and CAG02B: 5’-GTTATGTAACGCGGAACTCC-3’ (~1.1 kb band), and subsequently injected into blastocysts derived from C57BL/6 donor mice. High percentage chimeric male mice were mated to wild-type C57BL/6 female mice for obtaining germline transmission of the Cre-inducible SOUL allele and establishment of the line. Subsequent genotyping was carried out by polymerase chain reaction using the following primers: Rosa01F 5’-CACTTGCTCTCCCAAAGTCG-3’, Rosa02B 5’-TAGTCTAACTCGCGACACTG-3’, and CAG-02B 5’-GTTATGTAACGCGGAACTCC-3’. The product from the endogenous Rosa26 allele is 550 bp and the product that is specific for the modified Rosa26 allele is 325 bp. The mice were backcrossed to C57B16/J mice for at least 11 generations prior to breeding animals for experiments. This SOUL knock-in mice will be available from The Jackson Laboratory as Stock No. 032301.
In vitro recording
Neurons were transduced at ~2 days in vitro with AAV encoding hSyn-SSFO-P2A-tdTomto (Boston Children’s Hospital Viral Core, 2 ul) or hSyn-SOUL-P2A-tdTomato (Boston Children’s Hospital Viral Core, 1.5 ul) per well. For the assessments of photocurrent and intrinsic properties on the cultured mouse primary hippocampal neurons, whole-cell patch clamp recordings were performed as described (Nehme et al., 2018). Recording pipettes were pulled from thin-walled borosilicate glass capillary tubing (KG33, King Precision Glass, CA, USA) on a P-97 puller (Sutter Instrument, CA, USA) and had resistances of 3-5 MΩ when filled with internal solution (in mM: 128 K-gluconate, 10 HEPES, 10 phosphocreatine sodium salt, 1.1 EGTA, 5 ATP magnesium salt and 0.4 GTP sodium salt, pH=7.3, 300-305mOsm). The cultured cells were constantly perfused at a speed of 3 ml/min with the extracellular solution containing (in mM: 119 NaCl, 2.3 KCl, 2 CaCl2, 1 MgCl2, 15 HEPES, 5 glucose, pH=7.3-7.4, Osmolarity was adjusted to 325 mOsm with sucrose). All the experiments including the coverslips transferring and recordings were strictly performed at dark to avoid any activation by the light from the environments.
Cells were visualized with a 40X water-immersion objective on an upright microscope (Olympus, Japan) equipped with IR-DIC. Recordings were made using a Multiclamp 700B amplifier (Molecular Devices, CA, USA) and Clampex 10.7 software (Molecular Devices, CA, USA). In voltage clamp mode, we delivered 5s 470 nm light pulses of different level of powers (3μW/mm2, 8μW/mm2, 20μW/mm2, 60μW/mm2, 1mW/mm2) to photoactivate the cells, and used 5s 1mW/mm2 589 nm orange light to deactivate the SSFO or SOUL. The membrane potential was held at −60 mV in the presence of 100 μM PTX and 50 μM NBQX to block GABAergic inhibitory and AMPA mediated excitatory synaptic transmission. Subsequent analysis was performed using Clampfit 10.7 software (Molecular Devices, CA, USA). The data were stored on a computer for subsequent off-line analysis. Any cells with Rs more than 20 MΩ at any time during the recordings were discarded.
Slice recording
Acute brain slices were prepared from 1.5 to 4-month-old mice. Animals were anesthetized by intraperitoneal injection of avertin (tribromoethanol, 20 mg/ml, 0.5 mg per g body weight) and perfused with ice-cold NMDG-based solution: 92 mM N-methyl-d-glucamine (NMDG), 2.5 mM KCl, 1.20 mM NH4PO4, 30 mM NaHCOs, 20 mM HEPES, 25 mM glucose, 2 mM thiourea, 5 mM Na-ascorbate, 3 mM Na-pyruvate, 0.5 mM CaCl2 and 10 mM MgSO4 (~300 mOsm, 7.2–7.4 pH). Following decapitation, brains were removed for coronal sectioning (300 pm) in the same NMDG-based solution using a Vibratome 1000 Plus, Leica Microsystems, USA. Slices were then recovered in carbonated regular aCSF: 119 mM NaCl, 2.5 mM KCl, 1.2 mM NaH2PO4, 24 mM NHCO3, 12.5 mM glucose, 2 mM MgSO4.7H2O, 2 mM CaCl2.2H2O (~300 mOsm, 7.2–7.4 pH) at 32–34°C for 10 min and transferred to room-temperature carbonated regular aCSF. Slices were allowed to recover for at least 1h prior to all recordings. Slices were transferred into a recording chamber (RC-27L, Warner Instruments) and constantly perfused at room temperature (20–24 °C) with carbonated regular aCSF at a rate of approximately 2 mL/min. Borosilicate glass recording microelectrodes (King Precision Glass) were pulled on a P-97 horizontal puller (Sutter Instruments) and backfilled with KGlu internal recording solution (145 mM K-Gluconate, 10 mM HEPES, 1 mM EGTA, 2 mM Mg-ATP, 0.3 mM Na2-GTP, and 2 mM MgCl2). The internal pH was adjusted to ~7.3 with KOH and osmolarity adjusted to ~300 mOsm with K2SO4. The electrode tip resistance in the bath when filled with this internal solution was 3–5 MOhms. Recordings were performed in the dark after initially illuminating the slices with a custom mKate2 microscope filter (Ex max 590 nm, Em max 635 nm) and a mercury arc lamp. Cells were visually identified based on visualization of the tdTomato fluorophore. Recordings were initiated after seal rupture, initial stabilization, and equilibration of the whole-cell configuration for at least 3 min to allow dialysis of the internal recording solution. In order to measure the rheobase current, current clamp traces were recorded with 40 sweeps of current injections, each lasting 500 ms and starting from −150 pA with increments of 25 pA with (ON) or without (OFF) a 2s period of light pulse preceding the injection. Resting membrane potentials were determined in current clamp setting at baseline, after a 2s pulse of ON light (GFP filter), and after a 2s pulse of OFF light (mKate2). Photocurrents were measured in voltage clamp while holding the cell at −70V. The firing facilitation of SOUL was determined by examining the number of action potentials elicited upon current injection for several steps with or without prior 2s illumination with ON light (GFP filter) in voltage clamp configuration. For the membrane time constant, voltage-clamp trace recording followed a 2s ON light pulse (GFP filter) for 20-30 min, followed by a 2s OFF light pulse (mKate2) to return to baseline. The time constant was calculated by averaging the current for several time bins (each 1 min). The current of each bin was normalized to the peak current bin (first time bin). Tau (defined as the time when current is 1/e of max) was calculated from a mono-exponential fit. Data were acquired using a MultiClamp 700B amplifier and a Digidata 1440A. All analysis was performed using pCLAMP10 (Axon Instruments, Molecular Devices) and MATLAB.
Virus injection
Mice were primed for anesthesia in an induction chamber with a mix of 5% isofluorane/O2 circulated at a rate of 1L/min. Deeply anesthetized mice were maintained under anesthesia with 1-1.5% isoflurane/O2 and mounted on a stereotactic frame. The animals’ heads were shaved, and the remaining hair was removed with Nair. Body temperature was measured through a rectal probe and maintained using an electrical heating pad. Injections were performed with a glass micropipette (7-9 μm diameter). The injection speed was controlled at 100 nl/min with a micromanipulator (Quintessential Stereotaxic Injector, Stoelting). For in vivo electrophysiology experiment in mouse, titer-matched adeno-associated virus (AAV) encoding hSyn-SSFO-P2A-tdTomto (Boston Children’s Hospital Viral Core, total volume of 150 nl) or hSyn-SOUL-P2A-tdTomato (Boston Children’s Hospital Viral Core, total volume of 150 nl) was injected into the mediodorsal thalamus (MD) on opposite hemispheres of the same C57B1/6J mice at the following coordinate: anterior posterior (AP) −1.3 mm, medial lateral (ML) ± 0.6 mm, dorsoventral (DV) −3 mm. For the optical stimulation-evoked c-Fos staining experiments, AAV encoding hSyn-SOUL-P2A-tdTomato (Boston Children’s Hospital Viral Core, total volume of 120 nl) or mCherry (Penn Vector Core, total volume of 120 nl) was injected into the lateral hypothalamus (LH) of C57Bl/6J mice at the following coordinate: AP −1.6 mm, ML ±1.0 mm, DV −5.7 mm. For the feeding behavior test, AAV encoding Cre or mCherry under CaMKII promoter (both from Penn Vector Core, total volume of 120 nl) was injected into the bilateral LH at the following coordinate: AP −1.6 mm; ML ±1.0 mm; DV −5.7 mm. All viral vector titers were in the range of 2-9×10¹³ genome copies (GC) per mL. Experiments were performed at least 2-4 weeks after virus injection.
Implantation of sleeve and optical fiber(s)
For optical stimulation of LH, a mating sleeve to be connected to the patch cable was implanted above the skull midline at AP = −1.6 mm. For in vivo comparison of SSFO and SOUL in MD, a 400 μm diameter optic fiber (Doric lenses, Quebec, Canada) was embedded centrally above the skull midline at AP −1.4 mm to deliver the transcranial stimulation and 200μm diameter fibers equipped with a 45 degree mirror tip were bilaterally implanted adjacent to the electrode arrays for direct stimulation of MD thalamus in each hemisphere separately. For the analysis of microglia activity in response to fiber implantation, an optic fiber was implanted into the cortex at the following coordinates: AP +1.6 mm, ML 1.0 mm, DV −0.5 mm. Mice had at least 2 weeks to recover after surgery.
In vivo electrophysiology in mice
For multi-electrode array construction and implantation, custom multi-electrode array scaffolds (drive bodies) were designed using 3D CAD software (SolidWorks) and printed in Accura 55 plastic (American Precision Prototyping) as described previously (Brunetti et al., 2014; Liang et al., 2017). Prior to implantation, each array scaffold was loaded with 16–24 independently movable micro-drives carrying 12.5 μm nichrome (California Fine Wire Company) tetrodes. Electrodes were pinned to custom-designed 96- or 128-channel electrode interface boards (EIB, Sunstone Circuits) along with a common reference wire (A-M systems). For surgical implantation, after the preparation procedure similar to that of virus injection, an incision in the skin allowed access to the skull. Two ~1.2 x 1.6 mm craniotomies were drilled centered at (in mm from Bregma) AP −1.2, ML ±0.5. The dura was carefully removed, and the drive implant was lowered into the craniotomy using a stereotactic arm until the shortest tetrodes touched the cortical surface. Surgilube (Savage Laboratories) was applied around electrodes to guard against fixation through dental cement. Stainless-steel screws were implanted into the skull to provide electrical and mechanical stability and the entire array was secured to the skull using dental cement. The skin was subsequently closed with Vetbond and the animal was allowed to recover on a heating blanket.
For electrophysiological recordings and spike sorting, signals were acquired using a Neuralynx multiplexing digital recording system (Neuralynx) through a combination of 32- and 64-channel digital multiplexing head stages plugged into the EIB of the implant. Signals from each electrode were amplified, filtered between 0.1 Hz and 9 kHz, and digitized at 30 kHz. Spike sorting was done automatically using MountainSort. Following sorting each cluster was manually inspected for quality. Clusters with spike waveforms that were symmetrical around their peak, indicative of an electrical noise signal, or showed inter-spike interval (ISI) distributions with more than 1% spikes <1ms, indication of potential noise or multi-unit contamination, were excluded.
For analysis of firing rate, changes in firing rate associated with optical stimulation were assessed using peri-stimulus time histograms (PSTHs). PSTHs were computed using a 1-ms bin width for individual neurons in each recording session convolved with a Gaussian kernel (30 ms variance) to create a spike density function (SDF) and the difference between baseline (200ms before laser) and during laser was computed.
c-fos expression under dark and ambient light
For checking the c-fos expression in dark, mice were taken from the animal facility before the light on and perfused under the red light with PBS and 4% PFA. For checking the c-fos expression in laboratory ambient light, mice were taken from the animal facility 4 hours after the light on and perfused with PBS and 4% PFA. Brains were dissected out and sliced in 50pm-thickness slices with vibratome (Leica VT1000S). The light intensity was measured using light meter (Fisher Scientific). We used c-fos antibody (Cell Signaling Technology, #2250 1:500) to perform the immunostaining and images were taken using confocal microscope (FV1000, Olympus).
Histology, immunohistochemistry, and microscopy
Mice were deeply anesthetized with isoflurane and transcardially perfused with cold phosphate-buffered saline (PBS), followed by ice-cold 4% paraformaldehyde (PFA; Sigma) in PBS. Brains were removed and submerged in 4% PFA at 4°C overnight for post-fixation. Brains were sectioned using a vibratome (Leica VT100S) or transferred to 30% sucrose to equilibrate for sectioning with a cryostat microtome (Lecia CM1950, Germany). 60-100 μm sections were obtained. For immunostaining of PV, RFP, 2A peptide, c-Fos and lba-1, free-floating sections were sequentially washed with PBS, 0.5% Triton-100 in PBS (2 h at room temperature), and blocking solution (0.2% Triton-100, 5% Bovine serum albumin, and 15% normal goat serum in PBS, 1 h at room temperature). Sections were then incubated in primary antiserum (rabbit anti-c-Fos, 1:1000, SC-52, Santa Cruz Biotechnology; rabbit anti-RFP, 1:1000, 600-401-379, Rockland; rabbit anti-PV, 1:5000, PV-27, Swant; rabbit anti-lba-1, 1:1000, LAP0868, Wako; rabbit anti-2A peptide, 1:1000, ABS31, Millipore) diluted in blocking solution for 12-48 hours. After washing 3 times with 0.2% Triton in PBS, the sections were incubated with secondary antibodies (Alexa Fluor 647 or 555 goat anti-rabbit, both 1:500, Invitrogen) overnight at 4 °C. Slices were then washed with 0.3 μmol DAPI in PBS for 20 min, twice with 0.1% Tween-20 in PBS for 15 min, and once with PBS for 20 min. For immunostaining of ChAT (choline acetyltransferase), the above procedure was followed, except that PBS was replaced with 0.1M Tris (PH = 7.6). The primary antibody was goat anti-ChAT (1:200, AB144p, Millipore) and the secondary antibody was Alexa Fluor 647 donkey anti-goat (1:500, Invitrogen). Donkey serum was used instead of goat serum. After staining, sections were mounted with Fluoro-Gel mounting medium with Tris buffer (50-247-04, Electron Microscopy Sciences). Widefield epifluorescence images were capture by an Olympus BX61 microscope equipped with 4X, 10X, 20X, and 60X objectives, a PRIOR ProScan III motorized stage (Prior Scientific Instruments, UK) and CellSens Dimension 1.11 stitching software (Olympus). For the PV-tdTomato or ChAT-tdTomato co-expression analysis, sections from three mice were imaged using an Olympus Fluoview FV1000 confocal microscope with a 20X lens. The maximum projection of z-stacks of three high-power fields (approximately 200 cells per region) was counted manually with ImageJ(Schindelin et al., 2012).
For the optical stimulation-evoked c-Fos staining experiments in LH, mice were sacrificed 1.5 hr post blue light stimulation (60 s, 50 mW of 473 nm light delivered via a patch cable connected to a 473 nm diode-pumped solid-state (DPSS) laser, Ultralaser). To test whether the transcranial illuminations led to the activation in the visual system, the blue light transcranial illumination (60 s, 50 mW of 473 nm light delivered via a patch cable connected to a 473 nm DPSS laser, UltraLasers) was followed by an orange light transcranial illumination (100 s, 25 mW of 589 nm light delivered via the same patch cable with the laser end disconnected from the 473nm laser and reconnected to a 589 nm DPSS laser, UltraLasers) 10 minutes later. 1.5 hr later, the mice were sacrificed.
Brain samples were then subjected to c-Fos staining. Images taken were then overlaid with The Mouse Brain in Stereotaxic Coordinates (Paxinos and Franklin, 2004) to locate the LH, dLGN, or V1, and the c-Fos-positive neurons were manually counted by an individual experimenter blind to the experimental groups.
Feeding behavior assays
The day prior to testing, CaMKII::SOUL and control mice were placed on the food restriction schedule described above. On the test day, they were placed in a 16” X 16” arena with two 2.75” side hexagonal plastic cups placed in contralateral corners. One cup contained standard chow, while the other cup contained no food. Each cup’s location was randomized for each animal. Mice then were run through two consecutive sessions: 10 min post-activation session after blue light stimulation (60 s, 50 mW of 473 nm light delivered via a patch cable connected to a 473 nm DPSS laser, UltraLasers), and 10 min post-deactivation session after orange light illumination (100 s, 25 mW of 589 nm light delivered via the same patch cable with the laser end disconnected from the 473nm laser and reconnected to a 589 nm DPSS laser, UltraLasers) for a total of a 20 min session. Food intake was manually quantified by weighing the amount of food left in the food chamber before vs. after each session.
For blinding purposes, all mice used for behavioral experiments were given a unique numerical identifier. Images of the brain sections ± 0.5mm around the LH were taken and then were overlaid with The Mouse Brain in Stereotaxic Coordinates (Paxinos and Franklin, 2004) to locate the LH. Tdtomato fluorescence was used to determine the actual SOUL-expressing region. If the LHs did not have the tdTomato fluorescence or the observed tdTomato fluorescence was beyond the region of LH, mice were retroactively excluded from the data set.
Macaque Methods
Surgical procedures
All surgical procedures were performed in a surgery room with aseptic conditions and under general anesthesia. A titanium head post was surgically implanted and fixed to the skull with titanium screws. The head post served to fix the head position during electrophysiological recordings. After recovery was complete, a subsequent surgery was performed to implant two circular cranial chambers over both lateral prefrontal cortices at locations that allowed access to the cortical surface between the arcuate and principal sulci. The chambers (24 mm outer diameter, 19 mm inner diameter) were made of carbon peek and were designed to fit the curvature of the skull at the implantation sites. A circular craniotomy 24 mm in diameter was performed at the target site of each chamber. The chambers perimeters were sealed to the skull using C&B Metabond (Parkell) and fixed with cranial titanium screws and a margin of radiopaque bone cement (Zimmer Surgical, Inc.). The chamber on the left hemisphere had a height of 19 mm above the skull surface. The chamber on the right hemisphere had a height of 5 mm above the skull surface and was custom-designed to facilitate the performance of an initial durotomy and subsequent durotomies upon dura regrowth. A 10 mm tall screwable adaptor chamber was added to this chamber to allow mounting electrophysiological recording towers.
On the right hemisphere, we replaced the native dura with an artificial dura made of silicone (Shin-Etsu Inc.) and fabricated using a metallic mold. The hat-shaped dura consisted of a disc 28 mm in diameter and 450 μm thick topped by a ring 19 mm in diameter and 2.8 mm tall (Supplementary Fig. 6). The artificial dura was transparent, allowing daily visualization of the cortical surface as well as optical stimulation with a laser located outside the dura. Its self-sealing properties prevented the dura from ripping during penetration with electrophysiological probes and with 31G needles during virus injections.
The artificial dura was implanted during the same surgery as the chambers. After the craniotomy and before chamber implantation, a durotomy 19 mm in diameter was performed on the right side. The artificial dura was then implanted so that its outer edge was under the native dura around the entire circumference of the durotomy. The chamber was subsequently implanted so that the ring-like portion of the artificial dura sat against the inner wall of the chamber. The artificial dura methods and materials were partially based on those reported in Ruiz et al., 2013 (Ruiz et al., 2013).
Anatomical localization of recording sites
We fabricated plastic grids with 500 μm holes separated by 1 mm. Each grid fit inside each chamber in one orientation. The grid holes served to guide the location of virus injection needles and electrophysiological probes. After cranial implantation, the holes were filled with a solution of 1% Agarose and 0.5% Gadolinium – a contrast agent used to increase the visibility of the grid holes in the MRI scan. The plastic grids were then placed inside the two implanted chambers and an MRI scan was performed. In the resulting images, we then projected the trajectory of each grid hole until it intersected the cortex. This allowed us to determine the cortical location of virus injections and electrophysiological recordings corresponding to each grid hole.
Virus injections
For macaque experiments, we used plasmids for AAV2/9 viruses encoding hSyn-SOUL-p2A-tdTomato, produced by Boston Children’s Hospital Viral Core. The titer was 5×10¹³ genome copies per mL (gc/mL). Virus injections were made with a 31G needle with its shank embedded into a 23G needle for reinforcement. The needle was mounted on a microdrive tower (NAN Instruments) and was connected to a 100 μm Hamilton syringe via a polyethylene tube. The syringe was mounted on a syringe pump (Harvard Apparatus). After sealing and gluing the syringe, tube and needle, these were backloaded with silicone oil (Sigma) up to the needle tip until no air bubbles were present. Virus injections were performed in a surgery room with aseptic conditions and under general anesthesia. Once the animal was prepared for injections and mounted on a stereotaxic machine, the virus was removed from an ice box, thawed and loaded into the syringe from the needle tip. Injections were made at 3 penetration locations in the left lateral prefrontal cortex, at the dorsal lip of the principal sulcus. At each penetration location, we inserted the needle 6mm below the dura surface, and injected a total of 7.2 μL at a rate of 1 μL/min at steps of 1.6 or 0.8 μL, retrieving the needle at steps of 1 or 0.5 mm, respectively. This resulted in a total of 21.6 μL injected over 42 sites across all 3 penetrations. On the same day, an equivalent procedure was also performed on the right lateral prefrontal cortex through the artificial dura. On subsequent days, the animal was brought to the lab for chamber cleaning and maintenance. To determine the onset and state of virus expression over time, we monitored tdTomato fluorescence by illuminating the cortex on the artificial dura chamber with green light (510-540 nm) and visualizing and registering images of the cortical surface through a 600 nm long-pass glass filter (Supplementary Fig. 6). The extent of expression on the cortical surface was determined by thresholding the fluorescence image intensity. We then outlined the thresholded region and measured its surface area 28 mm2. We estimated the mean radius of expression by measuring distances between each injection location and the most proximal edge of the expression region, and averaged across the three locations. An estimate of the total expression volume in each prefrontal hemisphere (140 mm3) was obtained by calculating the volume inside a solid prism with the expression area as the base and the range of injection depths as the height.
Electrophysiological recordings
Electrophysiological signals were recorded from sites in the left lateral prefrontal cortex within the superficial cortical region where virus injections were performed. This region included locations with a maximum distance of 1 mm away from any of the 3 injection sites, ranging 2 mm along the rostral-caudal axis, and 2 mm along the dorsal-ventral axis. Signals were acquired with a 16 or 32-contact linear probe (V-probe, Plexon Inc.) with a distance of 150 or 100 μm between contacts, respectively. The probe was held and micromanipulated with a computer-controlled microdrive tower (NAN Instruments Ltd., Israel) and embedded in a 23G guide tube held by a manually-manipulated holder from the same tower. The guide tube was lowered until its tip penetrated the dura, and the probe was lowered through the guide tube into the cortex. In a few sessions, the same procedure was performed on the right lateral prefrontal cortex, where the artificial dura was implanted. In these sessions, we used a blunt guide tube and lowered it until it touched the artificial dura; the probe was then lowered through the guide tube to penetrate the artificial dura before being lowered into the cortex.
In each recording session, the monkey sat in a custom non-human primate plexiglass chair and, at the lab, was head-fixed to the chair with a head post holder. The microdrive tower was affixed to the monkey’s chamber. The guide tube was first lowered to perforate the dura, and the probe was then lowered through the guide tube into the cortex until clear neuronal spike waveforms were observed in the electrophysiological signals of several probe contacts. The cortical depth of each contact was estimated based on the distance of that contact to the probe tip and on the penetration depth of the probe tip, accounting for the dura thickness (Galashan et al., 2011). The depth of all contacts across all recorded sessions ranged up to 5.6 mm from the cortical surface. Once the probe was positioned, a step-index optical fiber (Thorlabs Inc., 0.2 mm diameter, 0.22 numerical aperture) held by a separate microdrive tower was placed with its tip between 4 and 10 mm above the cortical surface so that the laser would illuminate a region between 1.8 and 4.4 mm in diameter encompassing the recording site (surface area between 2.43 and 15.5 mm2). Notice that this region was smaller than the total region of opsin expression. The fiber was connected interchangeably to two DPSS lasers (blue, 473nm; orange, 589nm). Across sessions, the laser light power density at the dura surface was varied between 12 and 173 mW/mm2 (mean of 94 mW/mm2; mean total power of 558 mW). Within this range, there was no relationship between the power density in each session and the resulting percentage of significantly modulated units. Once the optical fiber and probe were positioned, the bottom half of the chamber was filled with saline. This helped buffer the temperature at the dura surface during light stimulation. The top of the chamber was completely sealed with a film of black electrical tape, which ensured that no laser light escaped the chamber.
Each recording lasted approximately 60 to 80 minutes and consisted of 16 to 22 consecutive trials of 3.5 minutes each. In each trial, we recorded 30 s of baseline activity and then delivered 10 s of blue light; after an interval of 2 min (post-blue period), we delivered 20 s of orange light, after which we recorded for an additional 30 s before the next trial (post-orange period). Both colors of light were delivered through the same fiber. To accomplish this, the optical fiber end connected to the laser was quickly switched between the blue and orange lasers during the periods between stimulation of each trial. Electrophysiological signals were digitized by a digital head stage, amplified by a Front-End Amplifier and received and saved by a Cerebus Neural Signal Processor (Blackrock Microsystems). The voltage signals from each probe contact were high-pass filtered at 250 Hz, and then thresholded in order to extract spike waveforms. The waveforms were then sorted into multiunits and single neurons using Plexon Offline Sorter software, and all spike timestamps were obtained for each unit. To extract local field potential, the signals were sampled at 1 kHz and low-pass filtered at 250 Hz.
To measure potential temperature changes inside the cortex due to light stimulation through the native dura, we implanted a hypodermic needle probe (Omega Engineering, Inc.) into lateral prefrontal cortex through a guide tube, as with the electrophysiological probe. We replicated the light stimulation paradigm used in the neuronal recording sessions and acquired temperature measurements over time with 1 Hz sampling using a Digi-Sense thermocouple thermometer (Cole Parmer Instrument Company). Measurements were repeated with the temperature probe placed at different depths between the surface and 3 mm inside the cortex.
Data analysis
For each single unit and multiunit recorded, we used the spike timestamps to compute the mean firing rate in each 1-s time bin over each entire trial and averaged the time course across trials (Fig. 6b,d). For each of the five trial periods (baseline, blue laser, post-blue, orange laser and post-orange), we computed the mean firing rate across the period in each trial, as well as the mean across trials. To assess whether each unit’s firing rate was significantly modulated in the post-blue period, we subdivided this period into three 40 s sub-periods and used paired-sample t-tests to compare the firing rate between baseline and each sub-period. Units were then classified by the duration of the effect based on the number of 40 s sub-periods with a significant modulation (Fig. 6i). For significantly modulated units, we then tested whether the firing rate was restored to baseline levels following orange light stimulation by comparing the mean firing rates in the post-orange and baseline periods using paired-sample t-tests.
For each modulated unit, we measured the optogenetic modulation magnitude M (Fig. 6g) as the percent change in firing rate from baseline: M = (FRPB − FRBA) / FRBA , where FRBA is the firing rates in the baseline period and FRPB is the mean firing rate across all significant post-blue sub-periods. We then estimated the latency of the modulation (Fig. 6h) by performing the following analysis on each modulated unit: we first calculated the mean firing rate across trials for each 5-ms time bin, and computed the standard deviation across all 6000 time bins of the baseline period (SDBA); the latency was estimated as the time between blue laser onset and the earliest occurrence of 2 consecutive time bins with firing rate exceeding 3 * SDBA.
Local Field Potentials (LFPs) were analyzed to determine whether oscillatory activity was modulated by SOUL activation. For each individual channel (corresponding to a recording contact in the probe), we computed a time-frequency decomposition using the Fieldtrip data analysis toolbox (Oostenveld et al., 2011). We used the multitaper method (option ‘mtconvol’) with 4 Hz spectral smoothing to estimate power in 1 Hz intervals from 1 to 250 Hz and at non-overlapping 1 second time intervals. We calculated power from 30 seconds prior to blue laser onset to 27 seconds after the orange laser offset. Each window of analysis consisted of 1 second of data, giving a frequency resolution of 1 Hz. Two sessions were excluded from further analysis due to excessive high frequency noise, giving a total of 160 channels for LFP analysis.
For each individual trial, we normalized the power during all trial periods by the power in the baseline period of that trial. This provided a measure of the percentage change in power elicited by the laser with respect to baseline. For each channel, we then assessed whether there was significant power modulation by using a non-parametric cluster-based randomization test (Maris and Oostenveld, 2006). We addressed the null hypothesis that power in the baseline and power in the laser and post-laser periods (hereafter referred to as the “activation” time period) were the same. To this end, we randomly exchanged time-frequency power estimates between the baseline and activation periods, and for each randomization, calculated percent power change over time with respect to baseline. Therefore, the variable that was randomized was whether a power estimate at a given time and frequency occurred during the activation (laser and post-laser) time period vs. the pre-laser baseline. We extracted the largest cluster (continuous tiles in time-frequency space) to pass a first level significance threshold of 20% increase in power from baseline. We performed this randomization 10,000 times. The empirically observed clusters that deviated by 20% or more power were compared to this randomization distribution to assess significance at α = 0.05, adjusted for multiple comparisons across channels (N = 160).
There was large heterogeneity of effects across channels in our dataset, which precluded a meaningful average of the time-frequency power modulation. Instead, we assessed significance on an individual channel level, and therefore conducted 160 independent statistical tests (10 sessions x 16 channels per probe). We used a two-sided test, considering a priori that activation could either cause increases or decreases in power from baseline. Therefore, to determine significance, we used a corrected p-value of 0.05/(160 channels * 2 for increases/decreases).
Once we determined significance on a per-channel level, we then used this to calculate the percentage of significantly modulated channels as a function of frequency (Fig. 7d – after smoothing the spectrum +/− 7 Hz). The result revealed peaks at several frenquencies. We used the Matlab function findpeaks to determine the center and widths for these peaks. We considered only peaks with a peak height above the mean of the probability spectrum in the 180-250 Hz range, a range which we assumed contained no oscillatory structure. This revealed 4 peak frequency bands, which we have labeled as alpha/theta, and gamma 1-3. The center frequency and full width at half the peak height were used for the subsequent analyses (Fig. 7e–g). For each of the 4 bands, the magnitude of optogenetic modulation of power was calculated by averaging the baseline normalized power spectrum over all frequencies comprising each band; we then computed the magnitude mean and standard error across all channels (Fig. 7e). Power modulation latency (Fig. 7f) was calculated by taking, for each channel where power was significantly modulated at a particular band, the first time point of the significant time-frequency cluster (provided that cluster contained the respective frequency band). For each channel with significant modulation at a particular frequency, the duration of power modulation (Fig. 7g) was assessed by taking the total duration of the significant time-frequency cluster. For latency and duration, mean and SEM was calculated across all channels having a significant effect in the frequency band of interest.
Quantification and Statistical Analysis
The number of biological replicates in mouse experiments in each group was 7-36 neurons per group for in vitro and ex vivo electrophysiology; 31-36 neurons per group from 2 mice for in vivo recording; 3-5 mice per group for immunohistology; and 4 mice per group for behavior. For macaque experiments in this study, the number of biological replicates was 128-215 units and 176 channels for LFP from one macaque. These numbers were based on previously published studies (Anikeeva et al., 2012; Diester et al., 2011). All statistics were performed in Graph Pad Prism (GraphPad Software, Inc.), unless otherwise indicated. Paired t-test, unpaired t-test, one-way ANOVA, two-way ANOVA, Wilcoxon Signed Rank Tests and cluster-based randomization test were used when appropriate. Bonferroni post hoc comparisons was conducted to detect significant main effects or interactions. In all statistical measures a P value <0.05 was considered statistically significant and it was set as *P< 0.05, **P< 0.01, ***P< 0.001 and ****P< 0.0001; all statistical tests used are indicated in the figure legends.
Supplementary Material
Supplementary Materials:
Supplementary Figure 1. Basic electrical properties of SOUL-expressing cultured neurons and diagram of SOUL knock-in vector, related to Figure 1
Supplementary Figure 2. Brain section images from Cre crosses of SOUL knock-in mice, related to Figure 2
Supplementary Figure 3. Comparison of SOUL and SSFO in vivo, related to Figure 3
Supplementary Figure 4: Ambient room light does not activate neurons in the intact brain, related to Figure 3
Supplementary Figure 5: Effects of SOUL on the visual system, related to Figure 4
Supplementary Figure 6. Modulation of SOUL-expressing neurons in macaque brain, related to Figure 6
Supplementary Figure 7. Temperature measurements during light stimulation, related to Figure 6
Supplementary Table 1: Co-localization of tdTomato and cell markers (PV or ChAT) in PV-Cre:SOUL and ChAT-Cre:SOUL mice, related to Figure 2
KEY RESOURCES TABLE
| REAGENT or RESOURCE | SOURCE | IDENTIFIER |
|---|---|---|
| Antibodies | ||
| Rabbit anti-c-Fos | Santa Cruz Biotechnology | Cat. No. SC-52 RRID:AB_210678 |
| Rabbit anti-c-Fos | Synaptic Systems | Cat. No. 226 003 RRID:AB_2231974 |
| Rabbit anti-RFP | Rockland Immunochemicals, Inc | Cat. No. 600-401-379 RRID:AB_2209751 |
| Rabbit anti-Parvalbumin | Swant, Inc | Cat. No. PV 27 RRID:AB_2631173 |
| Rabbit anti-lba-1 | FUJIFILM Wako Pure Chemical Corporation | Cat. No. LAP0868 |
| Rabbit anti-2A peptide | Millipore | Cat. No. ABS31 RRID:AB_11214282 |
| Goat anti-ChAT | Millipore | Cat. No. AB144p RRID:AB_2079751 |
| Goat anti-Rabbit IgG (H+L) Cross-Adsorbed Secondary Antibody, Alexa Fluor 647 | ThermoFisher | Cat. No. A-21244 RRID:AB_2535812 |
| Goat anti-Rabbit IgG (H+L) Cross-Adsorbed Secondary Antibody, Alexa Fluor 555 | ThermoFisher | Cat. No. A-21428 RRID:AB_2535849 |
| Donkey anti-Goat IgG (H+L) Cross-Adsorbed Secondary Antibody, Alexa Fluor 647 | ThermoFisher | Cat. No. A-21447 RRID:AB_2535864 |
| Bacterial and Virus Strains | ||
| AAV2/1-hSyn-SSFO-P2A-tdTomato | Boston Children’s Hospital Viral Core | N/A |
| AAV2/1-hSyn-SOUL-P2A-tdTomato | Boston Children’s Hospital Viral Core | N/A |
| AAV2/9-hSyn-SSFO-P2A-tdTomato | Boston Children’s Hospital Viral Core | N/A |
| AAV2/9-hSyn-SOUL-P2A-tdTomato | Boston Children’s Hospital Viral Core | N/A |
| AAV2/9-hSyn-Cre | Penn Vector Core | AV-9-PV2676 |
| AAV2/9-EF1a-DIO-mCherry-WPRE | Boston Children’s Hospital Viral Core | N/A |
| AAV2/9-CamKII0.4-Cre | Penn Vector Core | AV-9-PV2396 |
| Biological Samples | ||
| Chemicals, Peptides, and Recombinant Proteins | ||
| Critical Commercial Assays | ||
| Deposited Data | ||
| Experimental Models: Cell Lines | ||
| Experimental Models: Organisms/Strains | ||
| C57BL/6J mice | The Jackson Laboratory | Stock no. 000664 RRID:IMSR_JAX:000664 |
| R26-LSL-SOUL-P2A-tdT mice | This manuscript | JAX Stock No. 032301 |
| Parvalbumin-IRES-Cre mice | The Jackson Laboratory | Stock No. 017320 |
| Drd1a-Cre | GENSAT BAC transgenic EY217 | N/A |
| ChAT-IRES-Cre driver mice | The Jackson Laboratory | Stock No. 006410 |
| Rhesus macaque (macaca mulatta) | University of Louisiana at Lafayette - New Iberia Research Center | 98X012 |
| Oligonucleotides | ||
| Recombinant DNA | ||
| Software and Algorithms | ||
| GraphPad Prism 8.0 | GraphPad Software Inc | http://www.graphpad.com/scien-tific-software/prism/ |
| MATLAB R2014a | The MathWorks, Inc. | http://ch.mathworks.com/products/matlab |
| pClamp 10 | Axon instruments | https://www.molecularde-vices.com/ |
| Clampex 10.7 | Molecular Devices | https://www.moleculardevices.com |
| Blackrock Central Software Suite | Blackrock Microsystems | https://www.blackrockmicro.com/ |
| Offline Sorter V4 | Plexon Inc | http://www.plexon.com/ |
| Observer XT | Noldus | https://www.noldus.com |
| Adobe Illustrator 2020 | Adobe Systems Inc | https://www.adobe.com/ |
| Olympus Fluoview Ver3.1b | Olympus | https://www.olympus-lifescience.com/en/ |
| Olympus CellSens Dimension | Olympus | https://www.olympus-lifescience.com/en/ |
| Neuralynx | Neuralynx | https://neuralynx.com |
| ImageJ | NIH | https://imagej.nih.gov/ij/ |
| Other | ||
Highlights:
We introduce SOUL, a new step-function opsin with ultra-high light sensitivity
SOUL activates deep mouse brain and change behaviors via transcranial illumination
SOUL activates macaque cortical neurons via illumination through the dura
Transdural activation of SOUL in macaques induces oscillatory activity reversibly
ACKNOWLEDGMENTS
We thank Diya Malhotra for the support in culture maintenance and viral infection. We thank Shen Lin for the help with pilot in vivo recording experiments. We thank Morgan Fleishman for mouse colony management. We thank Dheeraj Roy and Jonathan Wilde for editing and commenting on the manuscript. This work was supported by the Hock E. Tan and K. Lisa Yang Center for Autism Research at MIT, the James and Patricia Poitras Center for Psychiatric Disorders Research at MIT, Simons Center for the Social Brain at MIT, the Stanley Center for Psychiatric Research at the Broad Institute of MIT and Harvard, and NIH/NINDS R01 NS110075 (to G.F and M.M.H). X.G. was supported by a Graduate Fellowship from China Scholarship Council and the Stanley Center for Psychiatric Research at Broad Institute of MIT and Harvard.
Footnotes
Publisher's Disclaimer: This is a PDF file of an unedited manuscript that has been accepted for publication. As a service to our customers we are providing this early version of the manuscript. The manuscript will undergo copyediting, typesetting, and review of the resulting proof before it is published in its final form. Please note that during the production process errors may be discovered which could affect the content, and all legal disclaimers that apply to the journal pertain.
DECLARATION OF INTERESTS
The Broad Institute of MIT and Harvard and the authors are submitting a patent application related to this work.
REFERENCES
- Acker L, Pino EN, Boyden ES, and Desimone R (2016). FEF inactivation with improved optogenetic methods. P Natl Acad Sci USA 113, E7297–E7306. [DOI] [PMC free article] [PubMed] [Google Scholar]
- Alexander GM, Rogan SC, Abbas AI, Armbruster BN, Pei Y, Allen JA, Nonneman RJ, Hartmann J, Moy SS, Nicolelis MA, et al. (2009). Remote Control of Neuronal Activity in Transgenic Mice Expressing Evolved G Protein-Coupled Receptors. Neuron 63, 27–39. [DOI] [PMC free article] [PubMed] [Google Scholar]
- Anikeeva P, Andalman AS, Witten I, Warden M, Goshen I, Grosenick L, Gunaydin LA, Frank LM, and Deisseroth K (2012). Optetrode: a multichannel readout for optogenetic control in freely moving mice. Nature neuroscience 15, 163–U204. [DOI] [PMC free article] [PubMed] [Google Scholar]
- Aravanis AM, Wang LP, Zhang F, Meltzer LA, Mogri MZ, Schneider MB, and Deisseroth K (2007). An optical neural interface: in vivo control of rodent motor cortex with integrated fiberoptic and optogenetic technology. Journal of Neural Engineering 4, S143–S156. [DOI] [PubMed] [Google Scholar]
- Armbruster BN, Li X, Pausch MH, Herlitze S, and Roth BL (2007). Evolving the lock to fit the key to create a family of G protein-coupled receptors potently activated by an inert ligand. P Natl Acad Sci USA 104, 5163–5168. [DOI] [PMC free article] [PubMed] [Google Scholar]
- Bergs A, Schultheis C, Fischer E, Tsunoda SP, Erbguth K, Husson SJ, Govorunova E, Spudich JL, Nagel G, Gottschalk A, and Liewald JF (2018). Rhodopsin optogenetic toolbox v2.0 for light-sensitive excitation and inhibition in Caenorhabditis elegans. Plos One 13. [DOI] [PMC free article] [PubMed] [Google Scholar]
- Berndt A, Schoenenberger P, Mattis J, Tye KM, Deisseroth K, Hegemann P, and Oertner TG (2011). High-efficiency channelrhodopsins for fast neuronal stimulation at low light levels. P Natl Acad Sci USA 108, 7595–7600. [DOI] [PMC free article] [PubMed] [Google Scholar]
- Berndt A, Yizhar O, Gunaydin LA, Hegemann P, and Deisseroth K (2009). Bi-stable neural state switches. Nature Neuroscience 12, 229–234. [DOI] [PubMed] [Google Scholar]
- Boyden ES, Zhang F, Bamberg E, Nagel G, and Deisseroth K (2005). Millisecond-timescale, genetically targeted optical control of neural activity. Nature neuroscience 8, 1263–1268. [DOI] [PubMed] [Google Scholar]
- Brunetti PM, Wimmer RD, Liang L, Siegle JH, Voigts J, Wilson M, and Halassa MM (2014). Design and Fabrication of Ultralight Weight, Adjustable Multi-electrode Probes for Electrophysiological Recordings in Mice. Jove-J Vis Exp. [DOI] [PMC free article] [PubMed] [Google Scholar]
- Cavanaugh J, Monosov IE, McAlonan K, Berman R, Smith MK, Cao V, Wang KH, Boyden ES, and Wurtz RH (2012). Optogenetic inactivation modifies monkey visuomotor behavior. Neuron 76, 901–907. [DOI] [PMC free article] [PubMed] [Google Scholar]
- Chen S, Weitemier AZ, Zeng X, He LM, Wang XY, Tao YQ, Huang AJY, Hashimotodani Y, Kano M, Iwasaki Hv et al. (2018). Near-infrared deep brain stimulation via upconversion nanoparticle-mediated optogenetics. Science 359, 679–683. [DOI] [PubMed] [Google Scholar]
- Cheng MY, Wang EH, Woodson WJ, Wang S, Sun GH, Lee AG, Arac A, Fenno LE, Deisseroth K, and Steinberg GK (2014). Optogenetic neuronal stimulation promotes functional recovery after stroke. P Natl Acad Sci USA 111, 12913–12918. [DOI] [PMC free article] [PubMed] [Google Scholar]
- Chow BY, Han X, Dobry AS, Qian X, Chuong AS, Li M, Henninger MA, Belfort GM, Lin Y, Monahan PE, and Boyden ES (2010). High-performance genetically targetable optical neural silencing by light-driven proton pumps. Nature 463, 98–102. [DOI] [PMC free article] [PubMed] [Google Scholar]
- Chuong AS, Miri ML, Busskamp V, Matthews GAC, Acker LC, Sorensen AT, Young A, Klapoetke NC, Henninger MA, Kodandaramaiah SB, et al. (2014). Noninvasive optical inhibition with a red-shifted microbial rhodopsin. Nature neuroscience 17, 1123–1129. [DOI] [PMC free article] [PubMed] [Google Scholar]
- Dawydow A, Gueta R, Ljaschenko D, Ullrich S, Hermann M, Ehmann N, Gao S, Fiala A, Langenhan T, Nagel G, and Kittel RJ (2014). Channelrhodopsin-2-XXL, a powerful optogenetic tool for low-light applications. Proc Natl Acad Sci U S A 111, 13972–13977. [DOI] [PMC free article] [PubMed] [Google Scholar]
- Diester I, Kaufman MT, Mogri M, Pashaie R, Goo W, Yizhar O, Ramakrishnan C, Deisseroth K, and Shenoy KV (2011). An optogenetic toolbox designed for primates. Nature neuroscience 14, 387–397. [DOI] [PMC free article] [PubMed] [Google Scholar]
- Dzirasa K, and Lisanby SH (2012). How does deep brain stimulation work? Biol Psychiatry 72, 892–894. [DOI] [PubMed] [Google Scholar]
- Dzirasa K, Santos LM, Ribeiro S, Stapleton J, Gainetdinov RR, Caron MG, and Nicolelis MA (2009). Persistent hyperdopaminergia decreases the peak frequency of hippocampal theta oscillations during quiet waking and REM sleep. Plos One 4, e5238. [DOI] [PMC free article] [PubMed] [Google Scholar]
- El-Shamayleh Y, Kojima Y, Soetedjo R, and Horwitz GD (2017). Selective Optogenetic Control of Purkinje Cells in Monkey Cerebellum. Neuron 95, 51–62 e54. [DOI] [PMC free article] [PubMed] [Google Scholar]
- Frederic G, Alexander RH, and Robert MIK (2014). Controlling Brain Cells With Light: Ethical Considerations for Optogenetic Clinical Trials. AJOB Neuroscience, 3–11. [Google Scholar]
- Fries P (2015). Rhythms for Cognition: Communication through Coherence. Neuron 88, 220–235. [DOI] [PMC free article] [PubMed] [Google Scholar]
- Frostig RD, Lieke EE, Tso DY, and Grinvald A (1990). Cortical Functional Architecture and Local Coupling between Neuronal-Activity and the Microcirculation Revealed by Invivo High-Resolution Optical Imaging of Intrinsic Signals. P Natl Acad Sci USA 87, 6082–6086. [DOI] [PMC free article] [PubMed] [Google Scholar]
- Galvan A, Caiola MJ, and Albaugh DL (2017). Advances in optogenetic and chemogenetic methods to study brain circuits in non-human primates. J Neural Transm (Vienna). [DOI] [PMC free article] [PubMed] [Google Scholar]
- Gerits A, and Vanduffel W (2013). Optogenetics in primates: a shining future? Trends Genet 29, 403–411. [DOI] [PubMed] [Google Scholar]
- Gradinaru V, Mogri M, Thompson KR, Henderson JM, and Deisseroth K (2009). Optical Deconstruction of Parkinsonian Neural Circuitry. Science 324, 354–359. [DOI] [PMC free article] [PubMed] [Google Scholar]
- Han X, Qian XF, Bernstein JG, Zhou HH, Franzesi GT, Stern P, Bronson RT, Graybiel AM, Desimone R, and Boyden ES (2009). Millisecond-Timescale Optical Control of Neural Dynamics in the Nonhuman Primate Brain. Neuron 62, 191–198. [DOI] [PMC free article] [PubMed] [Google Scholar]
- Hauss-Wegrzyniak B, Lynch MA, Vraniak PD, and Wenk GL (2002). Chronic brain inflammation results in cell loss in the entorhinal cortex and impaired LTP in perforant path-granule cell synapses. Exp Neurol 176, 336–341. [DOI] [PubMed] [Google Scholar]
- Hippenmeyer S, Vrieseling E, Sigrist M, Portmann T, Laengle C, Ladle DR, and Arber S (2005). A developmental switch in the response of DRG neurons to ETS transcription factor signaling. Plos Biol 3, 878–890. [DOI] [PMC free article] [PubMed] [Google Scholar]
- Hira R, Honkura N, Noguchi J, Maruyama Y, Augustine GJ, Kasai H, and Matsuzaki M (2009). Transcranial optogenetic stimulation for functional mapping of the motor cortex. Journal of Neuroscience Methods 179, 258–263. [DOI] [PubMed] [Google Scholar]
- Hososhima S, Sakai S, Ishizuka T, and Yawo H (2015). Kinetic Evaluation of Photosensitivity in Bi-Stable Variants of Chimeric Channelrhodopsins. Plos One 10. [DOI] [PMC free article] [PubMed] [Google Scholar]
- Iaccarino HF, Singer AC, Martorell AJ, Rudenko A, Gao F, Gillingham TZ, Mathys H, Seo J, Kritskiy O, Abdurrob Fv et al. (2016). Gamma frequency entrainment attenuates amyloid load and modifies microglia. Nature 540, 230-+. [DOI] [PMC free article] [PubMed] [Google Scholar]
- Jennings JH, Rizzi G, Stamatakis AM, Ung RL, and Stuber GD (2013). The inhibitory circuit architecture of the lateral hypothalamus orchestrates feeding. Science 341, 1517–1521. [DOI] [PMC free article] [PubMed] [Google Scholar]
- Kim JH, Lee SR, Li LH, Park HJ, Park JH, Lee KY, Kim MK, Shin BA, and Choi SY (2011). High cleavage efficiency of a 2A peptide derived from porcine teschovirus-1 in human cell lines, zebrafish and mice. Plos One 6, e18556. [DOI] [PMC free article] [PubMed] [Google Scholar]
- Klapoetke NC, Murata Y, Kim SS, Pulver SR, Birdsey-Benson A, Cho YK, Morimoto TK, Chuong AS, Carpenter EJ, Tian ZJ, et al. (2014). Independent optical excitation of distinct neural populations. Nature Methods 11, 338–U333. [DOI] [PMC free article] [PubMed] [Google Scholar]
- Kleinlogel S, Feldbauer K, Dempski RE, Fotis H, Wood PG, Bamann C, and Bamberg E (2011). Ultra light-sensitive and fast neuronal activation with the Ca(2)+-permeable channelrhodopsin CatCh. Nature neuroscience 14, 513–518. [DOI] [PubMed] [Google Scholar]
- Kreutzberg GW (1996). Microglia: a sensor for pathological events in the CNS. Trends Neurosci 19, 312–318. [DOI] [PubMed] [Google Scholar]
- Liang L, Oline SN, Kirk JC, Schmitt LI, Komorowski RW, Remondes M, and Halassa MM (2017). Scalable, Lightweight, Integrated and Quick-to-Assemble (SLIQ) Hyperdrives for Functional Circuit Dissection. Front Neural Circuit 11. [DOI] [PMC free article] [PubMed] [Google Scholar]
- Lin JY, Knutsen PM, Muller A, Kleinfeld D, and Tsien RY (2013). ReaChR: a red-shifted variant of channelrhodopsin enables deep transcranial optogenetic excitation. Nature neuroscience 16, 1499-+. [DOI] [PMC free article] [PubMed] [Google Scholar]
- Lin JY, Lin MZ, Steinbach P, and Tsien RY (2009). Characterization of engineered channelrhodopsin variants with improved properties and kinetics. Biophys J 96, 1803–1814. [DOI] [PMC free article] [PubMed] [Google Scholar]
- Luo XG, and Chen SD (2012). The changing phenotype of microglia from homeostasis to disease. Transl Neurodegener 1, 9. [DOI] [PMC free article] [PubMed] [Google Scholar]
- Madisen L, Mao TY, Koch H, Zhuo JM, Berenyi A, Fujisawa S, Hsu YWA, Garcia AJ, Gu X, Zanella Sv et al. (2012). A toolbox of Cre-dependent optogenetic transgenic mice for light-induced activation and silencing. Nature neuroscience 15, 793–802. [DOI] [PMC free article] [PubMed] [Google Scholar]
- Maimon BE, Diaz M, Revol ECM, Schneider AM, Leaker B, Varela CE, Srinivasan S, Weber MB, and Herr HM (2018). Optogenetic Peripheral Nerve Immunogenicity. Sci Rep-Uk 8. [DOI] [PMC free article] [PubMed] [Google Scholar]
- Mattis J, Tye KM, Ferenczi EA, Ramakrishnan C, O’Shea DJ, Prakash R, Gunaydin LA, Hyun M, Fenno LE, Gradinaru V, et al. (2011). Principles for applying optogenetic tools derived from direct comparative analysis of microbial opsins. Nat Methods 9, 159–172. [DOI] [PMC free article] [PubMed] [Google Scholar]
- Nandy A, Nassi JJ, Jadi MP, and Reynolds J (2019). Optogenetically induced low-frequency correlations impair perception. Elife 8. [DOI] [PMC free article] [PubMed] [Google Scholar]
- Nassi JJ, Avery MC, Cetin AH, Roe AW, and Reynolds JH (2015). Optogenetic Activation of Normalization in Alert Macaque Visual Cortex. Neuron 86, 1504–1517. [DOI] [PMC free article] [PubMed] [Google Scholar]
- Nehme R, Zuccaro E, Ghosh SD, Li CC, Sherwood JL, Pietilainen O, Barrett LE, Limone F, Worringer KA, Kommineni Sv et al. (2018). Combining NGN2 Programming with Developmental Patterning Generates Human Excitatory Neurons with NMDAR-Mediated Synaptic Transmission. Cell Rep 23, 2509–2523. [DOI] [PMC free article] [PubMed] [Google Scholar]
- Paxinos G (2000). The rhesus monkey brain in stereotaxic coordinates / George Paxinos, Xu-Feng Huang, Arthur Toga (San Diego, Calif: Academic Press; ). [Google Scholar]
- Paxinos G, and Franklin KBJ (2004). The mouse brain in stereotaxic coordinates, Compact 2nd edn (Amsterdam ; Boston: Elsevier Academic Press; ). [Google Scholar]
- Polikov VS, Tresco PA, and Reichert WM (2005). Response of brain tissue to chronically implanted neural electrodes. J Neurosci Methods 148, 1–18. [DOI] [PubMed] [Google Scholar]
- Prakash R, Yizhar O, Grewe B, Ramakrishnan C, Wang N, Goshen I, Packer AM, Peterka DS, Yuste R, Schnitzer MJ, and Deisseroth K (2012). Two-photon optogenetic toolbox for fast inhibition, excitation and bistable modulation. Nature Methods 9, 1171–U1132. [DOI] [PMC free article] [PubMed] [Google Scholar]
- Rossi J, Balthasar N, Olson D, Scott M, Berglund E, Lee CE, Choi MJ, Lauzon D, Lowell BB, and Elmquist JK (2011). Melanocortin-4 Receptors Expressed by Cholinergic Neurons Regulate Energy Balance and Glucose Homeostasis. Cell Metab 13, 195–204. [DOI] [PMC free article] [PubMed] [Google Scholar]
- Ruiz O, Lustig BR, Nassi JJ, Cetin A, Reynolds JH, Albright TD, Callaway EM, Stoner GR, and Roe AW (2013). Optogenetics through windows on the brain in the nonhuman primate. J Neurophysiol 110, 1455–1467. [DOI] [PMC free article] [PubMed] [Google Scholar]
- Schaich Borg J, Srivastava S, Lin L, Heffner J, Dunson D, Dzirasa K, and de Lecea L (2017). Rat intersubjective decisions are encoded by frequency-specific oscillatory contexts. Brain Behav 7, e00710. [DOI] [PMC free article] [PubMed] [Google Scholar]
- Schiessl I, and McLoughlin N (2003). Optical imaging of the retinotopic organization of V1 in the common marmoset. Neuroimage 20, 1857–1864. [DOI] [PubMed] [Google Scholar]
- Schindelin J, Arganda-Carreras I, Frise E, Kaynig V, Longair M, Pietzsch T, Preibisch S, Rueden C, Saalfeld S, Schmid B, et al. (2012). Fiji: an open-source platform for biological-image analysis. Nature Methods 9, 676–682. [DOI] [PMC free article] [PubMed] [Google Scholar]
- Selimbeyoglu A, Kim CK, Inoue M, Lee SY, Hong ASO, Kauvar I, Ramakrishnan C, Fenno LE, Davidson TJ, Wright M, and Deisseroth K (2017). Modulation of prefrontal cortex excitation/inhibition balance rescues social behavior in CNTNAP2-deficient mice. Sci Transl Med 9. [DOI] [PMC free article] [PubMed] [Google Scholar]
- Sorokin JM, Davidson TJ, Frechette E, Abramian AM, Deisseroth K, Huguenard JR, and Paz JT (2017). Bidirectional Control of Generalized Epilepsy Networks via Rapid Real-Time Switching of Firing Mode. Neuron 93, 194–210. [DOI] [PMC free article] [PubMed] [Google Scholar]
- Szarowski DH, Andersen MD, Retterer S, Spence AJ, Isaacson M, Craighead HG, Turner JN, and Shain W (2003). Brain responses to micro-machined silicon devices. Brain Res 983, 23–35. [DOI] [PubMed] [Google Scholar]
- Tanaka KF, Matsui K, Sasaki T, Sano H, Sugio S, Fan K, Hen R, Nakai J, Yanagawa Y, Hasuwa Hv et al. (2012). Expanding the Repertoire of Optogenetically Targeted Cells with an Enhanced Gene Expression System. Cell Rep 2, 397–406. [DOI] [PubMed] [Google Scholar]
- Thyagarajan S, van Wyk M, Lehmann K, Lowel S, Feng G, and Wassle H (2010). Visual function in mice with photoreceptor degeneration and transgenic expression of channelrhodopsin 2 in ganglion cells. J Neurosci 30, 8745–8758. [DOI] [PMC free article] [PubMed] [Google Scholar]
- Ullrich S, Gueta R, and Nagel G (2013). Degradation of channelopsin-2 in the absence of retinal and degradation resistance in certain mutants. Biol Chem 394, 271–280. [DOI] [PubMed] [Google Scholar]
- Weaver FM, Follett KA, Stern M, Luo P, Harris CL, Hur K, Marks WJ, Rothlind J, Sagher O, Moy Cv et al. (2012). Randomized trial of deep brain stimulation for Parkinson disease Thirty-six-month outcomes. Neurology 79, 55–65. [DOI] [PMC free article] [PubMed] [Google Scholar]
- Williams JC, and Denison T (2013). From Optogenetic Technologies to Neuromodulation Therapies. Sci Transl Med 5. [DOI] [PubMed] [Google Scholar]
- Xu HT, Pan F, Yang G, and Gan WB (2007). Choice of cranial window type for in vivo imaging affects dendritic spine turnover in the cortex. Nature neuroscience 10, 549–551. [DOI] [PubMed] [Google Scholar]
- Yizhar O, Fenno LE, Davidson TJ, Mogri M, and Deisseroth K (2011a). Optogenetics in Neural Systems. Neuron 71, 9–34. [DOI] [PubMed] [Google Scholar]
- Yizhar O, Fenno LE, Prigge M, Schneider F, Davidson TJ, O’Shea DJ, Sohal VS, Goshen I, Finkelstein J, Paz JT, et al. (2011b). Neocortical excitation/inhibition balance in information processing and social dysfunction. Nature 477, 171–178. [DOI] [PMC free article] [PubMed] [Google Scholar]
- Zhao S, Ting JT, Atallah HE, Qiu L, Tan J, Gloss B, Augustine GJ, Deisseroth K, Luo M, Graybiel AM, and Feng G (2011). Cell type-specific channelrhodopsin-2 transgenic mice for optogenetic dissection of neural circuitry function. Nat Methods 8, 745–752. [DOI] [PMC free article] [PubMed] [Google Scholar]
- Zhao YJ, Yu TT, Zhang C, Li Z, Luo QM, Xu TH, and Zhu D (2018). Skull optical clearing window for in vivo imaging of the mouse cortex at synaptic resolution. Light-Sci Appl 7. [DOI] [PMC free article] [PubMed] [Google Scholar]
Associated Data
This section collects any data citations, data availability statements, or supplementary materials included in this article.
Supplementary Materials
Supplementary Materials:
Supplementary Figure 1. Basic electrical properties of SOUL-expressing cultured neurons and diagram of SOUL knock-in vector, related to Figure 1
Supplementary Figure 2. Brain section images from Cre crosses of SOUL knock-in mice, related to Figure 2
Supplementary Figure 3. Comparison of SOUL and SSFO in vivo, related to Figure 3
Supplementary Figure 4: Ambient room light does not activate neurons in the intact brain, related to Figure 3
Supplementary Figure 5: Effects of SOUL on the visual system, related to Figure 4
Supplementary Figure 6. Modulation of SOUL-expressing neurons in macaque brain, related to Figure 6
Supplementary Figure 7. Temperature measurements during light stimulation, related to Figure 6
Supplementary Table 1: Co-localization of tdTomato and cell markers (PV or ChAT) in PV-Cre:SOUL and ChAT-Cre:SOUL mice, related to Figure 2
Data Availability Statement
The custom written scripts supporting this study have not been deposited in a public repository because they require extensive user experience to navigate but are available from the corresponding author on request.