

Abstract
COVID-19 suddenly struck Wuhan at the end of 2019 and soon spread to the whole country and the rest of world in 2020. To mitigate the pandemic, China authority has taken unprecedentedly strict measures across the country. That provides a precious window to study how the air quality response to quick decline of anthropogenic emissions in terms of national scale, which would be critical basis to make atmospheric governance policies in the future. In this work, we utilized observations from both remote sensing and in-situ measurements to investigate impacts of COVID-19 lockdown on different air pollutions in different regions of China. It is witnessed that the PM2.5 concentrations exhibited distinct trends in different regions, despite of plunges of NO2 concentrations over the whole country. The steady HCHO concentration in urban area provides sufficient fuels for generations of tropospheric O3, leading to high concentrations of O3, especially when there is not enough NO to consume O3 via the titration effect. Moreover, the SO2 concentration kept steady at a low level regardless of cities. As a conclusion, the COVID-19 lockdown indeed helped reduce NO2 concentration. However, the atmospheric quality in urban areas of China has not improved overall due to lockdown measures. It underscores the significance of comprehensive control of atmospheric pollutants in cleaning air. Reducing VOCs (volatile organic compounds) concentrations in urban areas would be a critical mission for better air quality in the future.
Keywords: COVID-19, Air quality, PM2.5, Sentinel-5, O3
Graphical abstract

1. Introduction
In response to the COVID-19 (corona virus disease 2019) outbreak, the China central government has gradually implemented severe nationwide lockdown measures since the end of January 2020. These measures have put the society of China on hold, significantly reducing emissions of pollutants. The resultant dramatic changes in the atmospheric environments have been of great concern to scholars (Chen et al., 2020; Kerimray et al., 2020; Kraemer et al., 2020). In the past decade, China has experienced several social pauses including routine ones such as the Lunar New Year and special events such as the Olympic Games and G20. Whether spontaneous or obliged, these activities tend to lead to a weakening of production activities, providing special opportunities for atmospheric researches (Chan et al., 2015). For example, Wang et al. (2010) simulated daily mean concentrations of PM2.5 and found that more than 60% of the PM2.5 reductions during the Olympics were due to emissions controls. Yan et al. (2012) found that near-surface SO2 concentrations in the PRD region during the Asian Games were lower than in the same period in previous years using OMI data. Huang et al. (2015) found that the tropospheric NO2 concentration in North China Plain during APEC in 2014 was 47% lower than that in the same period of the previous 3 years; Li et al. (2016) found that the total PM1 mass was reduced by 52–57% during the 2015 China Victory Day Parade (V-day Parade) by excluding the effects of meteorological parameters. Compared with those events, the COVID-19 lockdown exerts much more evident influences on the society in terms of both persistence and strength. In order to ensure a good atmospheric environment during some major events, governments often required some factories to shut down and regulated traffic, but such initiatives are limited to a relatively small region, such as a city or a province, and usually last for from a few days to within half a month low level for over a month all across the country (Tian et al., 2020). The Chinese Lunar New Year holiday can lead to a weakening of the intensity of productive activity across the country. However, this social pause generally lasts only a week or less, while still allowing a significant portion of the factory to continue production and traffic tends not to decrease significantly, just to shift from large cities to small cities or rural areas (Guo et al., 2018). Very differently, the COVID-19 lockdown is believed to make both productive activities and traffic to a low level for over a month all across the country (Tian et al., 2020). As the epicenter of COVID-19, Wuhan didn't completely reopen until May 2020. Thus, COVID-19 was an all-human catastrophe, but the social pause it caused provided a valuable and unprecedented opportunity to study the baseline of the atmospheric environment and the effects of human activities on it from the scale of the whole country. Now, several studies have reported different responses of the air quality to the lockdown in different regions (Dantas et al., 2020; Mahato et al., 2020; Otmani et al., 2020; Sharma et al., 2020; Wang et al., 2020a). Those contradictory results underscored the importance of further studies into this area.
In this study, we focus on five representative indexes of air pollutions, namely, NO2, SO2, O3, HCHO, and PM2.5. The main aim of this work is to investigate how air pollutants response to the social pause caused by COVID-19 and to gain insight into the mechanism of generations of PM2.5. NO2 is seen as a direct index for describing the intensity of human activities because there are hardly natural emissions of NO2 (Lin and McElroy, 2011; Zhang et al., 2018). Actually, soon after the COVID-19 lockdown started, researchers observed a rapid decrease of atmospheric concentration of NO2 in both China and Italy (Bauwens et al., 2020). SO2 is a common index to describe industry emissions. Besides, during the pandemic, a rumor claimed that abnormal surge of SO2 concentrations suggested extra death polls were concealed circulated on social media. The formation of tropospheric ozone is relatively complex, influenced on the one hand by solar radiation and on the other by the concentration of other atmospheric pollutants (Wang et al., 2017). In recent years, there has been a general decrease in PM2.5 in China's major cities (Ding et al., 2019; Li et al., 2019; Zhang et al., 2019), but a certain increase in tropospheric O3 (Chan et al., 2017; Chan et al., 2018; Wang et al., 2020b). PM2.5 has a very large impact on visibility and is therefore more likely to be of public concern. However, O3 concentrations are difficult to draw attention of public, but are extremely harmful and therefore a new hotspot for atmospheric pollution research. HCHO is an important proxy for volatile organic compounds (VOC), which are of more and more concern in recent years (Chan et al., 2019).
Of those observations, NO2 and HCHO concentrations were obtained by remote sensing to provide spatial distributions over the whole country. Other indices were obtained by in-situ measurements to provide more accurate and robust evidences. NO2 is the only index which is monitored by both means in this work. Three representative cities located in different latitudes were selected as the study areas, namely, Beijing, Wuhan and Guangzhou. Beijing locates in the Beijing-Tianjin-Hebei region which is notorious for its bad air quality and large emissions of greenhouse gases (Qiu et al., 2020a; Shi et al., 2020b). Wuhan is the first epicenter of COVID-19 and is located in central China. Guangzhou is located in the Pearl River Delta region which is the engine of China's economics in decades (Qiu et al., 2020b; Shi et al., 2020a). Those three cities are all centers of their regions and are separated from each other, enabling us to study possible differences on responses of atmospheric environments to the COVID-19 lockdown.
The remaining parts of this work are arranged as follow. The data and method we used are described in Section 2. Main results are demonstrated in Section 3. Discussions on possible effect of meteorological factors and implications to future policy development regarding atmospheric governance are provided in Section 4. Finally, we conclude the whole study in Section 5.
2. Methodology
2.1. Study area
Three metropolises located in different latitude zones in China are selected as the study area of this work, namely Beijing, Wuhan and Guangzhou. They locate in northern, central, and southern China respectively. Because they are not geographically adjacent, they have negligible atmospheric transportations to each other. Besides, the climatic characteristics of these metropolitan areas are quite different from each other. Beijing, Wuhan and Guangzhou have a temperate monsoonal climate, a subtropical monsoon humid climate and subtropical monsoonal climate, respectively (Han et al., 2018). Based on the above considerations, these cities provide good conditions for studying the differences in responses of air qualities to COVID-19 lockdown in different regions. Locations of these three metropolises are demonstrated in Fig. 1 .
Fig. 1.
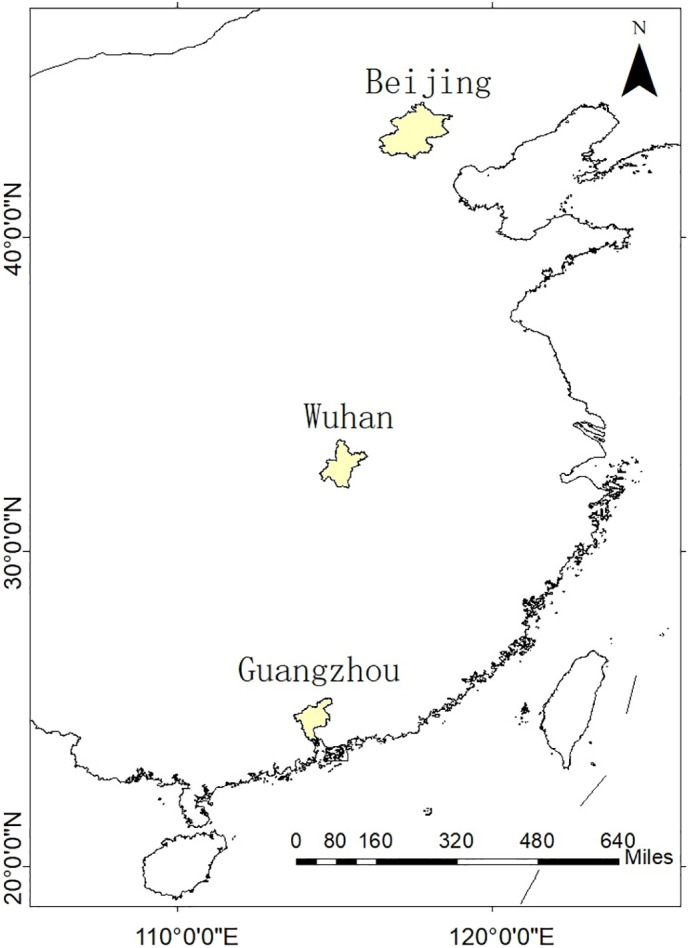
Map of the study area.
Beijing is the core of the Beijing-Tianjin-Hebei region with highly developed heavy industry (Han et al., 2017). Although the government has relocated heavy industry and highly polluting enterprises such as Shougang Group out of Beijing, most of these factories have been relocated in Hebei, around Beijing, the city's atmospheric environment thus remains very vulnerable to emissions from these heavy industry enterprises.
Wuhan is the first epicenter of COVID-19 around the world and is also the most important city in the central China in terms of economy, education, innovation and industry. Before the COVID-19 pandemic, Wuhan was famous for its multiple lakes and rivers in the city. The water-rich land cover feature leads to higher humidity and relatively high atmospheric stability in Wuhan. Once heavy pollution occurs, the rate at which pollution subsides is relatively slow unless heavy rainfall occurs (Han et al., 2014).
Guangzhou is the capital of Guangdong province in southern China. Administratively, the city holds sub-provincial status and is located in the Pearl River Delta region. Guangdong's GDP has been ranked first in China for the past 30 years, and if Guangdong were a country, its GDP would be 13th in the world. The developed manufacturing sector has also challenged the air quality in Guangzhou to a certain extent.
2.2. Lockdown measures in China
The coronavirus first broke out in Wuhan in the end of 2019 and was confirmed to be human-to-human transmission on 20th January. Since then, several provincial administrative units in China have declared the highest level of public health emergency response within a week. To stop the spread of the coronavirus, China had cut off Wuhan from other regions since 23rd, January 2020. Guangzhou authority declared the lockdown on 23rd, and one day later Beijing and Wuhan joined the lockdown. With the epidemic under control, Beijing and Guangzhou gradually lifted lockdown measures from 10th, February 2020. However, the level of recovery of industrial and manufacturing activity in these two regions remained very limited until March. As the epicenter of COVID-19, Wuhan had not lifted lockdown measures until 20th, March 2020 while production activities and traffic didn't largely resume until late April.
2.3. Datasets
2.3.1. Remotely sensed products
Sentinel-5 Precursor is a satellite launched on 13th October 2017 by the European Space Agency to monitor air pollution. The onboard sensor is frequently referred to as TROPOMI (TROPOspheric Monitoring Instrument) (Liu et al., 2020). Compared to the OMI launched in 2004, which is still operating in orbit, TROPOMI's technical characteristics have improved significantly. OMI's nadir resolution is 13 km (along track) by 24 km (cross track), and TROPOMI's spatial resolution is significantly improved with a 1–5 times higher signal-to-noise ratio. For example, OMI NO2 products have a resolution of 26 km by 48 km while TROPOMI NO2 products have a resolution of 7 km by 3.5 km. Moreover, the retrieval-assimilation-modeling system for TROPOMI NO2 products uses the 3-dimensional global TM5-MP chemistry transport model at a resolution of 1 × 1 degree as an essential element.
TROPOMI products can be downloaded for free on ESA's Sentinels Scientific Data Hub website (https://scihub.copernicus.eu). In this study, we obtained level 3 data from Google Earth Engine. Two kinds of products from TROPOMI, namely NO2 and HCHO, were obtained to illustrate temporal-spatial distributions of those pollutants. In this work, we used tropospheric NO2 and HCHO concentration products, namely, tropospheric_NO2_column_number_density and tropospheric_HCHO_column_number_density datasets, because they can better reflect anthropogenic emissions. The conversion to L3 is done by the harpconvert tool using the bin_spatial operation. The source data is filtered to remove pixels with QA values less than: 75% for the tropospheric_NO2_column_number_density and 50% for the tropospheric_HCHO_column_number_density.
2.3.2. In situ observations of the air quality
Along with remotely sensed data, in-situ observations of atmospheric pollutants were also included in this work. Daily concentrations of PM2.5, SO2, NO2 and O3, were obtained for three cities. Measurements for Wuhan and Guangzhou were provided by the China National Environmental Monitoring Center (http://www.cnemc.cn) while Measurements for Beijing were provided by the Beijing Municipal Environmental Monitoring Center (BJMEMC, http://zx.bjmemc.com.cn). There are multiple monitoring stations in those cities. For Beijing, data from 12 sites, namely WSXG, DL, DS, TT, NZG, GY, HDQWL, SYXC, HRZ, CPZ, AT and GC, were included. For Wuhan, data from 11 sites, namely DHLY, HYYH, HKHQ, WCZY, QSGH, ZKXQ, HKJT, DHGX, WJS, CHQH and MZDD, were included. For Guangzhou, data from 12 sites, namely GYZX, SWZ, THZY, GDSXY, SBSLZ, FYZX, HDSF, SJDZ, JLZZL, LH, MFSSLGY and TYX, were included. Relevant measuring methods for those atmospheric pollutants are based on national standards of China and can be found elsewhere (Han et al., 2014). Daily measurements from sites were then converted to a daily average of a certain pollutant in terms of cities. Then, we calculated weekly average concentrations for different atmospheric pollutants.
2.4. Analysis method
This paper adopts a comparative approach to analyze the impact of the COVID-19 lockdown on the atmospheric environment in three regionally representative cities. Firstly, it is crucial to study the trends of the three pollutants using time series. Since the epidemic coincides with the Spring Festival, the two effects appear to overlap. Therefore, we have selected the data for the same period of 2019 in terms of the Chinese lunar calendar for comparison. It is worth noting that we used the lunar New Year to align two years of time series data. There is another advantage by doing so. Differences between meteorological factors can be partially reduced because the Chinese lunar calendar itself is highly correlated with meteorological characteristics.
3. Results
3.1. Spatial distribution of remotely sensed NO2 and HCHO concentrations
To map the spatial distribution of NO2 concentrations, we utilized TROPOMI productions as described in Section 2. Since there are evident blanks in daily map of NO2, we used the original daily NO2 to produce the weekly average NO2 and demonstrated them in Fig. 2 . We have divided the whole period into 5 sub-periods according to the rule shown in Table 1 . Because 5th, February 2019 and 25th, January 2020 are the Lunar New Year for these two year, respectively, we aligned P3 for these two year first and then arranged other four sub-periods accordingly. As mentioned in Section 2, lockdown measures came into effect in three cities on the 23rd and 24th January 2020. We can regard P3 of 2020 as the first period when anthropogenic emissions plunged. Although, Guangzhou and Beijing authorities have nominally been gradually lifting the lockdown measure since 10th, February 2020, there was little sign of factory reopen and traffic resumption in the initial week, according to reports from state-own media and social media. Therefore, P3, P4 and P5 in 2020 can be all seen as the lockdown period for all three cities while the other two sub-periods are normal days. As the control group, only P3 can be seen as a social pause period owing to the Spring Festival holiday in 2019.
Fig. 2.

Weekly averaged TROPOMI tropospheric NO2 vertical column densities over China.
Table 1.
the period division rule for remotely sensed NO2 concentration in 2019 and 2020.
| Period | 2019 | 2020 |
|---|---|---|
| P1 (14 days before Chinese New Year) | 19.01.22–19.01.28 | 20.01.11–20.01.17 |
| P2 (7 days before Chinese New Year) | 19.01.29–19.02.04 | 20.01.18–20.01.24 |
| P3 (Chinese New Year) | 19.02.05–19.02.11 | 20.01.25–20.01.31 |
| P4 (7 days after Chinese New Year) | 19.02.12–19.02.18 | 20.02.01–20.02.07 |
| P5 (14 days after Chinese New Year) | 19.02.19–19.02.25 | 20.02.08–20.02.14 |
Fig. 2 demonstrates spatial distributions of tropospheric NO2 concentrations during P1 to P5 in 2019 and 2020. Unlike other pollutant gases and particle matters, the source of NO2 is almost exclusively anthropogenic, while its chemical instability makes it very easy to convert to nitrate and form secondary aerosols. Therefore, the tropospheric NO2 concentration can directly reflect intensities and locations of human activities. Fig. 1(a) illustrates a very typical distribution of tropospheric NO2 concentration in China. The North China Plain, which is densely populated with factories, is the main emission area for NO2. We can also find that NO2 enhancements in the Yangtze River Delta visually merged with that in the North China Plain because there are no mountains between two regions. Differently, NO2 enhancements in the Pearl River Delta region and Wuhan metropolitan area are isolated from their surroundings because of existing of large areas of mountainous.
Fig. 2(b) and (g) shows a dramatic decrease of NO2 concentrations during the social pauses due to the Lunar New Year in both years. In 2019, the mean NO2 concentration over China decreased to a very low level from in P1 to in P3 and soon rebounded since P4 until recovered to normal level in P5. Similarly, the mean NO2 concentration also plunged during P3 in 2020 all over the country. However, very differently, it kept at a low level until P5 in 2020. Looking into Fig. 2(c) and (h), it is witnessed that the COVID-19 lockdown leads to a more evident reduction of NO2 concentration compared with the Lunar New Year. This is not a surprising outcome because community closure measures during the COVID-19 lockdown reduced the frequency of vehicle use more significantly compared to the Lunar New Year holiday in ordinary years.
As a conclusion, remotely sensed NO2 observations over the country suggest that anthropogenic emissions of NO2 have been dramatically reduced regardless of regions, implying that NOX-related human activities such usage of vehicles declined all over the country. Meanwhile, the sharp drop in NO2 concentration has no momentum to rebound at least until P5.
Similarly, Fig. 3 shows temporal-spatial distributions of HCHO during P1 to P5 in 2019 and 2020. From a national perspective, the weekly average HCHO concentration decreased year-on-year. However, when we zoom in on Beijing, Wuhan and Guangzhou, there is no significant change in the HCHO concentration, both on a year-on-year and week-on-week basis, as a result of the COVID-19 lockdown.
Fig. 3.

Weekly averaged TROPOMI tropospheric HCHO vertical column densities over China.
3.2. Comparisons of responses of PM2.5 to COVID-19 lockdown in three cities
Fig. 4 shows weekly average PM2.5 concentration during P1 to P5 in three cities. Providing background information on this issue, PM2.5 is the primary atmospheric pollutant in most Chinese cities in winter. PM2.5 consists of aerosols from direct emissions and secondary aerosols from photochemical reactions. In most of time, the contribution of secondary aerosols to PM2.5 is much greater, especially in winters.
Fig. 4.

Weekly averaged PM2.5 concentration during P1 to P5 in 2019 and 2020. Grey columns mark the left vertical axis, representing the weekly averaged PM2.5 concentration. While, orange circles mark the right vertical axis, representing the ration of weekly averaged PM2.5 concentration between 2020 and 2019. A dashed line highlights the ratio of 1. An orange dot above that line indicates an increasing year-on-year PM2.5 concentration and vice versa. Arrows are used to intuitively visualize the year-on-year trend of PM2.5 concentration. Red means rise while green means decline. (For interpretation of the references to color in this figure legend, the reader is referred to the web version of this article.)
Fig. 4 shows that weekly average PM2.5 concentration exhibits distinct features in three cities. In Beijing, before COVID-19 lockdown, there are just small differences between PM2.5 concentrations in 2019 and 2020. Since the start of the Lunar New Year holiday, which is almost the start of COVID-19 lockdown, the PM2.5 concentration in Beijing is significantly higher than that during the same period last year.
The response of the PM2.5 concentration to COVID-19 lockdown in Wuhan is different from that in Beijing. The middle panel of Fig. 4 demonstrates that the PM2.5 concentration was evidently higher in P1 of 2019 than that in P1 of 2020. In P2, the PM2.5 concentrations for two years are quite similar. After the lockdown began, no evident decreasing trend of PM2.5 was witnessed during P3 and P4. Compared with the mean PM2.5 concentration during the same period in the last year, there are no significant reductions or increments either. As residents in Wuhan, we witnessed that people were still allowed to use their private vehicles in the first week after lockdown although the public transportation in Wuhan, along with cutting off connection with other cities, were suspended to mitigate spread of the coronavirus. Panic buying of goods and surging need for medical care due to suspected symptoms of pneumonia lead to increasing usages of private vehicles, partially offsetting the reduction in emissions resulting from the suspension of public transport. That could be one of reasons why the PM2.5 concentration during P3 and P4 of 2020 did not exhibit a huge reduction compared with that in P2 of 2020, P3 and P4 of 2019.
The mean PM2.5 concentration in Guangzhou is much lower than those in Beijing and Wuhan as shown in Fig. 3. Only a very slight decline of PM2.5 was observed due to COVID-19 lockdown in Guangzhou in terms of both year-over-year and month-over-month. Therefore, we can conclude that there is no significant impact of COVID-19 lockdown on the PM2.5 concentration in Guangzhou.
3.3. Comparisons of responses of pollutant gases to COVID-19 lockdown in three cities
Fig. 5, Fig. 6, Fig. 7 show weekly averaged concentration of O3 NO2 and SO2, respectively, during P1 to P5 in 2019 and 2020.
Fig. 5.

Weekly averaged O3 concentration during P1 to P5 in 2019 and 2020. Symbols in this figure are the same with those explained in Fig. 4.
Fig. 6.

Weekly averaged NO2 concentration during P1 to P5 in 2019 and 2020. Symbols in this figure are the same with those explained in Fig. 4.
Fig. 7.

Weekly averaged SO2 concentration during P1 to P5 in 2019 and 2020. Symbols in this figure are the same with those explained in Fig. 4.
It is witnessed that the O3 concentration of 2020 is higher than that of 2019 regardless of cities. From the perspective of week-on-week, both Wuhan and Guangzhou witnessed a decreasing O3 concentration since the COVID-19 lockdown began. The difference in O3 concentration trends between the two cities is that Guangzhou's O3 concentrations exhibited a decreasing trend from P2, while Wuhan's O3 concentrations increased rapidly during the first week of the lockdown and then began to decline gradually. In Beijing, the O3 concentration has exhibit a fluctuation trend. In 2020, differences among mean O3 concentrations after lockdown in 3 cities are much smaller than those among PM2.5 concentrations.
Fig. 6 shows weekly averaged NO2 concentrations in 3 cities. The NO2 concentration is the sole index which is observed by remote sensing means and ground-based in-situ stations simultaneously in this work. Hence, it provides a benchmark for inter-comparisons of two different measuring techniques. Satellite data are affected by cloud cover and other factors, and there is no guarantee that a complete observation product for a given area will be available within a week. Therefore, it is difficult to compare the data with ground-based observations over the same period one by one. However, by observing the general trends, it can be seen that the satellite products and ground-based observations can be well matched. Except for in P1 of Beijing and in P5 of Guangzhou, NO2 concentrations over 3 cities exhibited a decline trend after COVID-19 lockdown. Interestingly, Fig. 3 visually shows a large decline in NO2. Although ground stations in the three cities also observed a decline in the NO2 concentration in response, the magnitude of the decline appears to be less dramatic than that shown in Fig. 3. When we look carefully back to Fig. 3, we can find that NO2 concentrations decreased much less in major cities than in non-urban areas of the North China Plain.
In the past decade, the SO2 concentration has been significantly reduced over China. Fig. 7 shows SO2 concentrations in 3 cities are low. Usages of coals are main sources of atmospheric SO2. In China, thermoelectric power plants and steel mills are major users of coal. In Beijing, the SO2 concentration of 2020 is lower that of 2019, except for P3. In Wuhan, there is an evident rise of SO2 concentration in P4 in terms of both year-on-year and week-on-week. In Guangzhou, the SO2 concentration kept steady after lockdown. Compared with the last year, there are also not evident differences.
4. Discussions
4.1. Possible contribution of meteorological factors
Meteorological factors, especially wind speed and precipitation, have an important impact on the atmospheric environment. In analyzing the lockdown's impact on the atmospheric environment, we chose the same time period on the lunar calendar, which has already somewhat eliminated the impact of meteorological factors. In this subsection, we further statistically compare wind speed and precipitation over the experimental period to analyze the potential contribution of differences in meteorological factors in two years to changes in the atmospheric environment (Fig. 8, Fig. 9, Fig. 10 ). In addition, for the completeness of the weather data, we also counted the temperature.
Fig. 8.

Weekly averaged wind speed during P1 to P5 in 2019 and 2020.
Fig. 9.

Weekly averaged precipitation during P1 to P5 in 2019 and 2020. There was a strong precipitation process during P5 of 2019 in Guangzhou, which resulted in a weekly averaged precipitation of 18.6 mm. To share an identical axis with other conditions, we set a break point in vertical axis at the point of 16 mm because the weekly averaged precipitation in P5 of 2019 in Guangzhou is too large compared with other values.
Fig. 10.

Weekly averaged temperature (in K) during P1 to P5 in 2019 and 2020.
The weekly average wind speed decreased year-on-year in Beijing during the whole experimental period. We noticed that the weekly average wind speed dropped to 0.74 m/s in P3 of 2020. Meanwhile, there is no precipitation in that week. The temperature also kept steady. Meteorological data indicated that Beijing was in typically calm weather conditions during P3 of 2020. The poor diffusion condition suggested that high concentrations of PM2.5 and O3 in P3 of 2020, namely the first week of the COVID-19 lockdown, are unlikely results of external input from surrounding provinces but are highly possible attributed to generations of secondary aerosols. During P4 and P5, the wind speed in 2020 was just slightly lower than that in 2019 but the precipitation increased significantly year-on-year. Therefore, the meteorological factors are not the main reason for a higher PM2.5 concentration in P4 and P5 of 2020, compared with that in 2019.
In Wuhan, the wind speed and the precipitation during P3 to P5 in 2020 is slightly lower than that in 2019 while the temperature is higher in 2020. We think the meteorological condition is similar in two years and is thus not the main reason for differences of atmospheric environments between two years. In Guangzhou, the meteorological conditions of two years during P3 and P4 are also similar. It is worth noting that there was an evident high wind and rainfall process in P5 of 2019. That explains why O3 increased significantly in P5 year-on-year.
As a conclusion, meteorological factors indeed determined the difference in atmospheric quality between the two years in a few cases. However, the overall weather conditions were relatively similar in both years. Thus, differences in atmospheric quality should be attributed primarily to the COVID-19 lockdown.
4.2. Different responses in different cities
The responses of the atmospheric environments to COVID-19 lockdown demonstrated significant differences among 3 cities. For Beijing, the most notable feature is that the concentration of PM2.5 has increased rather than decreased compared to last year during P3 to P5 while concentrations of NO2 and SO2 declined at the same time. Fig. 4, Fig. 5, Fig. 6 indicate that Beijing encountered a heavily air pollution in P3 of 2020, namely, the first week of COVID-19 lockdown and also the Spring Festival holiday. Compared with 2019, PM2.5 and all pollutant gases exhibit a significant increasing trend in P3. Even from the perspective of week-on-week, only the NO2 concentration decreased in P3. Referring to Fig. 2, Fig. 3, it is witnessed that NO2 and HCHO had widespread high values in the North China Plain in the week before the lockdown. This provided a breeding ground for generations of tropospheric O3. A high concentration of tropospheric O3 eventually helped produce more secondary aerosols which are responsible for a high concentration of PM2.5 in P3 of 2020. In P4, from perspectives of both year-on-year and week-on-week, NO2 and SO2 concentrations decreased. Referring to Fig. 3, the concentration of HCHO, a critical proxy of VOCs which is, along with NO2, the precursor to tropospheric O3, declined from the high level of the last week but was still higher than that in P4 of 2019. As a consequence, the O3 concentration kept a high level. In P5 of 2020, NO2 and HCHO increased significantly, leading to a surge of O3 and PM2.5 concentrations. We can then conclude that the COVID-19 lockdown caused reductions of emissions of SO2 and NO2 in Beijing. However, the O3 concentration kept a high level, which is likely related to the fact that VOCs concentrations had not decreased. Consequently, the PM2.5 concentration exhibited a fluctuation trend after lockdown but kept higher year-on-year.
After COVID-19 lockdown, PM2.5 and NO2 exhibited decline trends in Wuhan. SO2 and HCHO kept steady. O3 increased significantly. Given that steel mills and power plants contribute the majority of Wuhan's SO2 emissions and they were still in normal production state according to reports from media during the COVID-19 lockdown, it is not a surprising conclusion that the atmospheric SO2 concentration kept steady in terms of both year-on-year and week-on-week. As we all know, the anthropogenic HCHO is mainly from vehicles emissions. However, there are lack of studies on source apportionment of HCHO in Wuhan. We cannot know exactly the proportion of anthropogenic and natural emissions of HCHO. The fact HCHO kept steady during the COVID-19 lockdown implies that the major HCHO emissions could be natural sources in this region. With the other pollutants remaining stable or showing declines, PM2.5 exhibited an increase despite O3 showing a significant downward trend.
In Guangzhou, only NO2 concentrations decreased after the COVID-19 lockdown. PM2.5, HCHO, SO2 concentrations kept steady. The O3 concentration decreased week-on-week but increased year-on-year.
4.3. Reasoning of differentiated responses and its implications
As general a conclusion, we found the NO2 concentrations decreased in all 3 cities. Besides, Fig. 2 also demonstrates that NO2 concentrations dropped significantly all over the country and exhibited no evident rebound during the lockdown period. Such a conclusion has been witnessed in many relevant researches in China, Italy and other countries.
However, as a very important index for the air quality, the PM2.5 concentration exhibited a relatively more complicated response to the COVID-19 lockdown. A high PM2.5 concentration can be visually perceived by people, and is thus of more public concern than other atmospheric pollutants. Secondary aerosols are the main component of PM2.5 in China. Unlike NO2, the generation of secondary aerosols involves complex atmospheric chemical processes, including both emissions of precursors and meteorological conditions.
There is an effect of COVID-19 lockdown on SO2 concentration in Beijing. However, such an effect is negligible in Wuhan and Guangzhou. The atmospheric SO2 concentration in most cities of China has kept declining in the past decade and is now at a low level. Therefore, we think the interaction of atmospheric SO2 with other pollutants is very limited. An outbreak of SO2 emissions could lead to evident degradation of atmospheric environments as shown in the Beijing case. However, decline of SO2 seems to exert little influences on atmospheric environments.
In recent years, O3 and VOCs become emerging factors influencing air quality after SO2 and NO2 continuously decreased in China. In summer, tropospheric O3, itself, is a big problem for many cities in China. On one hand, the stronger solar radiation in summer provides suitable conditions for the production of O3. On the other hand, concentrations of tropospheric aerosols decrease in summer due to better meteorological dispersion conditions, reducing intensities of chemical reactions with O3.
NO2 and VOCs are regarded as precursors to O3. HCHO is widely used as a proxy to VOCs. Therefore, we can correlate concentrations of O3, NO2 and HCHO to discuss generations of tropospheric O3. In this work, we found that NO2 concentrations dropped in all three cities. However, O3 concentrations increased after the COVID-19 lockdown in Beijing and Wuhan. In Guangzhou, O3 concentrations decreased after the COVID-19 lockdown but increased year-on-year. Such results underscore the difficulty of O3 pollution control. A plausible reason would be that the HCHO concentration kept steady or at most decreased slightly. Especially in Beijing, the HCHO concentration was much higher than those in Wuhan and Guangzhou.
Besides, though we did not have NO observations it is very reasonable that atmospheric NO concentration has also declined evidently, along with NO2, due to decreasing combustion emissions in the COVID lockdown period. The titration effect of NO (NO + O3 → NO2 + O2) is an important way of O3 consumption in the urban condition. That could also be an important reason for the increasing O3 concentration. Consequently, after significant reductions of SO2 and NO2 emissions, the control of tropospheric O3 concentration would be a very challenge work in the future. It is thus of great significance to reduce VOCs concentrations to avoid O3 outbreaks, especially in summer. The COVID-19 lockdown in China brought a dramatic decline of combustion emissions, which would lead to an evident decrease of anthropogenic VOCs emissions. However, it is witnessed that the HCHO concentration has not decreased significantly. It is thus implied that natural emissions and non-combustion emissions should also be taken into considerations of reducing VOCs emissions in the future.
Finally, we think it is a wrong idea that the COVID-19 pandemic can bring atmospheric improvements to mankind. Results from both remote sensing and in-situ measurements show that the COVID-19 lockdown indeed leads to reductions of some pollutants such as NO2. However, its impact on reductions of other important pollutants is neutral or even negative.
5. Conclusions
In this work, we utilized both measurements from a remote sensing satellite and in-situ sites to investigate the impact of the COVID-19 lockdown on air quality. We found significant differences in the response of different air pollutants to lockdown measures. NO2 concentrations exhibited evident decline around China. The mean NO2 concentration decreased up to 28%, 57% and 46% in Beijing, Wuhan and Guangzhou, respectively, after lockdown. However, responses of PM2.5 concentrations to the lockdown are quite geographically dependent. The PM2.5 concentrations increased in Beijing, decreased in Wuhan and kept steady in Guangzhou. The COVID-19 lockdown exerted little influences on SO2 concentrations regardless of cities. O3 concentrations increased significantly in Beijing and Wuhan after the lockdown began. Even in Guangzhou, O3 concentrations decreased slightly but were still at a high level. HCHO, an indicator to VOCs, exhibited a small decrease, but quickly returned to normal levels. We also found that meteorological factors are partly, but not primarily, responsible for these changes. Consequently, as a conclusion, we think the COVID-19 lockdown indeed reduced some atmospheric pollutants in China. However, it is not enough to improve the atmospheric quality. These results thus remind us of the importance of synergistic reductions of different atmospheric pollutants. It, in particular, highlights the significance of reducing atmospheric concentrations of VOCs and O3 in the future because there is a clear marginal effect of reducing NO2 and SO2 emissions.
Funding
This work was supported by the National Natural Science Foundation of China (Grant Nos. 41971283, 41801261, 41827801, 41801282), the National Key Research and Development Program of China (2017YFC0212600), and Postdoctoral Science Foundation of China (2017T100580).
CRediT authorship contribution statement
Zhipeng Pei: Methodology, Data curation. Ge Han: Conceptualization, Writing - original draft. Xin Ma: Investigation. Hang Su: Writing - review & editing. Wei Gong: Supervision.
Declaration of competing interest
The authors declare that they have no known competing financial interests or personal relationships that could have appeared to influence the work reported in this paper.
References
- Bauwens M., Compernolle S., Stavrakou T., Müller J.-F., van Gent J., Eskes H., et al. Impact of coronavirus outbreak on NO2 pollution assessed using TROPOMI and OMI observations. Geophys. Res. Lett. 2020;47 doi: 10.1029/2020GL087978. e2020GL087978. [DOI] [PMC free article] [PubMed] [Google Scholar]
- Chan K.L., Hartl A., Lam Y.F., Xie P.H., Liu W.Q., Cheung H.M., et al. Observations of tropospheric NO2 using ground based MAX-DOAS and OMIn measurements during the Shanghai World Expo 2010. Atmos. Environ. 2015;119:45–58. [Google Scholar]
- Chan K.L., Wang S., Liu C., Zhou B., Wenig M.O., Saiz-Lopez A. On the summertime air quality and related photochemical processes in the megacity Shanghai, China. Sci. Total Environ. 2017;580:974–983. doi: 10.1016/j.scitotenv.2016.12.052. [DOI] [PubMed] [Google Scholar]
- Chan K.L., Wiegner M., Wenig M., P?Hler D. Observations of tropospheric aerosols and NO2 in Hong Kong over 5 years using ground based MAX-DOAS. Sci. Total Environ. 2018;619–620:1545–1556. doi: 10.1016/j.scitotenv.2017.10.153. (1 April) [DOI] [PubMed] [Google Scholar]
- Chan K.L., Wang Z., Ding A., Heue K.-P., Wenig M. MAX-DOAS measurements of tropospheric NO2 and HCHO in Nanjing and a comparison to ozone monitoring instrument observations. Atmos. Chem. Phys. 2019;19:10051–10071. [Google Scholar]
- Chen K., Wang M., Huang C., Kinney P.L., Anastas P.T. Air pollution reduction and mortality benefit during the COVID-19 outbreak in China. Lancet Planet. Health. 2020;4(6):e210–e212. doi: 10.1016/S2542-5196(20)30107-8. (June) [DOI] [PMC free article] [PubMed] [Google Scholar]
- Dantas G., Siciliano B., França B.B., da Silva C.M., Arbilla G. The impact of COVID-19 partial lockdown on the air quality of the city of Rio de Janeiro, Brazil. Sci. Total Environ. 2020;729 doi: 10.1016/j.scitotenv.2020.139085. [DOI] [PMC free article] [PubMed] [Google Scholar]
- Ding A., Huang X., Nie W., Chi X., Xu Z., Zheng L., et al. Significant reduction of PM2.5 in eastern China due to regional-scale emission control: evidence from SORPES in 2011–2018. Atmos. Chem. Phys. 2019;19:11791–11801. [Google Scholar]
- Guo Z.F., Zhou K.L., Zhang X.L., Yang S.L., Shao Z. Data mining based framework for exploring household electricity consumption patterns: a case study in China context. J. Clean. Prod. 2018;195:773–785. [Google Scholar]
- Han G., Gong W., Quan J., Li J., Zhang M. Study on spatial and temporal distributions of contaminants emitted by Chinese New Year’Eve celebrations in Wuhan. Environ. Sci. Process. Impacts. 2014;16:916–923. doi: 10.1039/c3em00588g. [DOI] [PubMed] [Google Scholar]
- Han G., Ma X., Liang A., Zhang T., Zhao Y., Zhang M., et al. Performance evaluation for China’s planned CO2-IPDA. Remote Sens. 2017;9:768. [Google Scholar]
- Han G., Xu H., Gong W., Liu J., Du J., Ma X., et al. Feasibility study on measuring atmospheric CO2 in urban areas using spaceborne CO2-IPDA LIDAR. Remote Sens. 2018;10:985. [Google Scholar]
- Huang K., Zhang X.Y., Lin Y.F. The “APEC Blue” phenomenon: regional emission control effects observed from space. Atmos. Res. 2015;164:65–75. [Google Scholar]
- Kerimray A., Baimatova N., Ibragimova O.P., Bukenov B., Karaca F. Assessing air quality changes in large cities during COVID-19 lockdowns: the impacts of traffic-free urban conditions in Almaty, Kazakhstan. Sci. Total Environ. 2020;730 doi: 10.1016/j.scitotenv.2020.139179. [DOI] [PMC free article] [PubMed] [Google Scholar]
- Kraemer M.U.G., Yang C.-H., Gutierrez B., Wu C.-H., Scarpino S.V. The effect of human mobility and control measures on the COVID-19 epidemic in China. Science. 2020;368:493–497. doi: 10.1126/science.abb4218. [DOI] [PMC free article] [PubMed] [Google Scholar]
- Li H.Y., Zhang Q., Duan F.K., Zheng B., He K.B. The “Parade Blue”: effects of short-term emission control on aerosol chemistry. Faraday Discuss. 2016;189:317–335. doi: 10.1039/c6fd00004e. [DOI] [PubMed] [Google Scholar]
- Li H.Y., Cheng J., Zhang Q., Zheng B., Zhang Y.X., Zheng G.J., et al. Rapid transition in winter aerosol composition in Beijing from 2014 to 2017: response to clean air actions. Atmos. Chem. Phys. 2019;19:11485–11499. [Google Scholar]
- Lin J.T., McElroy M.B. Detection from space of a reduction in anthropogenic emissions of nitrogen oxides during the Chinese economic downturn. Atmos. Chem. Phys. 2011;11:8171–8188. [Google Scholar]
- Liu F., Page A., Strode S., Yoshida Y., Choi S., Zheng B., et al. 2020. Abrupt Declines in Tropospheric Nitrogen Dioxide Over China After the Outbreak of COVID-19. [DOI] [PMC free article] [PubMed] [Google Scholar]
- Mahato S., Pal S., Ghosh K.G. Effect of lockdown amid COVID-19 pandemic on air quality of the megacity Delhi, India. Sci. Total Environ. 2020;730 doi: 10.1016/j.scitotenv.2020.139086. [DOI] [PMC free article] [PubMed] [Google Scholar]
- Otmani A., Benchrif A., Tahri M., Bounakhla M., Chakir E.M., El Bouch M., et al. Impact of COVID-19 lockdown on PM10, SO2 and NO2 concentrations in Salé City (Morocco) Sci. Total Environ. 2020;735 doi: 10.1016/j.scitotenv.2020.139541. [DOI] [PMC free article] [PubMed] [Google Scholar]
- Qiu R., Han G., Ma X., Sha Z., Shi T., Xu H., et al. CO2 concentration, a critical factor influencing the relationship between solar-induced chlorophyll fluorescence and gross primary productivity. Remote Sens. 2020;12:1377. [Google Scholar]
- Qiu R., Han G., Ma X., Xu H., Shi T., Zhang M. A comparison of OCO-2 SIF, MODIS GPP, and GOSIF data from gross primary production (GPP) estimation and seasonal cycles in North America. Remote Sens. 2020;12:258. [Google Scholar]
- Sharma S., Zhang M., Anshika Gao J., Zhang H., Kota S.H. Effect of restricted emissions during COVID-19 on air quality in India. Sci. Total Environ. 2020;728:138878. doi: 10.1016/j.scitotenv.2020.138878. [DOI] [PMC free article] [PubMed] [Google Scholar]
- Shi T., Han G., Ma X., Zhang M., Pei Z., Xu H., et al. An inversion method for estimating strong point carbon dioxide emissions using a differential absorption Lidar. J. Clean. Prod. 2020;271 (20 October) [Google Scholar]
- Shi T., Ma X., Han G., Xu H., Qiu R., He B., et al. Measurement of CO2 rectifier effect during summer and winter using ground-based differential absorption LiDAR. Atmos. Environ. 2020;220 [Google Scholar]
- Tian H.Y., Liu Y.H., Li Y.D., Wu C.H., Chen B., Kraemer M.U.G., et al. An investigation of transmission control measures during the first 50 days of the COVID-19 epidemic in China. Science. 2020;368:638. doi: 10.1126/science.abb6105. [DOI] [PMC free article] [PubMed] [Google Scholar]
- Wang S.X., Zhao M., Xing J., Wu Y., Zhou Y., Lei Y., et al. Quantifying the air pollutants emission reduction during the 2008 Olympic Games in Beijing. Environ. Sci. Technol. 2010;44:2490–2496. doi: 10.1021/es9028167. [DOI] [PubMed] [Google Scholar]
- Wang T., Xue L.K., Brimblecombe P., Lam Y.F., Li L., Zhang L. Ozone pollution in China: a review of concentrations, meteorological influences, chemical precursors, and effects. Sci. Total Environ. 2017;575:1582–1596. doi: 10.1016/j.scitotenv.2016.10.081. [DOI] [PubMed] [Google Scholar]
- Wang P., Chen K., Zhu S., Wang P., Zhang H. Severe air pollution events not avoided by reduced anthropogenic activities during COVID-19 outbreak. Resour. Conserv. Recycl. 2020;158 doi: 10.1016/j.resconrec.2020.104814. [DOI] [PMC free article] [PubMed] [Google Scholar]
- Wang Y., Gao W., Wang S., Song T., Gong Z., Ji D., et al. Contrasting trends of PM2.5 and surface-ozone concentrations in China from 2013 to 2017. Natl. Sci. Rev. 2020 doi: 10.1093/nsr/nwaa032. [DOI] [PMC free article] [PubMed] [Google Scholar]
- Yan H., Chen L., Tao J., Han D., Su L., Yu C. SO2 long-term monitoring by satellite in the Pearl River Delta. J. Remote Sens. 2012;16:390–404. [Google Scholar]
- Zhang R.X., Wang Y.H., Smeltzer C., Qu H., Koshak W., Boersma K.F. Comparing OMI-based and EPA AQS in situ NO2 trends: towards understanding surface NOx emission changes. Atmos. Measure. Tech. 2018;11:3955–3967. [Google Scholar]
- Zhang Q., Zheng Y.X., Tong D., Shao M., Wang S.X., Zhang Y.H., et al. Drivers of improved PM2.5 air quality in China from 2013 to 2017. Proc. Natl. Acad. Sci. U. S. A. 2019;116:24463–24469. doi: 10.1073/pnas.1907956116. [DOI] [PMC free article] [PubMed] [Google Scholar]