Abstract
Surface-enhanced Raman scattering (SERS) and photoluminescence (PL) are important photoexcitation spectroscopy techniques; however, understanding how to analyze and modulate the relationship between SERS and PL is rather important for enhancing SERS, having a great effect on practical applications. In this work, a charge-transfer (CT) mechanism is proposed to investigate the change and relationships between SERS and PL. Analyzing the change in PL and SERS before and after the adsorption of the probe molecules on Nd-doped ZnO indicates that the unique optical characteristics of Nd3+ ions increase the SERS signal. On the other hand, the observed SERS can be used to explain the cause of PL background reduction. This study demonstrates that modulating the interaction between the probe molecules and the substrate can not only enhance Raman scattering but also reduce the SERS background. Our work also provides a guideline for the investigation of CT as well as a new method for exploring fluorescence quenching.
Subject terms: Optical materials and structures, Optical physics
Spectroscopy: rare earths help sensors focus on the necessities
Sensors that use laser light scattering to detect molecular-scale changes to samples can be improved with a new substrate that naturally reduces background interference. Surface-enhanced Raman spectroscopy (SERS) setups typically use a combination of metal nanoparticles and fluorescent probes to capture vibrational signals from biomolecules including DNA. Ming Gao from Jilin Normal University in Siping, China, and colleagues now report a technique to keep probe emissions from interfering with SERS signals. To accomplish this, the team synthesized a neodymium-doped zinc oxide spiky nanostructures substrate. Spectroscopic measurements revealed that neodymium’s electronic properties enabled it to transfer photoexcited electrons to the probes. This charge transfer reduced the probe’s fluorescent intensity and simultaneously enhanced SERS emissions beyond that available on pure zinc oxide surfaces.
This study provides a new way to naturally eliminate the SERS fluorescence background by doping with Nd ions. These fundamental discussions here provide a path to enhance Raman scattering and reduce the SERS background and a guideline for the investigation of CT and a new method for exploring fluorescence quenching.
Introduction
Surface-enhanced Raman scattering (SERS), as a powerful spectral technology, has been widely used in the fields of chemistry, pharmaceuticals, biosensors, food detection, and environmental monitoring owing to its high sensitivity and fast response1–3. In general, the enhanced magnitude of SERS is associated with two mechanisms. One is the electromagnetic mechanism, which is related to the localized surface plasmon resonance of the metal nanoparticles (NPs)4. The other is the chemical mechanism, which mainly originates from the charge transfer (CT) between adsorbed molecules and SERS-active substrates5. On the other hand, the photoluminescence (PL) of the substrates and adsorbed molecules, acting as a broad-continuum background of SERS spectroscopy, has a great effect on SERS spectroscopy and evenly reduces the distinctiveness of the Raman tag6,7. Thus, controlling and utilizing PL, contributed by substrates and adsorbed molecules, to enhance the SERS signal is a key problem that urgently needs to be solved. Recently, Ren et al. successfully resolved these limitations by proposing a method for recovering native chemical information from SERS using plasmonic PL and quantitatively investigated the relationship between the PL and the SERS background8. However, the development of simpler and more effective methods to remove the negative effects of PL on SERS and to directly analyze the relationship between SERS and PL is of significance for both fundamental research and practical application.
In the PL generation mechanism, photoexcited electrons transition to a high energy level. Because of high-energy-level instability, these electrons usually transition to a low energy level and emit photons9,10. This inspires us to use electrons as a link to explore the relationship between PL and SERS in the CT mechanism and investigate how PL affects the SERS signal. SERS technology has been widely used to monitor the charge transport of substrate–molecular junctions11,12. Generally, when a semiconductor is used as a SERS substrate, only the CT enhancement mechanism contributes to SERS signals. However, exploring the relationship between SERS and PL of pure semiconductors is not obvious and thus is not convenient to analyze. Previously, we introduced impurity ions to optimize the matrix semiconductor10,13. The intra-4f emission spectra of Nd3+ are characterized by narrow lines with high color purity because the 4f electrons of rare-earth ions are shielded from external forces by the outer 5s and 5p electrons14. Thus, incorporating Nd3+ ions into a semiconductor might be an effective way to enhance the SERS signal. On the other hand, the characteristic PL peaks of Nd3+ ions can be used to analyze the relationship between PL and SERS. In this study, the nanomaterial ZnO was selected as a SERS substrate owing to its good optical stability and relatively high SERS activity among the reported semiconductor nanomaterials15,16.
In this work, we successfully synthesized Nd-doped ZnO (Zn1 − xNdxO) as a SERS substrate in which Nd doping was performed using a simple chemical method. Here, we creatively used the CT mechanism to establish the relationship between SERS and PL and examined the change in SERS and PL caused by the CT mechanism in detail. We found that both Nd3+ ions and probe molecule fluorescence quenching promote CT, enhance the SERS effect, and reduce the SERS background. This is thus the first example of using PL to enhance SERS and provides a new method for exploring fluorescence quenching.
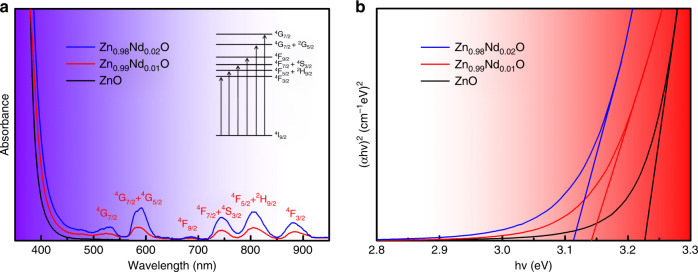
Zn1 − xNdxO (x = 0.00, 0.005, 0.01, 0.015, 0.0175, 0.02, 0.0225, and 0.03) was prepared via the coprecipitation method (details regarding the synthesis are presented in the Supporting Information, Fig. S1). X-ray diffraction (XRD) patterns (Fig. S2) revealed that the solubility limit of Nd3+ ions is ~0.02 in the Zn1 − xNdxO structure and that excessive doping causes the precipitation of Nd2O3 NPs17. The morphologies of ZnO and Zn0.98Nd0.02O were examined via scanning electron microscopy (SEM) and transmission electron microscopy (TEM). The SEM images show that pure ZnO is a NP, aggregating with a diameter of ~100 nm (Fig. S3a); after Nd doping, Zn0.98Nd0.02O is a 3D urchin-like nanostructure with a diameter of 2 μm (Fig. S3c). Figure S3b, d (e.g., TEM images) shows that the surface area increases after doping, which improves the adsorption capacity. Among these eight samples with different doping amounts, we selected 0, 1, and 2% representative data for subsequent research. The UV–vis absorption spectra of Zn1 − xNdxO (x = 0.00, 0.01, 0.02) are shown in Fig. 1a. It is noteworthy that there are some characteristic peaks of Nd3+ ions at 879.4, 805.2, 742.5, 685.1, 578.2, and 521.0 nm corresponding to intra-4f shell electron transitions of Nd3+ ions18, as shown in the inset of Fig. 1a. It is well known that optical absorption properties are associated with the optical band gap (Eg), which can be obtained by Tauc’s formula (αhν)2 = hν − Eg, as shown in Fig. 1b19. The band gaps of Zn1 − xNdxO (x = 0.00, 0.01, 0.02) were derived to be 3.23, 3.14, and 3.11 eV, respectively. Zn1 − xNdxO has a smaller band gap value, indicating that it has a preferable optical absorption property, making the interband charge transition easier.
Fig. 1. The UV-vis absorption spectra and of Optical energy band gap ZnO and Zn1−xNdxO.
a The UV–vis absorption spectra of ZnO and Zn1−xNdxO (x = 0.00, 0.01, 0.02). b Optical energy band gap of ZnO and Zn1−xNdxO (x = 0.00, 0.01, 0.02)
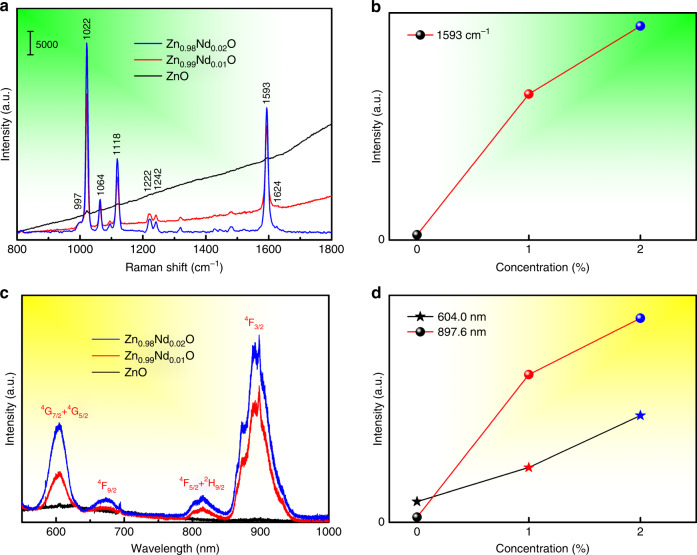
To explore the relationship between SERS and PL, we obtained SERS and PL spectra measured with laser lines of 514.5 nm. 4-Mpy (C5H5NS) was selected as a probe, and the SERS spectra of 4-MPy adsorbed on Zn1 − xNdxO are shown in Fig. 2a (several representative concentrations are shown in Fig. 2a, and other concentrations are given in the Supporting Information, Fig. S4). The SERS spectral signal is enhanced after Nd doping, while the signal contributed by the fluorescence background is weakened. Figure 2b shows the SERS intensity of the 1593 cm−1 band of 4-MPy plotted as a function of the Nd concentration. The SERS intensity increases with the Nd concentration and reaches a maximum for Zn0.98Nd0.02O. Figure 2c displays the PL spectra of Zn1 − xNdxO. The Nd-doped ZnO exhibits dramatically sharp luminescence peaks, which is in sharp contrast with pure ZnO. Moreover, luminescent peaks are located at 897.6, 815.1, 674.2, and 604.0 nm (4F3/2, 4F5/2 + 2H9/2, 4F9/2, and 4G7/2 + 2G5/2), corresponding to the UV–vis absorption spectra20. Figure 2d shows the Nd-ion doping concentration-dependent PL intensity of Zn1 − xNdxO, which initially increases with the enhancement of the Nd concentration. Notably, the change in the PL intensity (Fig. 2d) is consistent with the change in the SERS intensity (Fig. 2b).
Fig. 2. To explore the relationship between SERS and PL, SERS spectra of 4-MPy adsorbed on Zn1−xNdxO and PL spectra of Zn1−xNdxO measured with laser lines of 514.5 nm.
a SERS spectra of 4-MPy adsorbed on Zn1−xNdxO (x = 0.00, 0.01, 0.02) under a 514.5-nm laser. b A plot of the SERS intensity of the 1593 cm−1 band of 4-MPy versus Nd concentration. c PL spectra of Zn1−xNdxO (x = 0.00, 0.01, 0.02) under a 514.5-nm laser. d A plot of the PL intensity of 604.0 and 897.6 nm versus Nd concentration
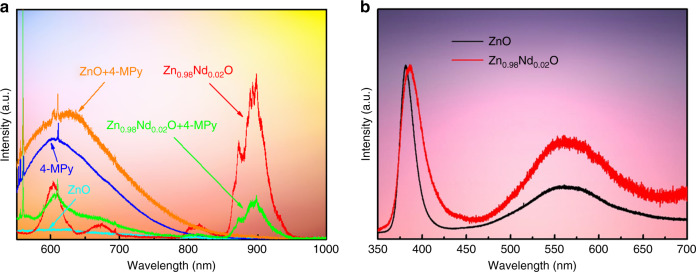
To further investigate the relationship between the PL and SERS of Zn1 − xNdxO, we examined the change in the PL spectrum of Zn1 − xNdxO (x = 0.00, 0.01, 0.02) with and without 4-MPy molecules. Figure 3a shows that the PL signal of 4-MPy + ZnO is a simple superposition of the fluorescence of ZnO and 4-MPy, but the PL signal of 4-MPy + Zn0.98Nd0.02O is reduced in comparison with that of 4-MPy molecules. The intensities of the luminescence peaks at 897.6 and 815.1 nm (4F3/2 and 4F5/2 + 2H9/2) significantly decrease, while that of the luminescence peak at 604.0 nm (4G7/2 + 2G5/2) shows a relatively small decrease. In addition, the SERS signal of 4-MPy + Zn0.98Nd0.02O is significantly increased (Fig. 2a), indicating that there is obvious CT between Zn0.98Nd0.02O substrates and 4-MPy molecules.
Fig. 3. PL spectra of Zn1−xNdxO with and without 4-MPy molecules upon 514.5 nm and 325 nm laser excitation.
a PL spectra of ZnO, Zn0.98Nd0.02O, 4-MPy, 4-MPy+ZnO, and 4-MPy+Zn0.98Nd0.02O upon 514.5-nm laser excitation; b PL spectra of ZnO, Zn0.98Nd0.02O, and ZnO upon 325-nm laser excitation
To probe the CT mechanism between Zn1 − xNdxO (x = 0.00, 0.01, 0.02) and 4-MPy in the SERS spectrum, first, UPS and UV–vis spectra were used to determine the position of each energy level. The highest occupied molecular orbital (HOMO) and lowest unoccupied molecular orbital (LUMO) levels of 4-MPy are −9.77 and −6.34 eV, respectively (calculated from Figs. S5 and S6). The maximum valence band (VB) and minimum conduction band (CB) of Zn0.98Nd0.02O are −9.11 and −6.00 eV (calculation process in SI, Fig. S7), respectively. Figure 3b shows the PL spectra of pure ZnO and Zn0.98Nd0.02O upon 325-nm laser excitation. The two samples consist of two emission bands: a near band edge at ~383 nm and a wide deep level emission (DLE) from 480 to 660 nm21. The DLE is attributed to intrinsic defects, such as oxygen vacancies or various surface states22. On the other hand, Nd doping increases the number of surface defects of ZnO. These oxygen vacancies and surface defects induce new surface state energy levels (Ess) of 1.88–2.58 eV13, located above the top of the VB (Fig. 3b). In addition, theoretical calculations indicate that the electronic ground state (4I9/2) of the Nd3+ ions is located ~1 eV below the top of the VB23. Thus, the excited-state energy levels of the Nd3+ ions are located at −8.73, −8.61, −8.27, and −8.06 eV, respectively.
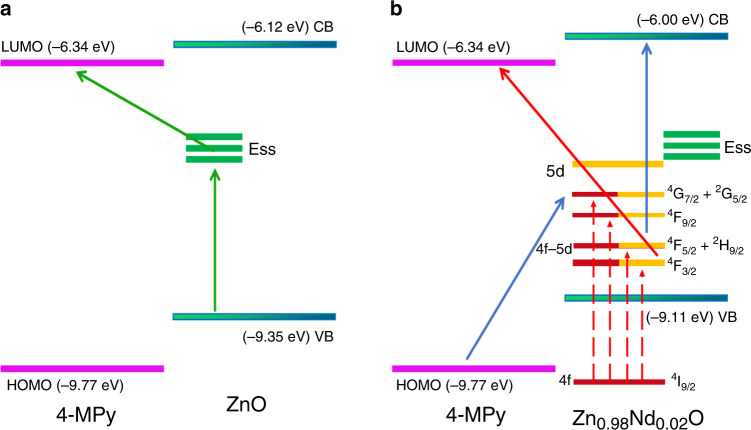
Based on the above results, we analyzed the enhancement mechanism of Zn1 − xNdxO (x = 0.00, 0.01, 0.02, taking Zn0.98Nd0.02O as an example). As shown in Fig. 4a, upon excitation at 514.5 nm (2.41 eV), the VB electrons of ZnO can be excited to Ess, transition to the LUMO level of the adsorbed 4-MPy molecules, and finally return to the VB of ZnO to release a Raman photon24. Considering that pure ZnO contains few oxygen defects, ZnO only undergoes CT in this process. Therefore, its SERS intensity is very low, and the PL signal with the probe molecules is superimposed.
Fig. 4.
Schematic representations for charge-transfer mechanisms between a 4-MPy and ZnO and b 4-MPy and Zn0.98Nd0.02O
As shown in Fig. 4b, for Zn0.98Nd0.02O, the 514.5-nm laser is able to excite the electrons of the 4f shell of the Nd3+ ions from the ground state (4I9/2) to the excited states (4F3/2, 4F5/2 + 2H9/2, 4F9/2, and 4G7/2 + 2G5/2). Then, the excited-state electrons transfer to the LUMO level and finally return to the ground state of the Nd3+ ions, releasing Raman photons. CT from the excited-state electrons of the Nd3+ ions to the 4-MPy molecule reduces the number of electrons returning to the ground state, resulting in fluorescence quenching of Nd3+ ions. The energy required for transition from the excited-state 4F3/2 to the LUMO is 2.39 eV, and the laser energy of 514.5 nm is exactly 2.41 eV. The two almost identical energy levels induce the occurrence of CT resonance. When 4F5/2 + 2H9/2 transitions to a higher unoccupied molecular orbital, CT resonance can also occur. Thus, the luminescence peaks (4F3/2 and 4F5/2 + 2H9/2) significantly decrease. However, the energy required to transfer electrons at 4G7/2 + 2G5/2 to the 4-MPy molecule is much lower in comparison with that for 4F3/2. The CT resonance cannot occur, resulting in a lower probability of CT. As a consequence, the intensity of the 4G7/2 + 2G5/2 luminescence peak has only a relatively small decrease. To better prove this electron transfer between Zn0.98Nd0.02O and 4-MPy, we measured the fluorescence lifetime of Zn0.98Nd0.02O before and after absorbing the 4-MPy molecule and collected their emission decays at 4G7/2 + 2G5/2 (Fig. S8a) and 4F3/2 (Fig. S8b). It was found that when the 4-MPy molecule is adsorbed, the lifetime of the 4F3/2 energy level (897.6 nm) decreases rapidly, whereas the lifetime of the 4G5/2 + 2G7/2 energy level (604.0 nm) remains almost unchanged. Therefore, the fluorescence quenching of Nd3+ ions significantly increases the SERS intensity of Zn1 − xNdxO, realizing that the utilization of unique optical characteristics of Nd3+ ions promotes the SERS signal. As shown in the theoretical calculation (Fig. S9), the empty Nd 4f impurity levels are close to the Nd 5d levels, leading to mixing of the 4f and small amounts of the 5d orbitals, referred to as the 4f–5d orbital. Under laser irradiation, the 4f ground-state electrons of Nd3+ ions can be excited into the higher empty 4f–5d levels, and then these excited 4f–5d electrons jump into the 5d levels under continuous irradiation25. At the same time, the electrons in the 5d orbital are reductive and easily lose electrons under irradiation by light26. Overall, the CT channel, originating from charge-transfer resonance, overcomes the effect of the 4f levels shielded by external 5s and 5p electrons.
Furthermore, upon laser excitation, the HOMO-level electrons of the 4-MPy molecules transfer to the excited states and then to the CB of Zn1 − xNdxO. They finally return to the HOMO level of the 4-MPy molecules, releasing Raman photons. This process inhibits the recombination of electrons and holes in the HOMO level, resulting in fluorescence quenching of 4-MPy molecules. The above CT processes work together toward the enhancement of SERS signals and significantly reduce the fluorescence background.
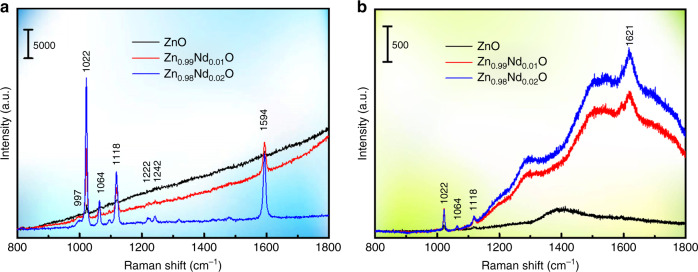
To further verify these CT processes, the SERS spectra of Zn1 − xNdxO (x = 0.00, 0.01, 0.02) were analyzed under 633 and 785 nm laser irradiation (Fig. 4). The SERS spectra at 633 nm irradiation were essentially the same as the spectrum at 532 nm irradiation (Fig. 5a). However, the SERS spectra at 785 nm irradiation were significantly different (Fig. 5b): the SERS background increased significantly, while the SERS intensity was only slightly enhanced. The 633-nm laser (1.96 eV) can maximally excite electrons from 4I9/2 to 4F9/2 (1.84 eV) and then transfer to the LUMO level (1.93 eV). However, the 785-nm laser (1.58 eV) preferentially excites electrons from 4I9/2 to 4F5/2 + 2H9/2 (1.52 eV), but the laser energy is not sufficient to again excite the electrons to the LUMO level (2.27 eV). In the case of an increase in the PL of Nd-doped ZnO, the inability of the substrate to reduce the PL signal via CT is responsible for the SERS background enhancement. Although the SERS spectra obtained under different excitation lines are different, they all support our proposed mechanism.
Fig. 5.
SERS spectra of 4-MPy adsorbed on Zn1 − xNdxO (x = 0.00, 0.01, 0.02) under different laser excitation: a 633 nm and b 785 nm
In summary, we analyzed the change between the PL and SERS relative intensities of Nd-doped ZnO before and after the adsorption of probe molecules to explore the CT mechanisms in Nd-doped ZnO systems. The results indicated that the unique CT between Nd3+ ions and probe molecules improves the SERS performance and naturally eliminates the SERS fluorescent background. Moreover, the mechanism is further confirmed by examining the SERS spectra under various excitation wavelengths. This work paves the way for developing novel molecular-sensing techniques.
Methods
Zn1 − xNdxO was synthesized using the coprecipitation method. In brief, Zn(NO3)2·6H2O and Nd(NO3)3·6H2O were dissolved in deionized water with a molar ratio where Nd/(Nd + Zn) was x:1 (x = 0.00, 0.005, 0.01, 0.015, 0.0175, 0.02, 0.0225, 0.03). After stirring for 20 min, NH4HCO3 aqueous solution was added. After stirring for 4 h, the white precipitates were collected by centrifugation, washed with deionized water and ethanol several times, and then dried under vacuum at 80 °C for 12 h. Finally, the sample was further annealed in air for 1 h at 600 °C to obtain the final Zn1 − xNdxO (x = 0.00, 0.005, 0.01, 0.015, 0.0175, 0.02, 0.0225, and 0.03) products.
We evaluated the structural quality of the samples with X-ray diffraction (XRD, Rigaku D/Max 3C). X-ray photoelectron spectroscopy (XPS, VG ESCALAB 250X) was used to analyze the element content of the samples. The morphology was characterized by field emission SEM (JEOL JSM-6700F) and TEM (JEM-2100HR). UV–vis absorption spectra were measured by a Shimadzu 3600 spectrometer. Under a 514.5 nm (2.41 eV) Ar+ ion laser, the Renishaw inVia Raman system detected all SERS and PL signals with a laser power of 40 mW, attenuation of 100%, 10-s exposure time, and 1 scan.
Supplementary information
Acknowledgements
This work was financially supported by the National Natural Science Foundation of China (Nos. 61675090, 21776110, 6170502021676115, 61705020, and 61575080); the National Youth Foundation of China (Nos. 61405072, 61704065, 6170507821546013, 61704065, 61705078, and 51609100); the Program for the Development of Science and Technology Jilin Province (Grant Nos. 20200201022JC, 20190103002JH, 20180520179JH20160101287JC, and 20180520179JH); the Thirteenth Five-Year Program for Science and Technology of Education Department of Jilin Province (Grant No. JJKH20190550KJ). The authors would like to thank the Prof. Lei Chen, Prof. Guochun Yang, and Prof. Yisong Zheng for the guidance.
Author contributions
S.Y. and J. Yao contributed equally to this work. S.Y. conducted the experiments and revised the paper; J. Yao synthesized the samples and wrote the original draft preparation; Y.Q. tested the samples; M.H. and R.S. provided the theory calculation; M.G. designed the project and revised and edited the manuscript; D.H. and J. Yang participated in the discussion of the experimental data and provided good advice.
Conflict of interest
The authors declare that they have no conflicts of interest.
Contributor Information
Ming Gao, Email: gaomingphy@126.com.
Donglai Han, Email: DLhan_1015@163.com.
Jinghai Yang, Email: jhyang1@jlnu.edu.cn.
Supplementary information
Supplementary information is available for this paper at 10.1038/s41377-020-00361-0.
References
- 1.Huang YZ, et al. Nanowire-supported plasmonic waveguide for remote excitation of surface-enhanced Raman scattering. Light.: Sci. Appl. 2014;3:e199. doi: 10.1038/lsa.2014.80. [DOI] [Google Scholar]
- 2.Yao JC, et al. AgNPs decorated Mg-doped ZnO heterostructure with dramatic SERS activity for trace detection of food contaminants. J. Mater. Chem. C. 2019;7:8199–8208. doi: 10.1039/C8TC06588H. [DOI] [Google Scholar]
- 3.Shan XY, et al. Mesoporous TiO2 nanofiber as highly efficient sulfur host for advanced lithium-sulfur batteries. Chin. J. Mech. Eng. 2019;32:e60. doi: 10.1186/s10033-019-0374-2. [DOI] [Google Scholar]
- 4.Yao JC, et al. Improved charge transfer and hot spots by doping and modulating the semiconductor structure: a high sensitivity and renewability surface-enhanced Raman spectroscopy substrate. Langmuir. 2019;35:8921–8926. doi: 10.1021/acs.langmuir.9b00754. [DOI] [PubMed] [Google Scholar]
- 5.Quan YN, et al. ZnO nanoparticles on MoS2 microflowers for ultrasensitive SERS detection of bisphenol A. Microchim. Acta. 2019;186:593. doi: 10.1007/s00604-019-3702-4. [DOI] [PubMed] [Google Scholar]
- 6.Hugall JT, Baumberg JJ. Demonstrating photoluminescence from Au is electronic inelastic light scattering of a plasmonic metal: the origin of SERS backgrounds. Nano Lett. 2015;15:2600–2604. doi: 10.1021/acs.nanolett.5b00146. [DOI] [PMC free article] [PubMed] [Google Scholar]
- 7.Weber ML, et al. Super-resolution imaging reveals a difference between SERS and luminescence centroids. ACS Nano. 2012;6:1839–1848. doi: 10.1021/nn205080q. [DOI] [PubMed] [Google Scholar]
- 8.Lin KQ, et al. Plasmonic photoluminescence for recovering native chemical information from surface-enhanced Raman scattering. Nat. Commun. 2017;8:14891. doi: 10.1038/ncomms14891. [DOI] [PMC free article] [PubMed] [Google Scholar]
- 9.Williams FE, Eyring H. The mechanism of the luminescence of solids. J. Chem. Phys. 1947;15:289–304. doi: 10.1063/1.1746499. [DOI] [Google Scholar]
- 10.Gao M, et al. Strong red emission and catalytic properties of ZnO by adding Eu2O3 shell. J. Alloy. Compd. 2017;724:537–542. doi: 10.1016/j.jallcom.2017.07.060. [DOI] [Google Scholar]
- 11.Zheng JT, et al. Electrical and SERS detection of disulfide-mediated dimerization in single-molecule benzene-1,4-dithiol junctions. Chem. Sci. 2018;9:5033–5038. doi: 10.1039/C8SC00727F. [DOI] [PMC free article] [PubMed] [Google Scholar]
- 12.Kiguchi M, et al. Surface enhanced Raman scattering on molecule junction. Appl. Mater. Today. 2019;14:76–83. doi: 10.1016/j.apmt.2018.10.008. [DOI] [Google Scholar]
- 13.Xue XX, et al. Surface-enhanced Raman scattering of molecules adsorbed on Co-doped ZnO nanoparticles. J. Raman Spectrosc. 2012;43:61–64. doi: 10.1002/jrs.2988. [DOI] [Google Scholar]
- 14.Yang S, et al. Controllable morphology and tunable colors of Mg and Eu ion co-doped ZnO by thermal annealing. CrystEngComm. 2014;16:6896–6900. doi: 10.1039/C4CE00471J. [DOI] [Google Scholar]
- 15.Wang XT, et al. Remarkable SERS activity observed from amorphous ZnO nanocages. Angew. Chem. Int. Ed. 2017;56:9851–9855. doi: 10.1002/anie.201705187. [DOI] [PubMed] [Google Scholar]
- 16.Gao M, et al. Zinc oxide nanotubes decorated with silver nanoparticles as an ultrasensitive substrate for surface-enhanced Raman scattering. Microchim. Acta. 2012;179:315–321. doi: 10.1007/s00604-012-0898-y. [DOI] [Google Scholar]
- 17.Wang SG, et al. Thermally removable in-situ formed ZnO template for synthesis of hierarchically porous N-doped carbon nanofibers for enhanced electrocatalysis. Nano Res. 2016;9:2270–2283. doi: 10.1007/s12274-016-1114-x. [DOI] [Google Scholar]
- 18.Alam U, et al. Comparative photocatalytic activity of sol–gel derived rare earth metal (La, Nd, Sm and Dy)-doped ZnO photocatalysts for degradation of dyes. RSC Adv. 2018;8:17582–17594. doi: 10.1039/C8RA01638K. [DOI] [PMC free article] [PubMed] [Google Scholar]
- 19.Cheng XB, et al. Waterproof coatings for high-power laser cavities. Light. Sci. Appl. 2019;8:12. doi: 10.1038/s41377-018-0118-6. [DOI] [PMC free article] [PubMed] [Google Scholar]
- 20.Gao M, et al. Novel composite nanomaterials with superior thermal and pressure stability for potential LED applications. J. Alloy. Compd. 2018;734:282–289. doi: 10.1016/j.jallcom.2017.11.042. [DOI] [Google Scholar]
- 21.Wang XH, et al. The photoluminescence properties of ZnO whiskers. J. Cryst. Growth. 2004;263:316–319. doi: 10.1016/j.jcrysgro.2003.11.063. [DOI] [Google Scholar]
- 22.Vanheusden K, et al. Mechanisms behind green photoluminescence in ZnO phosphor powders. J. Appl. Phys. 1996;79:7983–7990. doi: 10.1063/1.362349. [DOI] [Google Scholar]
- 23.Balestrieri M, et al. Efficient energy transfer from ZnO to Nd3+ ions in Nd-doped ZnO films deposited by magnetron reactive sputtering. J. Mater. Chem. C. 2014;2:9182–9188. doi: 10.1039/C4TC00980K. [DOI] [Google Scholar]
- 24.Yilmaz M, et al. Micro-/nanostructured highly crystalline organic semiconductor films for surface-enhanced Raman spectroscopy applications. Adv. Funct. Mater. 2015;25:5669–5676. doi: 10.1002/adfm.201502151. [DOI] [Google Scholar]
- 25.Meng JL, et al. Luminescence mechanistic study of BaLaGa3O7:Nd using density functional theory calculations. Inorg. Chem. 2016;55:2855–2863. doi: 10.1021/acs.inorgchem.5b02714. [DOI] [PubMed] [Google Scholar]
- 26.Qiao YS, Schelter EJ. Lanthanide photocatalysis. Acc. Chem. Res. 2018;51:2926–2936. doi: 10.1021/acs.accounts.8b00336. [DOI] [PubMed] [Google Scholar]
Associated Data
This section collects any data citations, data availability statements, or supplementary materials included in this article.


