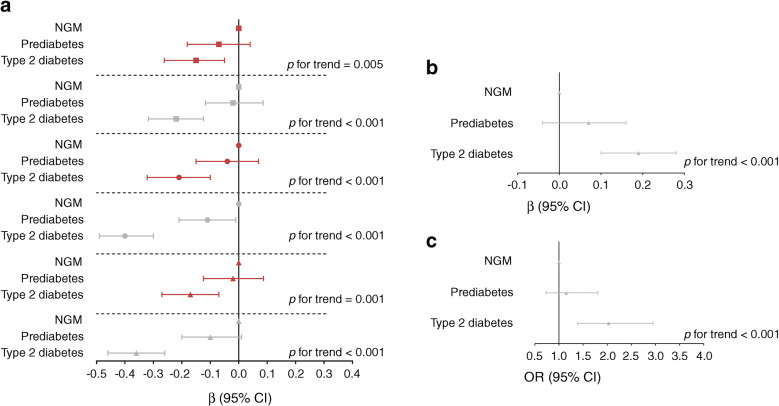
Fig. 3.
Standardised associations (expressed as β [or OR for outcome neuropathic pain] with 95% CIs) of prediabetes and type 2 diabetes with (a) nerve function, (b) VPT and (c) neuropathic pain, adjusted for age, sex, height, skin temperature, education, smoking, alcohol consumption, mobility, CVD (history), kidney function, waist circumference and inflammation. The p values indicate linear trend analysis among NGM, prediabetes and type 2 diabetes. Red squares represent sural SNAP amplitude, grey squares represent sural NCV, red circles represent peroneal CMAP amplitude, grey circles represent peroneal NCV, red triangles represent tibial CMAP amplitude and grey triangles represent tibial NCV

