

Abstract
Currently TAR DNA binding protein 43 (TDP-43) pathology, underlying Amyotrophic Lateral Sclerosis (ALS), remains poorly understood which hinders both clinical diagnosis and drug discovery efforts. To better comprehend the disease pathophysiology, positron emission tomography (PET) and multi-parametric magnetic resonance imaging (mp-MRI) provide a non-invasive mode to investigate molecular, structural, and neurochemical abnormalities in vivo. For the first time, we report the findings of a longitudinal PET-MR study in the TDP-43A315T ALS mouse model, investigating disease-related changes in the mouse brain. 2-deoxy-2-[18F]fluoro-D-glucose [18F]FDG PET showed significantly lowered glucose metabolism in the motor and somatosensory cortices of TDP-43A315T mice whereas metabolism was elevated in the region covering the bilateral substantia nigra, reticular and amygdaloid nucleus between 3 and 7 months of age, as compared to non-transgenic controls. MR spectroscopy data showed significant changes in glutamate + glutamine (Glx) and choline levels in the motor cortex and hindbrain of TDP-43A315T mice compared to controls. Cerebral blood flow (CBF) measurements, using an arterial spin labelling approach, showed no significant age- or group-dependent changes in brain perfusion. Diffusion MRI indices demonstrated transient changes in different motor areas of the brain in TDP-43A315T mice around 14 months of age. Cytoplasmic TDP-43 proteinaceous inclusions were observed in the brains of symptomatic, 18-month-old mice, but not in non-symptomatic transgenic or wild-type mice. Our results reveal that disease- and age-related functional and neurochemical alterations, together with limited structural changes, occur in specific brain regions of transgenic TDP-43A315T mice, as compared to their healthy counterparts. Altogether these findings shed new light on TDP-43A315T disease pathogenesis and may prove useful for clinical management of ALS.
Keywords: Amyotrophic Lateral Sclerosis, TDP-43, Positron Emission Tomography, Magnetic Resonance Imaging, Magnetic Resonance Spectroscopy, Multimodal Imaging
1. Introduction
Amyotrophic lateral sclerosis (ALS) is a fatal progressive neurodegenerative disorder in which the loss of upper and lower motor neurons leads to paralysis, with a typical disease course of 1 to 5 years. Most forms of ALS are sporadic (sALS), however about 10% of patients have an inherited familial form of the disease (fALS) and a clear family history (Chia et al., 2018). Understanding of ALS genetics began with the discovery of dominant causative mutations in the gene encoding copper/zinc superoxide dismutase 1 (SOD1) in about 20% of fALS cases and in about 1% of sporadic cases (Hardiman and van den Berg, 2017). Subsequently, other familial forms of ALS with atypical disease features were linked to mutations in several other genes including C9orf72, FUS, TDP-43 (Al-Chalabi et al., 2017). One of the neuropathological hallmarks of ALS is the presence of ubiquitylated neuronal cytoplasmic inclusions (NCIs) in upper and lower motor neurons (Leigh et al., 1991). In 2006, the 43 kDa TDP-43 protein has been identified as the major component of NCIs in sALS and SOD1–negative fALS, as well as sporadic and familial frontotemporal lobar dementia (FTLD) (Neumann et al., 2006). TDP-43 is a highly conserved ubiquitously expressed nuclear protein with two RNA recognition motifs (Gao et al., 2018). Under normal conditions, TDP-43 shuttles between the nucleus and the cytoplasm and is involved in gene splicing and micro RNA biogenesis. Furthermore, mutant fragments of TDP-43 were detected in post-mortem ALS neuronal tissues suggesting that abnormal molecular-weighted TDP-43 could be a causative protein in these disorders (Neumann et al., 2006). Albeit TDP-43 proteinopathy is a common pathological feature in human ALS, the mechanism related to pathogenesis is poorly understood. The missense mutation, Ala-315-Thr (A315T) was identified as a candidate gene in familial ALS through the sequencing of the TDP-43 gene, thereby establishing a connection between mutant TDP-43 proteinopathy and neurodegeneration (Gitcho et al., 2008). Although TDP-43 mutations are not a common feature in familial ALS, similar pathological observations were made in sporadic ALS (Kabashi et al., 2008). Wegorzewska and colleagues reported the first transgenic TDP-43 model, expressing the TDP-43 A315T mutant transgene under the mouse prion protein promoter (Prp), which was created on a hybrid C57BL/6 and CBA genetic background (Wegorzewska et al., 2009). These mice were reported to develop gait abnormalities starting from about three months onwards. However, the TDP-43A315T mouse model, now available on a 100% C57BL6/J congenic genetic background from the Jackson Laboratory (stock number 010700), was reported to develop an early intestinal blockage that prevents the disease phenotype progression and leads to premature sudden death (Guo et al., 2012, Esmaeili et al., 2013). Herdewyn et al. showed that by replacing the standard rodent food pellets with an easily digestible gel diet, one can by-pass the gastrointestinal dysfunction and allow time for pathology to develop in the brain and spinal cord of these mice (Herdewyn et al., 2014). Both male and female TDP-43A315T mice develop significant motor impairment, with deficits appearing earlier and progressing faster in males.
Discovering biomarkers for ALS pathology has the potential to diagnose patients at an early disease stage, which is essential to provide optimal patient care and disease management. Preclinical research based on the use of transgenic ALS mouse models has become an essential part of biomarker discovery and novel preclinical drug evaluation in ALS (Perrin, 2014). In vivo imaging such as positron emission tomography (PET), magnetic resonance imaging and spectroscopy (MRI-MRS) have shown to provide unique insights into complex biological processes. These techniques allow the temporal study of individual animals over time, enabling the assessment of disease progression in transgenic animal models. In this regard, non-invasive imaging of the TDP-43A315T transgenic mouse model may help us elucidate the pathophysiology and identify disease-related metabolic and structural changes that may be translated into clinical research. Therefore, we investigated, for the first time, the effect of human TDP-43A315T mutant protein expression on the mouse cerebrum through multimodal in vivo PET-MR imaging, combining [18F]FDG PET, diffusion tensor imaging (DTI), arterial spin labeling (ASL) perfusion MR imaging and MR spectroscopy (MRS).
2. Materials & methods
2.1. Experimental design
Using PET-MR imaging, we aimed to non-invasively investigate physiological changes in the mouse cerebrum associated with human A315T mutant TDP-43 expression from early- to late-stage pathology, in accordance with previous studies (Herdewyn et al., 2014, Beel et al., 2018). [18F]FDG-PET images were acquired simultaneously with high-resolution MR images (section 2.4) whereas a separate scan session was included for more time-consuming MRS, DTI, and ASL perfusion MR scans (section 2.5). A total of 36 transgenic female mice and 14 non-transgenic female littermates were included in this imaging study. The number of scanned animals varies per time point due to unexpected deaths and inclusion of novel animals as breeding only yielded a small number of animals per litter. Dropouts could not be linked to a specific pathology. A detailed description of the cohort characteristics and experimental timeline is shown in Fig. 1. A subgroup of TDP-43A315T mice were included for histological analysis. For PET imaging, 5 TDP-43A315T transgenic mice and 7 non-transgenic controls continued through all five time points – for MR imaging/spectroscopy, this was 6 and 7 mice, respectively. Three TDP-43A315T animals died within 7 days of the third MR session (T3) but were not symptomatic prior to scanning. Two more transgenic mice died within 7 days of the last PET imaging session (T4).
Fig. 1.

Experiment timeline. T1-T5 indicate all time points where in vivo molecular imaging was performed, including magnetic resonance spectroscopy (MRS), diffusion tensor imaging (DTI), and perfusion MR imaging with arterial spin labeling (top panel). [18F]-fluorodeoxyglucose ([18F]FDG) positron emission tomography (PET) combined with anatomical MRI was performed in the same cohort, but in separate scan sessions (bottom panel). Each panel describes the age (mean ± standard deviation) and amount of animals in the respective TDP-43A315T transgenic and non-transgenic control groups. Abbreviations: TDP-43: mice transgenic for the human TAR DNA binding protein 43 carrying the A315T mutation; ctrl: non-transgenic control mice.
2.2. Transgenic mice
All experiments were performed in accordance with institutional guidelines and compliant with the national and the European Communities Council Directive (2010/63/EU). The Animal Research Committee of the KU Leuven University, Belgium approved the study protocol (P075/2016).
Prp-hTDP-43A315T transgenic mice were purchased from the Jackson Laboratory (stock number 010700, Bar Harbor, ME, USA), and back-crossed for 10 generations into a congenic C57BL/6 J background, leading to a pure C57BL/6 J background. All animals were housed in a conventional animal facility in regular mouse cages. Mice were given gel food (DietGel®31 M, ClearH20, Maine, USA) from 60 days postpartum. Food and water were made available ad libitum. Body weight, body appearance and motor performance were monitored weekly. Onset of gait abnormalities was defined by the appearance of a swimming gait (Herdewyn et al., 2014). A number of mice developed ulcerative dermatitis in the rostral back region, which is a common effect of ageing in C57BL/6 mice (Hampton et al., 2012). Mice were treated with dermal cream (20 mg/g fusidic acid + 1 mg/g betamethasone, topical administration) for a maximum of 14 days and their nails were clipped.
2.3. Animal procedures
Before and during imaging procedures, mice were anaesthetized with 1–2% isoflurane in 100% oxygen. Mice were then placed in an MRI-compatible animal bed by placing the nose of the mouse in a nose cone, restraining it with a bite bar and custom-made outer ear-inserts. Respiration and body temperature were continuously monitored and maintained at 60–100 breaths min−1 and 37.0 ± 1.0 °C, respectively. Prior to tracer injection, blood glucose was measured in each individual animal.
2.4. Simultaneous in vivo [18F]FDG PET – MR imaging
Simultaneous [18F]FDG PET-MR imaging was performed on an Albira Si PET insert (Bruker, Ettlingen, Germany) in combination with a 7 Tesla (T) MR scanner with an actively shielded gradient set of up to 200 mT m−1 (Biospec 70/30, Bruker Biospin, Ettlingen, Germany). The PET insert has a 0.9–1 mm spatial resolution, 12% sensitivity, and 80x150 mm field of view. The [18F]FDG radiotracer was prepared using an IBA 18/9 cyclotron (Ion Beam Applications, Louvain-La-Neuve, Belgium) and [18F]FDG synthesis module. After overnight fasting, mice were injected with approximately 10.4 ± 1.8 MBq of [18F]FDG into in the tail vein using a 0.9% saline solution (maximum volume < 200 µL). Mice remained anaesthetized throughout the 30 min uptake period whereafter a 30 min static scan was initiated (Wong et al., 2011, Casteels et al., 2013). List-mode data were reconstructed in a single frame using the Maximum-Likelihood Expectation-Maximization algorithm (MLEM; 12 iterations). Scans were randoms and scatter corrected, no attenuation correction was performed. Data were collected in a 32 × 32 mm matrix with a reconstructed voxel size of 0.5 mm.
To visualize signal intensity changes and for co-registration of PET images, a T2-weighted 3D TurboRARE protocol was acquired simultaneously with the following acquisition parameters: repetition time (TR) 1000 ms, echo time (TE) 12 ms, FOV 24 × 15 × 8.3 mm, matrix size 256 × 160 × 88, RARE factor 10, number of averages = 1.
First, PET and T2-weighted MR images were co-registered in the mouse native space. Subsequently, T2-weighted MR images of the cerebrum of each individual mice were co-registered to the Mirrione mouse brain atlas whereafter the same rigid transformation was applied to the PET scans using PMOD version 3.8 software (PMOD Technologies, Zurich, Switzerland). Relative regional glucose metabolism was determined by count normalizing the regional [18F]FDG uptake to the whole-brain uptake. Whole-brain uptake did not significantly differ between TDP-43A315T mice and controls (p > 0.05), nor was there a significant change over time (p > 0.05). The p-values for fixed effects were: 0.18 for factor ‘time’, 0.58 for factor ‘group’, and 0.84 for the group*time intercept. Volume-of-interest (VOI)-based analysis was executed using a predefined VOI map including 20 anatomical regions of mice with a C57BL/6 J background. Voxel-wise analysis was performed using Statistical Parametric Mapping 12 (SPM12, Wellcome Department of Cognitive Neurology, London, United Kingdom). Spatially normalized images were masked to exclude extra-cerebral signal.
2.5. In vivo MR imaging
MRS, DTI and perfusion MR acquisitions were performed using a small-animal 9.4 T MR scanner (Biospec 94/20, Bruker Biospin) with a horizontal bore of 20 cm and equipped with an actively shielded gradient set (600 mT m−1, inner diameter 11.7 cm). MR data were acquired using a linear polarized resonator (7.2 cm diameter) for transmission, combined with a mouse brain surface coil for receiving (both Bruker Biospin).
2.5.1. 1H-magnetic resonance spectroscopy
MR spectra were acquired for volumes in the motor cortex and the hindbrain with a voxel size of 2 × 2.5 × 1.5 mm3. The spectroscopy voxel was placed by a single experienced acquisition operator, using T2-weighted 2D RARE images (effective TE 50 ms, matrix 256 × 256 and 300 µm slice thickness) and the Mirrione/Paxinos mouse brain atlas. The hindbrain voxel covered the following nuclei: the hypoglossal, medial vestibular nucleus, and the dorsal motor nucleus of the vagus nerve. MR spectra were acquired using a PRESS pulse sequence as previously reported, with the following parameters: TR = 1800 ms, TE = 20 ms, and number of averages = 320 for motor cortex = 640 for hindbrain, bandwidth = 2000 Hz, number of points = 2048, spectral width = 4006 Hz (Weerasekera et al., 2018). Water suppression was optimized using VAPOR. An unsuppressed water spectrum (TE = 20 ms, TR = 1400 ms, number of averages = 4) was acquired before each 1H-MR spectrum (water suppressed) for quantification/ referencing. Shimming was performed using FASTMAP, resulting in a final water line width at half height of less than 16 Hz. In order to minimize baseline distortions outer volume pre-saturation was performed. Spectra were processed using jMRUI v6.0, examples of MR spectra with residuals are provided in Supplementary file 1 (Naressi et al., 2001). Spectra were phase corrected and a HLSVD filter was applied to remove the residual water signal. No voxel segmentations were performed in this study. Only metabolites with a Cramer-Rao lower bound <25% were considered for quantification, which excluded glutamine quantification with QUEST. Metabolites were quantified with the QUEST algorithm in jMRUI using a simulated (NMRScopeB) metabolite basis set (Ratiney et al., 2004). Results are reported in reference to the non-suppressed water signal. A total of 16 brain metabolites (alanine, aspartic acid, total creatine, choline, γ-aminobutyric acid (GABA), glycine, glucose, glutamate, glutamine, N-acetyl aspartate (NAA), myo-inositol, lactate, phosphoethanolamine, scyllo-inositol and taurine were quantified. Only the sum of glutamate and glutamine concentrations, reported as Glx, were analyzed in this study. MR spectra acquired in the motor cortex had a signal to noise ratio (SNR) > 15 and a line-width of the unsuppressed water signal at half height (FWHM) of <18 Hz (10 ± 3 Hz); MR spectra acquired in the hindbrain had an SNR > 11 and a line-width of <20 Hz (12 ± 3 Hz.
2.5.2. Arterial spin labeling, diffusion tensor imaging and T2-weighted MRI
Perfusion maps were recorded from a single 1 mm thick axial forebrain slice covering the motor cortex, striatum and nucleus accumbens using a flow-sensitive alternating inversion recovery (FAIR) approach (Kim and Tsekos, 1997). ASL MR image acquisition was as previously reported (Oosterlinck et al., 2011, Govaerts et al., 2019). In brief, a rapid acquisition with relaxation enhancement (RARE) readout was used with the following specific parameters: TR = 18 s, TE = 5.2 ms, FOV 2.5 × 2.5 cm, matrix 128 × 128 with partial Fourier acceleration to 128 × 72, 14 inversion times from 20 to 8000 ms, and using an inversion hyperbolic secant pulse of 14 ms with a slab thickness of 1.6 mm. Fractional anisotropy (FA) and mean diffusivity (MD) were determined using a two-dimensional single shot echo planar spin echo acquisition with the following specific parameters: 13 slices of 0.6 mm thick with 0.12 mm gap, TR/TE = 7000/52 ms, acquisition matrix 128 × 128 zero filled to 256 × 256 resulting in a spatial resolution of 98 × 98 µm, fat suppression and diffusion parameters: δ/Δ = 6/14 ms, 15 non-co-linear directions, 6 b-values (250 500 750 1000 1500 3000 s mm−2).
Perfusion MR images were processed using the Paravison 5.1 software (Bruker Biospin). Absolute cerebral blood flow (CBF) values were calculated using the T1 difference method and assuming an arterial T1 of 2.4 s. Diffusion data was analyzed using region-based analysis in DSI Studio (http://dsi-studio.labsolver.org; with corrections for eddy currents and EPI distortions); fractional anisotropy (FA), radial diffusivity (RD) and mean diffusivity (MD) were calculated for the following anatomical regions: striatum, motor cortex and hindbrain. Due to logistical issues, ASL and DTI acquisitions could only be performed at T3-T5. Regions-of-interest (ROIs) used for analysis are depicted in Supplementary file 2.
2.6. Immunohistochemical analysis
Mice were classified as end-stage (ES) when presenting with following symptoms: immobility, lethargy, or absence of righting reflex, and were euthanized accordingly. In case mice lost more than 20% of their initial body weight, mice were sacrificed. A total of 9 transgenic (n = 5 symptomatic; n = 4 non-symptomatic) and 4 wild-type control mice were included for immunohistochemical analysis. After perfusion with 4% paraformaldehyde, the brains were fixed in 4% paraformaldehyde for at least 1 week, dehydrated overnight, and embedded in paraffin blocks. Sections of 5 μm thickness were cut and dried overnight.
The TDP-43 cytoplasmic aggregates were labeled using an antibody against phosphorylated TDP-43 (pTDP), clone 1D3 (MABN14, rat monoclonal, 1/100, Merck Millipore, MA, USA) with a Dako autostainer Link 48, according to the manufacturer’s protocol (Dako, Belgium). Briefly, after pre-treatment (pH = 6) for antigen retrieval and deparaffinization, the sections were treated with peroxidase blocking reagent (Envision Flex Peroxidase-Blocking Reagent, Dako) for 5 min. Afterwards, a biotinylated anti-rat or anti-rabbit secondary antibody was used, followed by an ABC reaction to increase the detected signal (Vectastain Elite ABC HRP Kit, Vector labs, CA, USA). 3,3′-diaminobenzidine (Liquid DAB + Substrate Chromogen System, Dako) was used as a chromogen to yield brown reaction products. Counterstaining with hematoxylin was performed. The slides were microscopically analyzed with a Leica DM2000 LED microscope and images were taken with a Leica DFC7000 T camera (Leica Microsystems, Heidelberg, Germany).
2.7. Statistical analysis
Reported values are described as mean ± standard deviation unless indicated otherwise. All statistical analyses, except for voxel-wise analysis of PET data, were performed using JMP and PRISM software (SAS Institute Inc., NC, USA; GraphPad Software, Inc., CA, USA). Body weight was analyzed using the Mann-Whitney U test followed by Bonferroni multiple testing correction. PET VOI-based data, MRS, DTI and perfusion MR data were analyzed using the standard least squares model, employing REML (restricted maximum likelihood estimation) with Tukey-Kramer post-hoc adjustments. Fixed effects included: pathology (‘group’), time point (‘time’) and the group*time intercept. The term ‘Subject’ was added as a random effect. PET voxel-wise analysis (SPM12) was performed using a 2 sample t-test for cross-sectional comparisons and a flexible factorial design taking into account factors ‘time point’ and ‘group’. SPM analysis was performed using a 0.8 relative threshold of mean image intensity, without global normalization. T-maps were interrogated at a pheight ≤ 0.005 (uncorrected) peak level and an extent threshold of kE > 200 voxels (1.6 mm3). Only significant clusters with pheight < 0.05 (corrected for multiple comparisons) were retained. Exceptions on pcluster were accepted for clusters with a plausible neurobiological basis and in light of previous ALS research. Survival analysis was performed using the Mantel-Cow method. A p-value < 0.05 was accepted as statistically significant.
2.8. Data and code availability
The datasets used and/or analyzed during the current study are available from the corresponding author on reasonable request.
3. Results
3.1. Dynamic changes to glucose uptake in cortical, striatal and hindbrain regions in TDP-43A315T mice
To assess the effect of TDP-43A315T expression on cerebral glucose uptake, we performed longitudinal in vivo [18F]FDG-PET imaging. Voxel-wise analysis showed decreased relative [18F]FDG uptake (i.e. normalized to whole-brain [18F]FDG uptake) in a region covering the unilateral motor- and somatosensory cortex of TDP-43A315T transgenic mice, as compared to controls (−15.8 ± 3.3%; T1 vs. T2; Fig. 2 a). In the same time period, glucose uptake significantly increased (+8.0 ± 5.5%) in a cluster covering the substantia nigra, amygdaloid and reticular nucleus, extending towards the brain stem, in transgenic TDP-43A315T mice (Fig. 2 b). Between T1 and T3, transgenic mice also developed hypometabolism in the left lateral striatum (−9.0 ± 5.1%; Fig. 2 c). No significant changes to [18F]FDG uptake were found at T4. A more detailed description of the voxel-wise analysis is shown in Table 1.
Fig. 2.

Relative [18F]FDG uptake shows dynamic regional changes in TDP-43A315T transgenic mice. Regions with statistically significant alterations in glucose metabolism are overlaid on coronal brain sections. Brain sections show significantly (a) decreased (blue) glucose metabolism in a cluster comprising the left motor and somatosensory cortex and (b) elevated (yellow) glucose uptake in the region of the substantia nigra, amygdaloid and reticular nucleus, in transgenic TDP-43A315T mice between time point 1 and 2 (T1 vs. T2), as compared to non-transgenic mice. (c) From T1 to T3, [18F]FDG uptake decreased in transgenic mice in a cluster covering the unilateral striatum, as compared to non-transgenic mice. Functional T-maps are overlaid on coronal brain sections at pheight < 0.005, indicating the significance at the voxel level (flexible factorial model, SPM). The approximate age of the mice at the mentioned time points is: T1: 3.5 months, T2: 7 months, T3: 11.5 months. Abbreviations: L, left; R, right. (For interpretation of the references to colour in this figure legend, the reader is referred to the web version of this article.)
Table 1.
Voxel-wise [18F]FDG PET analysis.
| Peak location for the cluster in the group comparison (at pheight < 0.005 uncorrected, KE > 200) | ||||||
|---|---|---|---|---|---|---|
| Cluster level |
Voxel level |
Structure |
||||
| pcorr | KE | T | puncorr | Intensity difference (%) | Name | |
| Controls Δ(T2-T1) < TDP-43A315T Δ(T2-T1) | 8.3*10−5 | 6720 | 5.43 | <0.001 | +8.0 ± 5.5% | Bilateral substantia nigra, amygdaloid nucleus and reticular nucleus |
| 4.71 | <0.001 | |||||
| 4.6 | <0.001 | |||||
| Controls Δ(T2-T1) > TDP-43A315T Δ(T2-T1) | 9.3*10−6 | 8941 | 7.33 | <0.001 | −15.8 ± 3.3% | Unilateral motor and somatosensory cortex |
| 4.42 | <0.001 | |||||
| 3.24 | 0.002 | |||||
| Controls Δ(T3-T1) > TDP-43A315T Δ(T3-T1) | 0.105 | 483 | 7.74 | <0.001 | −9.0 ± 5.1% | Unilateral striatum |
Summary of the SPM analysis, indicating the anatomical regions where, at a given time point, a cluster with statistically significant alterations in regional glucose metabolism was present. Peak locations for the clusters in the group comparison are given at the threshold pheight < 0.005 (uncorrected) and cluster extent > 200. Abbreviations: p(un)corr at the cluster level, the likelihood (p) of finding a voxel with this or higher T-value, p-value (un)corrected for the search volume; KE, cluster extent; T, indication of statistical significance. The age of the mice at T1-T3 scan sessions are: T1: 3.5 months, T2: 7 months, T3: 11.5 months. Intensity difference values are indicated as mean ± standard deviation.
3.2. Perturbation of Glx and choline levels associated with TDP-43A315T as indicated by MR spectroscopy
To assess potential neurometabolic alterations in TDP-43A315T mice over time, we acquired MR spectra from a voxel in the motor cortex and hindbrain. Typical MR spectra obtained from the motor cortex, including the voxel localization are shown in Supplementary file 2.
Of the metabolites, Glx and choline demonstrated time- and group-dependent differences in the motor cortex (Fig. 3 a). Glx levels of TDP-43A315T mice were significantly higher at early-stage acquisitions (T1-T2) in comparison with non-transgenic controls (F[group x time]4,74 = 6.3; p < 0.001; T1: +28.3%, p = 0.0018; T2: +36.3%, p < 0.001). From T3 to T5, also choline levels remained consistently higher in TDP-43A315T mice as compared to healthy littermates (F[group x time]4,74 = 6.3; p < 0.001; T3: +26.7%, p = 0.03; T5: +37.2%, p < 0.001). It should be noted that choline levels visualized by MRS contain contributions from unbound free choline, glycerophosphorylcholine (GPC), phosphorylcholine (PC) and are often referred to as ‘total choline’ (tCho) or just choline.
Fig. 3.

Glx and choline levels in the motor cortex and hindbrain are affected by TDP-43 proteinopathy over time, as shown by MRI-guided 1H-MRS. Evaluation of selected metabolites in the motor cortex and hindbrain using MRI-guided 1H-MRS. Overview of the four main neurometabolite concentrations, including Glx (glutamate + glutamine), N-acetylaspartate, creatine and choline in the motor cortex (a) and hindbrain (b). Metabolite concentrations in TDP-43A315T and non-transgenic controls are displayed over time, visualized in dot plots. Time points mentioned in this figure are in correspondence with following approximate age of the animals: T1: 2 months, T2: 6 months, T3: 9 months, T4: 13.5 months, T5: 16 months. Restricted maximum likelihood estimation. * p < 0.05, ** p < 0.01, *** p < 0.001.
In the hindbrain, Glx levels depicted significant disease-related alterations (Fig. 3 b). Glx concentrations showed both early- and late-stage group-dependent differences (F[group x time]4,86 = 8.5; p < 0.001). With respect to controls, we found Glx levels significantly increased at T1 (+31.2%, p = 0,002), and subsequently decreased at T4 (-35.2%, p < 0.001). Both groups showed an age-dependent drop in Glx concentrations between T3 and T5 (F[time]4,86 = 11.7; p < 0.001; T3-T5: p < 0.001 in both groups). Creatine levels were influenced by the age of the animals, but not by pathology (F[time]4,86 = 5.4; p < 0.001). Compared to controls, TDP-43A315T mice showed a modest, but significant, increase in choline levels at late-stage time point T5 (F[group]4,86 = 7.1; +22.0%, p < 0.001; T5: p = 0.02), though time and interaction effects were not significant (p > 0.05). No significant changes were observed in other neurometabolite levels (data not shown).
3.3. No age- or group-related changes to regional cerebral blood perfusion
Regional CBF values, obtained from ROIs in the motor cortex and striatum are represented in Fig. 4. No significant changes in CBF were observed between the two groups in motor cortices and striatal ROIs.
Fig. 4.

No detectable changes to cerebral blood perfusion were found in motor areas of the cerebrum in TDP-43A315T mice. Dot plots display perfusion values for the bilateral motor cortex (a-b) and striatum (c-d) of TDP-43A315T mice and respective non-transgenic controls. The dotted line represents repetitive measures in the same animals. TDP-43 mice did not present with significantly different perfusion values. Time points mentioned in this figure are in correspondence with following approximate age of the animals: T3: 9 months, T4: 13.5 months, T5: 16 months.
3.4. Time-specific but limited changes to DTI metrics observed in ALS mice
A summary of regional DTI metrics for the two groups are listed in Table 2. Significant cross-sectional differences in the DTI-based FA, MD and RD were observed between TDP-43A315T and control mice at T4. In the striatum, a significant decrease in FA (F[group x time]2,48 = 4.6; p = 0.01; T4: −18.5%, p = 0.006) and increase in RD (F[group x time]2,48 = 6.8; p = 0.003; T4: −15.6%, p < 0.001) was present in transgenic mice compared to healthy controls. Of note, the group effect was non-significant for FA (p > 0.05). In addition, a significant difference in RD was present in the motor cortex, which was not affected by the group*time interaction effect (F[group]1,17 = 8.7; p = 0.009; F[time]2,28 = 7.6; p = 0.002; T4: p = 0.03). A significant increase in MD in the hindbrain region of both groups was also observed (F[group x time]2,40 = 6.1; p = 0.005; F[time]2,40 = 14.8; p < 0.0001; T4: p = 0.03).
Table 2.
Assessment of microstructural changes using diffusion tensor imaging.
| Motor cortex |
Striatum |
Hindbrain |
|||||
|---|---|---|---|---|---|---|---|
| Controls | TDP-43A315T | Controls | TDP-43A315T | Controls | TDP-43A315T | ||
| FA | T3 | 0.25 ± 0.03 | 0.22 ± 0.03 | 0.22 ± 0.02 | 0.22 ± 0.02 | 0.35 ± 0.05 | 0.32 ± 0.05 |
| T4 | 0.24 ± 0.03 | 0.20 ± 0.05 | 0.27 ± 0.04 | 0.22 ± 0.03 Ω | 0.32 ± 0.04 | 0.30 ± 0.05 | |
| T5 | 0.21 ± 0.02 | 0.20 ± 0.03 | 0.20 ± 0.02 | 0.21 ± 0.04 | 0.24 ± 0.03 | 0.26 ± 0.03 | |
| AD(10−3 mm2/sec) | T3 | 0.77 ± 0.03 | 0.76 ± 0.02 | 0.75 ± 0.03 | 0.75 ± 0.03 | 0.74 ± 0.09 | 0.72 ± 0.09 |
| T4 | 0.76 ± 0.02 | 0.76 ± 0.04 | 0.77 ± 0.03 | 0.80 ± 0.05 | 0.90 ± 0.13 | 0.80 ± 0.09 | |
| T5 | 0.75 ± 0.02 | 0.75 ± 0.05 | 0.76 ± 0.02 | 0.77 ± 0.02 | 0.70 ± 0.06 | 0.72 ± 0.04 | |
| RD (10−3 mm2/sec) | T3 | 0.53 ± 0.02 | 0.55 ± 0.03 | 0.54 ± 0.02 | 0.55 ± 0.03 | 0.45 ± 0.07 | 0.45 ± 0.08 |
| T4 | 0.53 ± 0.02 | 0.56 ± 0.03Δ | 0.52 ± 0.03 | 0.59 ± 0.06Θ | 0.61 ± 0.13 | 0.51 ± 0.11 | |
| T5 | 0.55 ± 0.01 | 0.56 ± 0.02 | 0.56 ± 0.01 | 0.56 ± 0.02 | 0.48 ± 0.04 | 0.49 ± 0.02 | |
| MD (10−3 mm2/sec) | T3 | 0.61 ± 0.02 | 0.62 ± 0.03 | 0.61 ± 0.02 | 0.61 ± 0.02 | 0.55 ± 0.08 | 0.54 ± 0.08 |
| T4 | 0.61 ± 0.02 | 0.61 ± 0.03 | 0.60 ± 0.03 | 0.64 ± 0.05 | 0.71 ± 0.13 | 0.60 ± 0.01Σ | |
| T5 | 0.61 ± 0.02 | 0.63 ± 0.020 | 0.63 ± 0.01 | 0.63 ± 0.01 | 0.55 ± 0.05 | 0.56 ± 0.02 | |
This table depicts the region-of-interest (ROI) analysis of fractional anisotropy (FA), axial diffusion (AD), radial diffusion (RD) and mean diffusion (MD), measured in the region of the motor cortex, striatum, and hindbrain of TDP-43A315T transgenic mice and non-transgenic controls. Time points mentioned in this figure are in correspondence with following approximate age of the animals: T3: 9 months, T4: 13,5 months, T5: 16 months. Values represent mean ± standard deviation. Significant alterations in MR diffusion were obtained by using the restricted maximum likelihood estimation model. Δ p < 0.05, Ω and Σ p < 0.01, Θ p < 0.001.
3.5. Survival analysis and neuropathology of TDP-43A315T mice
As expected, TDP-43A315T mice portrayed a significantly lower survival, as compared to non-transgenic mice, (X2 = 12.9, p < 0.001; Fig. 5 a). As previously described, disease onset and duration were highly variable (Beel et al., 2018, Herdewyn et al., 2014). Approximately 53.8% of transgenic animals developed symptoms throughout the experiment. Mean age at symptom development was 310 ± 172 days and mice survived on average 78 ± 83 days following onset of symptoms. The weight of the mice significantly increased with age, but did not differ between groups (F[time]14,413 = 23.6; p < 0.001; Fig. 5 b). Cytoplasmic aggregates that are positive for phosphorylated TDP-43 (pTDP-43) were found in pyramidal neurons of layer V in the frontal cortex in symptomatic, 18 months old mice (see Supplementary file 3).
Fig. 5.
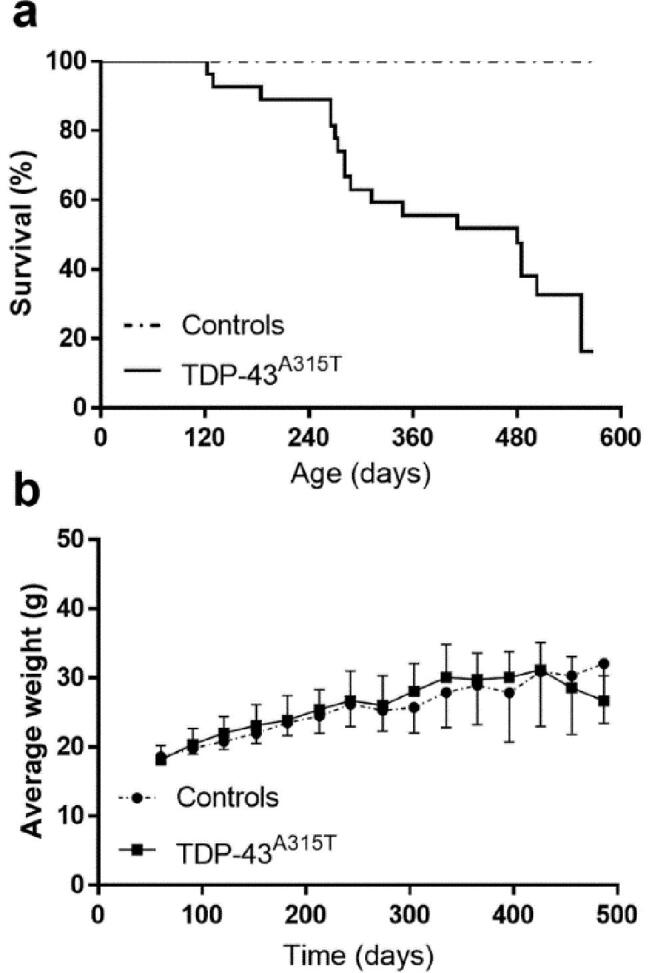
Life span and weight analysis of TDP-43A315T transgenic mice. (a) Transgenic mice showed high variability regarding life span ranging from 122 to 554 days. (b) Expression of TDP-43A315T did not have a significantly altered body weight in comparison with non-transgenic mice.
4. Discussion
In this study, we systematically and non-invasively characterized the evolution of brain microstructural and metabolic alterations that occur in the TDP-43A315T mouse model, which has been poorly characterized in vivo, using a translational PET-MRI-MRS approach. In our effort, we have generated the first and only preclinical PET-MR TDP-43A315T study, clearly stating our exploratory findings and the limitations we encountered during execution of the study. We reported metabolic and functional imaging abnormalities, measured by [18F]FDG-PET, MR spectroscopy and diffusion MRI, together with cytoplasmic aggregation of phosphorylated TDP-43 in neurons of the frontocentral cortex in TDP-43A315T mice. These findings may have significant impact on the interpretation of TDP-43 proteinopathy in ALS patients, and probably represent just the “tombstone” of the underlying functional alterations of the neurons, as indicated by the reduction of glucose metabolism and the changes in neurotransmitter levels. Since these changes occurred in areas of the brain that are typically affected in ALS patients, such as the motor cortex, it is tempting to speculate whether such changes can be used for the early clinical diagnosis of ALS. Hypometabolism in the motor cortex has been demonstrated in ALS patients and may be combined with imaging markers to identify ALS patients as early as possible (D'Hulst et al., 2018).
Longitudinal [18F]FDG PET imaging data showed significantly lowered glucose metabolism in the motor and somatosensory cortices unilaterally, in parallel with an increase in the midbrain region, covering the bilateral substantia nigra, reticular and amygdaloid nucleus, and spreading towards the brain stem between three and seven months of age. By approximately one year of age, decreased glucose utilization also occurred in the unilateral striatum in transgenic mice, as compared to non-transgenic controls. These findings are in line with previously demonstrated metabolic patterns in ALS patients, where hypometabolism is generally found in the frontal and occipital lobes and relative hypermetabolism is present in the brainstem, amygdalae, cerebellum and medial temporal lobe (Agosta et al., 2018). Especially the unilateral predominance of our findings is an interesting observation. In about 98% of ALS patients, motor manifestations begin in one region of the body (Ravits et al., 2007) and are accompanied by unilateral, focal damage to motor neurons (in the motor cortex or spinal cord) that innervate the corresponding peripheral body regions. Hence, we may be observing a similar effect in TDP-43 A315T mice. To our knowledge, no previous data have been presented, examining disease-related changes in cerebral glucose metabolism in TDP-43 transgenic mice models. Due to differences in transgene, symptom development and life span, it remains difficult to compare these findings to those in other commonly used ALS rodent models, such as the SOD1 model. In this mouse model, carrying the SOD1G93A mutation, Lei et al. reported no significant effect on glucose utilization in motor-related brain regions (Lei et al., 2018). In addition, the correlation of behavioral symptoms to imaging findings may identify pivotal disease-related phenomena in future studies.
All metabolically altered regions (including cortex, striatum and midbrain regions) were shown to express the mutant transgene in neurons and glia, and could therefore be affected by A315T mutant TDP-43 pathology (Wegorzewska et al., 2009). Also in ALS patients, TDP-43 immunoreactive lesions were found in the previously mentioned regions (Cykowski et al., 2017). Given that [18F]FDG PET is an indicator of synaptic dysfunction and neurodegeneration, it is plausible that reduced [18F]FDG uptake in the motor cortex represents the pronounced neuronal loss and ubiquitin aggregate pathology in layer 5, as previously shown by histological analysis (Wegorzewska et al., 2009). Of note, decreased [18F]FDG uptake has been associated with mitochondrial dysfunction, and subsequent neuronal loss in several disorders (Herrero-Mendez et al., 2009, Tenney et al., 2014). Mutant TDP-43 was shown to accumulate in the mitochondria of neurons and impair respiratory complex I subunits, hereby directly causing disrupted cellular bioenergetics (Wang et al., 2016). This aberrant metabolic state may further explain the changes that we observed in several motor-related cerebral regions in TDP-43A315T transgenic mice. On the other hand, hypermetabolic patterns in the mid- and hindbrain may correspond to inflammation involving microglial activation. In the SOD1G93A model, Gargiulo et al. reported “microgliopathy” in this region surrounding several motor nuclei, using [18F]DPA-714 PET imaging of the translocator protein (TSPO), a well-known marker for neuroinflammation (Gargiulo et al., 2016).
We also examined changes in the neurochemical profile of the motor cortex and hindbrain of TDP-43A315T and control mice, using 1H-MRS. Our results showed significant changes in Glx and choline levels (representing choline, phosphocholine and glycerophosphocholine) in the motor cortex and hindbrain of TDP-43A315T mice, as compared to controls. Elevations in the Glx levels at the 2- and 6-month time points suggest an alteration in glutamatergic transmission creating an imbalance between the excitatory and inhibitory neuronal activity in both regions. In correspondence with our findings, Lei and colleagues showed increased levels of glutamate in the motor cortex of pre-symptomatic SOD1G93A transgenic animals (Lei et al., 2018, Weerasekera et al., 2018). The glutamate-glutamine cycling in the glia and neurons is a complex process, where the enzyme glutamine synthetase plays a vital role. Impairment of this enzyme, which is highly susceptible to oxidative damage, can lead to a decreased metabolism of glutamate to glutamine (Oliver et al., 1990). Thereby, an increase in tissue levels of glutamate/glutamine could also reflect impaired energy metabolism, similar to observations in transgenic mice of Huntington's disease (Jenkins et al., 2000).
In this study, a time- and group-dependent increase in total choline was observed in the motor cortex of transgenic mice at nine months. In the hindbrain, this increase was also present in 16-month-old mice. Choline-containing compounds are involved in pathways of phospholipid synthesis, but also degradation, as well as biosynthesis of neurotransmitter acetylcholine (Duarte et al., 2012). Elevated choline levels have been systematically observed in neurodegenerative diseases such as Alzheimer’s disease, Parkinson’s disease and multiple sclerosis (Firbank et al., 2002, Narayanan et al., 2006, Gonzalez-Toledo et al., 2006). Moreover, Duarte et al. reported brain choline levels to gradually increase as part of the normal ageing process and that this increase may be attributed to an increased release of water-soluble choline-compounds from cellular membranes (Duarte et al., 2014).
Previous studies have reported that a decrease in glutamatergic transmission activity may activate a compensatory mechanism such as regulation of a secondary messenger system (Belousov et al., 2001). Interestingly, in the hindbrain, one such mechanism may cause a late-stage increase in the expression of acetylcholine. The MRS signal of choline has been used to assess the alteration of acetylcholine level in the brain (Lindner et al., 2017). Therefore, the observed upregulation of choline levels at a later stage may be due to an upregulation of acetylcholine signaling following a decrease glutamate-mediated neurotransmission activity, as indicated by Glx measurements.
Remarkably, our study did not identify changes to NAA levels, which may be explained by neuronal loss being predominantly located in layer V of the motor cortex (Wegorzewska et al., 2009). Alterations in this subregion may consequently be too limited to be detected (e.g. due to partial volume effects and spatial resolution of preclinical imaging modalities) with in vivo imaging. One technical limitation of localized MR spectroscopy is the voxel positioning based on anatomical landmarks, which might differ in the transgenic and non-transgenic animals. We did show reduced [18F]FDG uptake in this region, which may represent a cellular, and not only a neuronal loss, and may be influenced by astroglial glutamate transport (Zimmer et al., 2017, Bouter et al., 2018, Ertay et al., 2017). As such, FDG uptake is not a specific marker for neuronal loss, offering a possible explanation for the absent correlation between NAA and [18F]FDG PET.
Assessing changes in cerebral blood flow (CBF) yields important information on the onset and progression of various pathological conditions (Yonas et al., 2005, Govaerts et al., 2019, Struys et al., 2017). However, up to date, perfusion MRI in animal models of ALS has not been implemented. CBF is tightly coupled to neuronal activity of the brain, and is often considered as an indirect measurement of the energy demands of the brain, similar to [18F]FDG PET. An increase in CBF is suggested to enhance the delivery of oxygen and substrates to the high-energy demand regions, and to facilitate the elimination of toxic byproducts of cerebral metabolism (Watts et al., 2018). A previous arterial spin labeled MR study demonstrated hypoperfusion in ALS patients compared to healthy subjects in the frontal, medial, middle cingulate cortices, and precuneus (Rule et al., 2010). In correspondence with clinical findings, spinal blood flow was progressively decreased at pre- and post-symptomatic stages in SOD1G93A mice, as detected by in vivo capillary imaging (Miyazaki et al., 2012). In this study, no significant age or group-related differences in basal CBF were observed in cerebral motor regions. It should be noted that anesthesia has a strong impact on cardiac function, brain function or microvascular hemodynamics, and the combination of all these effects could lead to modifications of CBF (Hendrich et al., 2001). Isoflurane anesthesia tends to increase CBF, which may have masked observations of subtle differences in perfusion values in the groups studied (Govaerts et al., 2019). On the other hand, possible effects of oxygen respiration were controlled by using a control group, assuming there would be no differential response of the disease to this respiratory protocol. Therefore, barbiturates such as a ketamine/xylazine combination may have been be a better choice of anesthetics. Alternatively, TDP-43 pathology may not be responsible for the perfusion changes seen in ALS patients (Rule et al., 2010). Diffusion MRI-based measures such as the FA, MD, RD and AD have been used to evaluate axonal and myelin integrity in the mouse cerebrum (Ontaneda et al., 2017, Hammelrath et al., 2016). Although no age-related changes in diffusion parameters were found for both groups, disease-associated changes were detected, but only in mice at approximately 14 months of age, suggesting that TDP-43A315T expression is associated with limited microstructural changes in motor-related regions of the mouse brain.
In the healthy brain, TDP-43 is predominantly localized in the nucleus where it is involved in RNA metabolism. Within TDP-43 proteinopathies, abnormal cleavage and phosphorylation (pS409/pS140) of the protein has been associated with nuclear depletion and formation of pathological cytoplasmic inclusions (Arai et al., 2006). Nevertheless, it is still unclear whether loss of TDP-43 function via nuclear depletion or gain of function by adverse effect of cytoplasmic TDP-43 or a combination of both causes neurodegeneration in ALS. We observed the presence of phosphorylated TDP-43 aggregates in the cortex of symptomatic, 18-month old mice, but not in the brains of younger animals. Interestingly, previous studies have revealed that nuclear depletion, which was not obvious from our staining (data not shown), is not required for TDP-43 neuronal toxicity (Arnold et al., 2013, Austin et al., 2014) and cytoplasmic TDP-43 is sufficient to cause neurodegeneration (Barmada et al., 2010) suggesting a major role of cytoplasmic TDP-43 in the disease progression. Despite the fact that ubiquitin-positive aggregates have been previously detected in this model, cytoplasmic inclusions positive for phosphorylated TDP-43 have not been described (Wegorzewska et al., 2009).
In retrospect, the group-based acquisition protocol constitutes a limitation to this study. Indeed, due to the limited amount of symptomatic TDP-43A315T mice per scan session, we were not able to assess neurochemical alterations in symptomatic vs. non-symptomatic mice in our statistical analysis. However, taking into account the variability in the life span and symptom onset of this cohort, we believe this study design to be suitable regarding both logistics as statistical analysis. To improve the detection of disease-related changes, one might opt for a dynamic acquisition protocol based on each animals’ individual disease progression in future studies.
5. Conclusions
The presented longitudinal in vivo PET-MR data has showed several disease-related neurochemical and neuropathological alterations in distinct brain regions of TDP-43A315T ALS mice, indicating that, multimodal imaging modalities such as PET and MR can form a powerful tool for longitudinal non-invasive follow-up of disease progression in preclinical animal models. Nevertheless, future studies are needed to provide a more in-depth understanding of TDP-43A315T-induced neuropathology.
CRediT authorship contribution statement
Akila Weerasekera: Conceptualization, Data curation, Formal analysis, Methodology, Investigation, Visualization, Writing - original draft. Melissa Crabbé: Conceptualization, Data curation, Formal analysis, Methodology, Investigation, Visualization, Writing - original draft. Sandra O. Tomé: Formal analysis, Investigation, Writing - original draft. Willy Gsell: Conceptualization, Methodology, Supervision, Writing - review & editing. Diana Sima: Methodology, Writing - review & editing. Cindy Casteels: Conceptualization, Methodology, Formal analysis, Supervision, Writing - review & editing. Tom Dresselaers: Supervision, Writing - review & editing. Christophe Deroose: Resources, Funding acquisition. Sabine Van Huffel: Methodology, Writing - review & editing. Dietmar Rudolf Thal: Methodology, Resources, Supervision, Validation, Writing - review & editing. Philip Van Damme: Conceptualization, Methodology, Resources, Supervision, Validation, Writing - review & editing. Uwe Himmelreich: Conceptualization, Funding acquisition, Methodology, Resources, Supervision, Writing - review & editing.
Declaration of Competing Interest
The authors declare that they have no known competing financial interests or personal relationships that could have appeared to influence the work reported in this paper. DRT received speaker honorary from Novartis Pharma AG (Switzerland) and Biogen (USA), travel reimbursement from GE-Healthcare (UK) and UCB (Belgium) and collaborated with Novartis Pharma AG (Switzerland), Probiodrug (Germany), GE-Healthcare (UK), and Janssen Pharmaceutical Companies (Belgium).
Acknowledgments
Acknowledgements
The authors wish to thank Begga Schevenels, Nicole Hersmus and Caroline Eykens for their assistance with animal breeding. We acknowledge the jMRUI team from the Czech Republic: Dr.Jana Starčuková, Dr. Zenon Starčuk jr and Dr. Michał Jabłonski for their technical support. AW is an Early Stage Research Fellow of the Marie Curie training network. MC is a research fellow of the Research Foundation - Flanders. PVD is a senior clinical investigator of the Research Foundation - Flanders and is supported by the ALS Liga België and the KU Leuven funds “Een Hart voor ALS” and “Laeversfonds voor ALS Onderzoek”.
Funding
This work was partially funded by the European project EC-FP7 MC ITN ‘TRANSACT’ 2012 (n° 316679), the KU Leuven program financing ‘IMIR’ (PF10/017), the KU Leuven grant (C1-C14-17-107), the Opening the Future Fund (KU Leuven), the Alzheimer Research Foundation (SAO-FRA; n° 2017/023), the Flemish Government initiated Flanders Impulse Program on Networks for Dementia Research (n°135043) and the Research Foundation - Flanders (n° G0F8516N).
Ethics approval and consent to participate
All applicable international, national, and/or institutional guidelines for the care and use of animals were followed. All procedures performed in studies involving animals were in accordance with the ethical standards of the institution (KU Leuven) at which the studies were conducted.
Footnotes
Supplementary data to this article can be found online at https://doi.org/10.1016/j.nicl.2020.102327.
Appendix A. Supplementary data
The following are the Supplementary data to this article:
References
- Agosta, F., Altomare, D., Festari, C., Orini, S., Gandolfo, F., Boccardi, M., Arbizu, J., Bouwman, F., Drzezga, A., Nestor, P., Nobili, F., Walker, Z., Pagani, M., 2018. Disorders E-ETFftPoF-PfDN Clinical utility of FDG-PET in amyotrophic lateral sclerosis and Huntington's disease. Eur. J. Nucl. Med. Mol. Imaging 45, 1546–1556. doi:10.1007/s00259-018-4033-0. [DOI] [PubMed]
- Al-Chalabi A., van den Berg L.H., Veldink J. Gene discovery in amyotrophic lateral sclerosis: implications for clinical management. Nat. Rev. Neurol. 2017;13:96–104. doi: 10.1038/nrneurol.2016.182. [DOI] [PubMed] [Google Scholar]
- Arai T., Hasegawa M., Akiyama H., Ikeda K., Nonaka T., Mori H., Mann D., Tsuchiya K., Yoshida M., Hashizume Y., Oda T. TDP-43 is a component of ubiquitin-positive tau-negative inclusions in frontotemporal lobar degeneration and amyotrophic lateral sclerosis. Biochem. Biophys. Res. Commun. 2006;351:602–611. doi: 10.1016/j.bbrc.2006.10.093. [DOI] [PubMed] [Google Scholar]
- Arnold E.S., Ling S.C., Huelga S.C., Lagier-Tourenne C., Polymenidou M., Ditsworth D., Kordasiewicz H.B., McAlonis-Downes M., Platoshyn O., Parone P.A., Da Cruz S., Clutario K.M., Swing D., Tessarollo L., Marsala M., Shaw C.E., Yeo G.W., Cleveland D.W. ALS-linked TDP-43 mutations produce aberrant RNA splicing and adult-onset motor neuron disease without aggregation or loss of nuclear TDP-43. Proc. Natl. Acad. Sci. U S A. 2013;110:E736–745. doi: 10.1073/pnas.1222809110. [DOI] [PMC free article] [PubMed] [Google Scholar]
- Austin J.A., Wright G.S., Watanabe S., Grossmann J.G., Antonyuk S.V., Yamanaka K., Hasnain S.S. Disease causing mutants of TDP-43 nucleic acid binding domains are resistant to aggregation and have increased stability and half-life. Proc. Natl. Acad. Sci. U S A. 2014;111:4309–4314. doi: 10.1073/pnas.1317317111. [DOI] [PMC free article] [PubMed] [Google Scholar]
- Barmada S.J., Skibinski G., Korb E., Rao E.J., Wu J.Y., Finkbeiner S. Cytoplasmic mislocalization of TDP-43 is toxic to neurons and enhanced by a mutation associated with familial amyotrophic lateral sclerosis. J. Neurosci. 2010;30:639–649. doi: 10.1523/JNEUROSCI.4988-09.2010. [DOI] [PMC free article] [PubMed] [Google Scholar]
- Beel S., Herdewyn S., Fazal R., De Decker M., Moisse M., Robberecht W., Van Den Bosch L., Van Damme P. Progranulin reduces insoluble TDP-43 levels, slows down axonal degeneration and prolongs survival in mutant TDP-43 mice. Mol. Neurodegener. 2018;13:55. doi: 10.1186/s13024-018-0288-y. [DOI] [PMC free article] [PubMed] [Google Scholar]
- Belousov A.B., O'Hara B.F., Denisova J.V. Acetylcholine becomes the major excitatory neurotransmitter in the hypothalamus in vitro in the absence of glutamate excitation. J. Neurosci. 2001;21:2015–2027. doi: 10.1523/JNEUROSCI.21-06-02015.2001. [DOI] [PMC free article] [PubMed] [Google Scholar]
- Bouter C., Henniges P., Franke T.N., Irwin C., Sahlmann C.O., Sichler M.E., Beindorff N., Bayer T.A., Bouter Y. (18)F-FDG-PET detects drastic changes in brain metabolism in the Tg4-42 model of Alzheimer's disease. Front. Aging Neurosci. 2018;10:425. doi: 10.3389/fnagi.2018.00425. [DOI] [PMC free article] [PubMed] [Google Scholar]
- Casteels C., Vunckx K., Aelvoet S.A., Baekelandt V., Bormans G., Van Laere K., Koole M. Construction and evaluation of quantitative small-animal PET probabilistic atlases for [(1)(8)F]FDG and [(1)(8)F]FECT functional mapping of the mouse brain. PLoS ONE. 2013;8 doi: 10.1371/journal.pone.0065286. [DOI] [PMC free article] [PubMed] [Google Scholar]
- Chia R., Chio A., Traynor B.J. Novel genes associated with amyotrophic lateral sclerosis: diagnostic and clinical implications. Lancet Neurol. 2018;17:94–102. doi: 10.1016/S1474-4422(17)30401-5. [DOI] [PMC free article] [PubMed] [Google Scholar]
- Cykowski M.D., Powell S.Z., Peterson L.E., Appel J.W., Rivera A.L., Takei H., Chang E., Appel S.H. Clinical significance of TDP-43 neuropathology in amyotrophic lateral sclerosis. J. Neuropathol. Exp. Neurol. 2017;76:402–413. doi: 10.1093/jnen/nlx025. [DOI] [PMC free article] [PubMed] [Google Scholar]
- D'Hulst L., Van Weehaeghe D., Chio A., Calvo A., Moglia C., Canosa A., Cistaro A., Willekens S.M., De Vocht J., Van Damme P., Pagani M., Van Laere K. Multicenter validation of [(18)F]-FDG PET and support-vector machine discriminant analysis in automatically classifying patients with amyotrophic lateral sclerosis versus controls. Amyotroph. Lateral. Scler. Frontotemporal. Degener. 2018:1–8. doi: 10.1080/21678421.2018.1476548. [DOI] [PubMed] [Google Scholar]
- Duarte J.M., Lei H., Mlynarik V., Gruetter R. The neurochemical profile quantified by in vivo 1H NMR spectroscopy. Neuroimage. 2012;61:342–362. doi: 10.1016/j.neuroimage.2011.12.038. [DOI] [PubMed] [Google Scholar]
- Duarte J.M., Do K.Q., Gruetter R. Longitudinal neurochemical modifications in the aging mouse brain measured in vivo by 1H magnetic resonance spectroscopy. Neurobiol. Aging. 2014;35:1660–1668. doi: 10.1016/j.neurobiolaging.2014.01.135. [DOI] [PubMed] [Google Scholar]
- Ertay T., Sencan Eren M., Karaman M., Oktay G., Durak H. (18)F-FDG-PET/CT in initiation and progression of inflammation and infection. Mol. Imaging Radionucl. Ther. 2017;26:47–52. doi: 10.4274/mirt.18291. [DOI] [PMC free article] [PubMed] [Google Scholar]
- Esmaeili M.A., Panahi M., Yadav S., Hennings L., Kiaei M. Premature death of TDP-43 (A315T) transgenic mice due to gastrointestinal complications prior to development of full neurological symptoms of amyotrophic lateral sclerosis. Int. J. Exp. Pathol. 2013;94:56–64. doi: 10.1111/iep.12006. [DOI] [PMC free article] [PubMed] [Google Scholar]
- Firbank M.J., Harrison R.M., O'Brien J.T. A comprehensive review of proton magnetic resonance spectroscopy studies in dementia and Parkinson's disease. Dement Geriatr. Cogn. Disord. 2002;14:64–76. doi: 10.1159/000064927. [DOI] [PubMed] [Google Scholar]
- Gao J., Wang L., Huntley M.L., Perry G., Wang X. Pathomechanisms of TDP-43 in neurodegeneration. J. Neurochem. 2018 doi: 10.1111/jnc.14327. [DOI] [PMC free article] [PubMed] [Google Scholar]
- Gargiulo S., Anzilotti S., Coda A.R., Gramanzini M., Greco A., Panico M., Vinciguerra A., Zannetti A., Vicidomini C., Dolle F., Pignataro G., Quarantelli M., Annunziato L., Brunetti A., Salvatore M., Pappata S. Imaging of brain TSPO expression in a mouse model of amyotrophic lateral sclerosis with (18)F-DPA-714 and micro-PET/CT. Eur. J. Nucl. Med. Mol. Imaging. 2016;43:1348–1359. doi: 10.1007/s00259-016-3311-y. [DOI] [PubMed] [Google Scholar]
- Gitcho M.A., Baloh R.H., Chakraverty S., Mayo K., Norton J.B., Levitch D., Hatanpaa K.J., White C.L., 3rd, Bigio E.H., Caselli R., Baker M., Al-Lozi M.T., Morris J.C., Pestronk A., Rademakers R., Goate A.M., Cairns N.J. TDP-43 A315T mutation in familial motor neuron disease. Ann. Neurol. 2008;63:535–538. doi: 10.1002/ana.21344. [DOI] [PMC free article] [PubMed] [Google Scholar]
- Gonzalez-Toledo E., Kelley R.E., Minagar A. Role of magnetic resonance spectroscopy in diagnosis and management of multiple sclerosis. Neurol. Res. 2006;28:280–283. doi: 10.1179/016164106X98161. [DOI] [PubMed] [Google Scholar]
- Govaerts K., Lechat B., Struys T., Kremer A., Borghgraef P., Van Leuven F., Himmelreich U., Dresselaers T. Longitudinal assessment of cerebral perfusion and vascular response to hypoventilation in a bigenic mouse model of Alzheimer's disease with amyloid and tau pathology. NMR Biomed. 2019;32 doi: 10.1002/nbm.4037. [DOI] [PubMed] [Google Scholar]
- Guo Y., Wang Q., Zhang K., An T., Shi P., Li Z., Duan W., Li C. HO-1 induction in motor cortex and intestinal dysfunction in TDP-43 A315T transgenic mice. Brain Res. 2012;1460:88–95. doi: 10.1016/j.brainres.2012.04.003. [DOI] [PubMed] [Google Scholar]
- Hammelrath L., Skokic S., Khmelinskii A., Hess A., van der Knaap N., Staring M., Lelieveldt B.P.F., Wiedermann D., Hoehn M. Morphological maturation of the mouse brain: an in vivo MRI and histology investigation. Neuroimage. 2016;125:144–152. doi: 10.1016/j.neuroimage.2015.10.009. [DOI] [PubMed] [Google Scholar]
- Hampton A.L., Hish G.A., Aslam M.N., Rothman E.D., Bergin I.L., Patterson K.A., Naik M., Paruchuri T., Varani J., Rush H.G. Progression of ulcerative dermatitis lesions in C57BL/6Crl mice and the development of a scoring system for dermatitis lesions. J. Am. Assoc. Lab. Anim. Sci. 2012;51:586–593. [PMC free article] [PubMed] [Google Scholar]
- Hardiman O., van den Berg L.H. Edaravone: a new treatment for ALS on the horizon? Lancet Neurol. 2017;16:490–491. doi: 10.1016/S1474-4422(17)30163-1. [DOI] [PubMed] [Google Scholar]
- Hendrich K.S., Kochanek P.M., Melick J.A., Schiding J.K., Statler K.D., Williams D.S., Marion D.W., Ho C. Cerebral perfusion during anesthesia with fentanyl, isoflurane, or pentobarbital in normal rats studied by arterial spin-labeled MRI. Magn. Reson. Med. 2001;46:202–206. doi: 10.1002/mrm.1178. [DOI] [PubMed] [Google Scholar]
- Herdewyn S., Cirillo C., Van Den Bosch L., Robberecht W., Vanden Berghe P., Van Damme P. Prevention of intestinal obstruction reveals progressive neurodegeneration in mutant TDP-43 (A315T) mice. Mol. Neurodegener. 2014;9:24. doi: 10.1186/1750-1326-9-24. [DOI] [PMC free article] [PubMed] [Google Scholar]
- Herrero-Mendez A., Almeida A., Fernandez E., Maestre C., Moncada S., Bolanos J.P. The bioenergetic and antioxidant status of neurons is controlled by continuous degradation of a key glycolytic enzyme by APC/C-Cdh1. Nat. Cell Biol. 2009;11:747–752. doi: 10.1038/ncb1881. [DOI] [PubMed] [Google Scholar]
- Jenkins B.G., Klivenyi P., Kustermann E., Andreassen O.A., Ferrante R.J., Rosen B.R., Beal M.F. Nonlinear decrease over time in N-acetyl aspartate levels in the absence of neuronal loss and increases in glutamine and glucose in transgenic Huntington's disease mice. J. Neurochem. 2000;74:2108–2119. doi: 10.1046/j.1471-4159.2000.0742108.x. [DOI] [PubMed] [Google Scholar]
- Kabashi E., Valdmanis P.N., Dion P., Spiegelman D., McConkey B.J., Vande Velde C., Bouchard J.P., Lacomblez L., Pochigaeva K., Salachas F., Pradat P.F., Camu W., Meininger V., Dupre N., Rouleau G.A. TARDBP mutations in individuals with sporadic and familial amyotrophic lateral sclerosis. Nat. Genet. 2008;40:572–574. doi: 10.1038/ng.132. [DOI] [PubMed] [Google Scholar]
- Kim, S.G., Tsekos, N.V., 1997. Perfusion imaging by a flow-sensitive alternating inversion recovery (FAIR) technique: application to functional brain imaging (vol 37, pg 425, 1997). Magnet. Reson. Med. 37, 675–675. [DOI] [PubMed]
- Lei H., Dirren E., Poitry-Yamate C., Schneider B.L., Gruetter R., Aebischer P. Evolution of the neurochemical profiles in the G93A-SOD1 mouse model of amyotrophic lateral sclerosis. J. Cereb. Blood. Flow. 2018 doi: 10.1177/0271678X18756499. [DOI] [PMC free article] [PubMed] [Google Scholar]
- Leigh, P.N., Whitwell, H., Garofalo, O., Buller, J., Swash, M., Martin, J.E., Gallo, J.M., Weller, R.O., Anderton, B.H., 1991. Ubiquitin-immunoreactive intraneuronal inclusions in amyotrophic lateral sclerosis. Morphology, distribution, and specificity. Brain 114 (Pt 2), 775–788. [DOI] [PubMed]
- Lindner M., Bell T., Iqbal S., Mullins P.G., Christakou A. In vivo functional neurochemistry of human cortical cholinergic function during visuospatial attention. PLoS ONE. 2017;12 doi: 10.1371/journal.pone.0171338. [DOI] [PMC free article] [PubMed] [Google Scholar]
- Miyazaki K., Masamoto K., Morimoto N., Kurata T., Mimoto T., Obata T., Kanno I., Abe K. Early and progressive impairment of spinal blood flow-glucose metabolism coupling in motor neuron degeneration of ALS model mice. J. Cereb. Blood Flow Metab. 2012;32:456–467. doi: 10.1038/jcbfm.2011.155. [DOI] [PMC free article] [PubMed] [Google Scholar]
- Narayanan S., Francis S.J., Sled J.G., Santos A.C., Antel S., Levesque I., Brass S., Lapierre Y., Sappey-Marinier D., Pike G.B., Arnold D.L. Axonal injury in the cerebral normal-appearing white matter of patients with multiple sclerosis is related to concurrent demyelination in lesions but not to concurrent demyelination in normal-appearing white matter. Neuroimage. 2006;29:637–642. doi: 10.1016/j.neuroimage.2005.07.017. [DOI] [PubMed] [Google Scholar]
- Naressi A., Couturier C., Castang I., de Beer R., Graveron-Demilly D. Java-based graphical user interface for MRUI, a software package for quantitation of in vivo/medical magnetic resonance spectroscopy signals. Comput. Biol. Med. 2001;31:269–286. doi: 10.1016/s0010-4825(01)00006-3. [DOI] [PubMed] [Google Scholar]
- Neumann M., Sampathu D.M., Kwong L.K., Truax A.C., Micsenyi M.C., Chou T.T., Bruce J., Schuck T., Grossman M., Clark C.M., McCluskey L.F., Miller B.L., Masliah E., Mackenzie I.R., Feldman H., Feiden W., Kretzschmar H.A., Trojanowski J.Q., Lee V.M. Ubiquitinated TDP-43 in frontotemporal lobar degeneration and amyotrophic lateral sclerosis. Science. 2006;314:130–133. doi: 10.1126/science.1134108. [DOI] [PubMed] [Google Scholar]
- Oliver C.N., Starke-Reed P.E., Stadtman E.R., Liu G.J., Carney J.M., Floyd R.A. Oxidative damage to brain proteins, loss of glutamine synthetase activity, and production of free radicals during ischemia/reperfusion-induced injury to gerbil brain. Proc. Natl. Acad. Sci. U S A. 1990;87:5144–5147. doi: 10.1073/pnas.87.13.5144. [DOI] [PMC free article] [PubMed] [Google Scholar]
- Ontaneda D., Sakaie K., Lin J., Wang X.F., Lowe M.J., Phillips M.D., Fox R.J. Measuring brain tissue integrity during 4 years using diffusion tensor imaging. AJNR Am. J. Neuroradiol. 2017;38:31–38. doi: 10.3174/ajnr.A4946. [DOI] [PMC free article] [PubMed] [Google Scholar]
- Oosterlinck W.W., Dresselaers T., Geldhof V., Van Santvoort A., Robberecht W., Herijgers P., Himmelreich U. Response of mouse brain perfusion to hypo- and hyperventilation measured by arterial spin labeling. Magn. Reson. Med. 2011;66:802–811. doi: 10.1002/mrm.23060. [DOI] [PubMed] [Google Scholar]
- Perrin S. Preclinical research: make mouse studies work. Nature. 2014;507:423–425. doi: 10.1038/507423a. [DOI] [PubMed] [Google Scholar]
- Ratiney H., Coenradie Y., Cavassila S., van Ormondt D., Graveron-Demilly D. Time-domain quantitation of 1H short echo-time signals: background accommodation. MAGMA. 2004;16:284–296. doi: 10.1007/s10334-004-0037-9. [DOI] [PubMed] [Google Scholar]
- Ravits J., Paul P., Jorg C. Focality of upper and lower motor neuron degeneration at the clinical onset of ALS. Neurology. 2007;68:1571–1575. doi: 10.1212/01.wnl.0000260965.20021.47. [DOI] [PubMed] [Google Scholar]
- Rule R.R., Schuff N., Miller R.G., Weiner M.W. Gray matter perfusion correlates with disease severity in ALS. Neurology. 2010;74:821–827. doi: 10.1212/WNL.0b013e3181d3e2dd. [DOI] [PMC free article] [PubMed] [Google Scholar]
- Struys T., Govaerts K., Oosterlinck W., Casteels C., Bronckaers A., Koole M., Van Laere K., Herijgers P., Lambrichts I., Himmelreich U., Dresselaers T. In vivo evidence for long-term vascular remodeling resulting from chronic cerebral hypoperfusion in mice. J. Cereb. Blood Flow Metab. 2017;37:726–739. doi: 10.1177/0271678X16638349. [DOI] [PMC free article] [PubMed] [Google Scholar]
- Tenney J.R., Rozhkov L., Horn P., Miles L., Miles M.V. Cerebral glucose hypometabolism is associated with mitochondrial dysfunction in patients with intractable epilepsy and cortical dysplasia. Epilepsia. 2014;55:1415–1422. doi: 10.1111/epi.12731. [DOI] [PubMed] [Google Scholar]
- Wang W., Wang L., Lu J., Siedlak S.L., Fujioka H., Liang J., Jiang S., Ma X., Jiang Z., da Rocha E.L., Sheng M., Choi H., Lerou P.H., Li H., Wang X. The inhibition of TDP-43 mitochondrial localization blocks its neuronal toxicity. Nat. Med. 2016;22:869–878. doi: 10.1038/nm.4130. [DOI] [PMC free article] [PubMed] [Google Scholar]
- Watts M.E., Pocock R., Claudianos C. Brain energy and oxygen metabolism: emerging role in normal function and disease. Front. Mol. Neurosci. 2018;11:216. doi: 10.3389/fnmol.2018.00216. [DOI] [PMC free article] [PubMed] [Google Scholar]
- Weerasekera A., Sima D.M., Dresselaers T., Van Huffel S., Van Damme P., Himmelreich U. Non-invasive assessment of disease progression and neuroprotective effects of dietary coconut oil supplementation in the ALS SOD1(G93A) mouse model: a (1)H-magnetic resonance spectroscopic study. Neuroimage Clin. 2018;20:1092–1105. doi: 10.1016/j.nicl.2018.09.011. [DOI] [PMC free article] [PubMed] [Google Scholar]
- Wegorzewska I., Bell S., Cairns N.J., Miller T.M., Baloh R.H. TDP-43 mutant transgenic mice develop features of ALS and frontotemporal lobar degeneration. Proc. Natl. Acad. Sci. U S A. 2009;106:18809–18814. doi: 10.1073/pnas.0908767106. [DOI] [PMC free article] [PubMed] [Google Scholar]
- Wong K.P., Sha W., Zhang X., Huang S.C. Effects of administration route, dietary condition, and blood glucose level on kinetics and uptake of 18F-FDG in mice. J. Nucl. Med. 2011;52:800–807. doi: 10.2967/jnumed.110.085092. [DOI] [PMC free article] [PubMed] [Google Scholar]
- Yonas H., Sesay M., Calli C., Liu H.M., Lomena F., Nasel C., Meyer J.S., Yunten N., Anckarsater H., Wintermark M. The goal is quantitative cerebral blood flow. J. Neuroradiol. 2005;32:291–293. doi: 10.1016/s0150-9861(05)83158-x. [DOI] [PubMed] [Google Scholar]
- Zimmer E.R., Parent M.J., Souza D.G., Leuzy A., Lecrux C., Kim H.I., Gauthier S., Pellerin L., Hamel E., Rosa-Neto P. [(18)F]FDG PET signal is driven by astroglial glutamate transport. Nat. Neurosci. 2017;20:393–395. doi: 10.1038/nn.4492. [DOI] [PMC free article] [PubMed] [Google Scholar]
Associated Data
This section collects any data citations, data availability statements, or supplementary materials included in this article.
Supplementary Materials
Data Availability Statement
The datasets used and/or analyzed during the current study are available from the corresponding author on reasonable request.