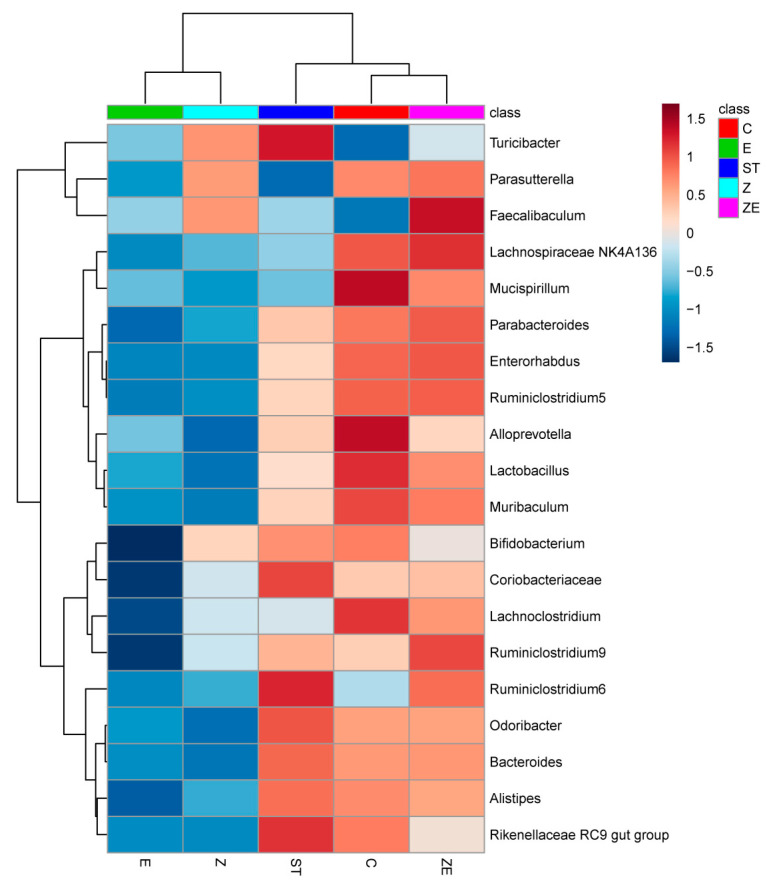
Figure 5.
Heatmap showing the abundance difference of the gut microbiota at the genus level among groups (top 25). Mice were pre-treated with regular diet and PBS (ST), regular diet and ZS2058 (Z), eugenol-contained diet and PBS (E), or eugenol-contained diet and ZS2058 (ZE) for 10 days before Salmonella infection. The control mice (C) were also pre-treated with regular diet and PBS but were not infected. When sacrificed at 2 days post-infection, cecal contents were collected for sequencing. n = 5. Red, high abundance; white, medium abundance; blue, low abundance.

