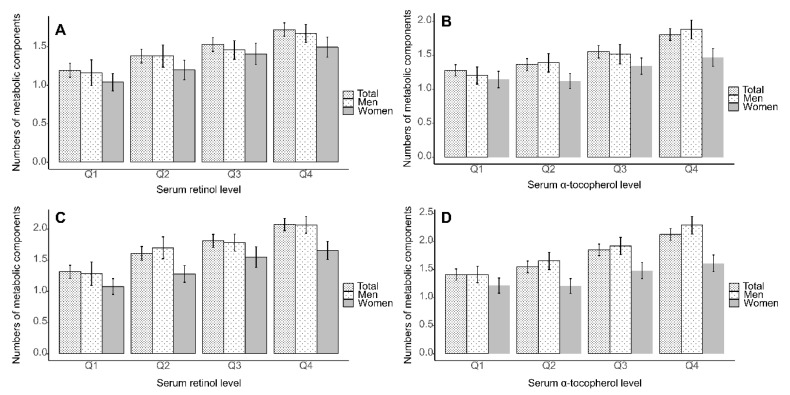
Figure 1.
Estimated number of metabolic components with 95% confidence interval according to quartiles of serum retinol and α-tocopherol levels based on multivariate-adjusted linear regression analysis is shown. (A) retinol, and (B) α-tocopherol with adjustment for body mass index (BMI). (C) retinol and (D) α-tocopherol without adjustment for BMI (Ptrend < 0.001 for all analyses). Multivariate-adjusted model included age, sex, residence, household income, education, alcohol consumption, smoking status, physical activity, hs-CRP, and BMI (or not) as covariates. Hs-CRP, high sensitivity C-reactive protein; BMI, body mass index.

