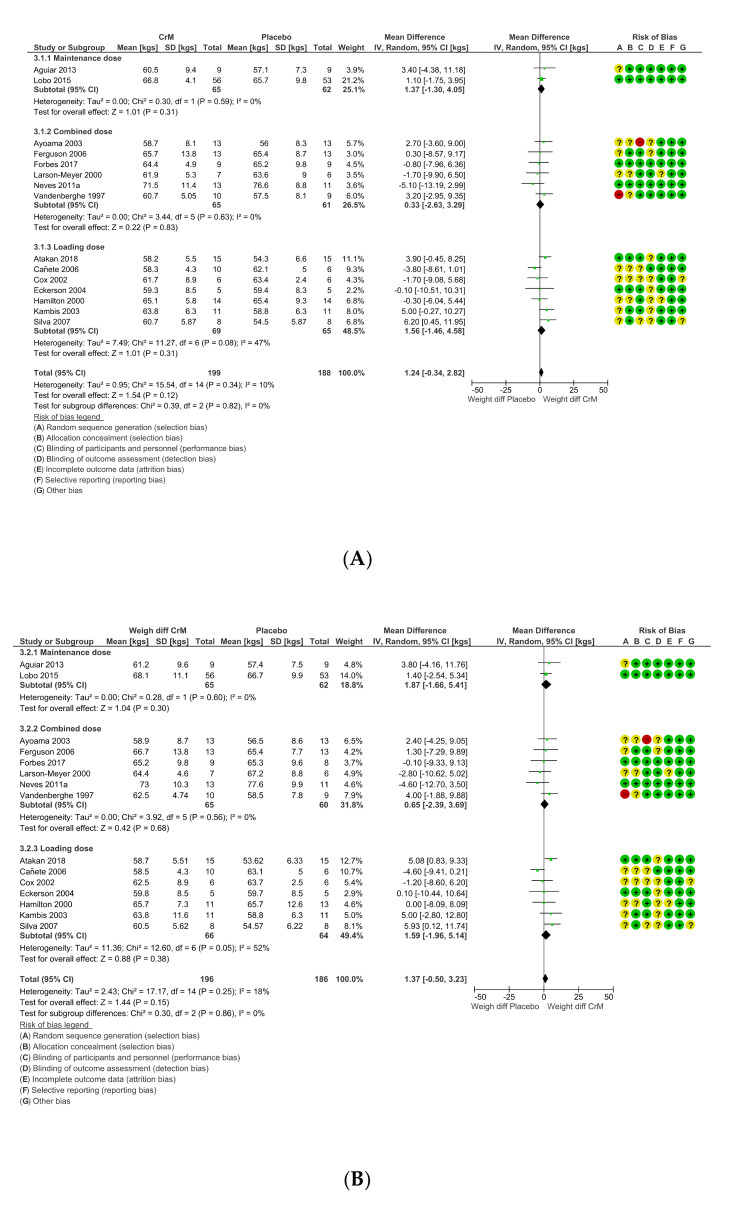
Figure 8.
(A) Difference in body weights per group, pre-intervention, stratified by dosing regimens. Within Forest Plot, Study or Subgroup = study stratified by dosing regimens; Mean = mean body weight per group in kgs; SD = standard deviation; Total = total number of participants in study group; Weight = amount of information contributed by study; I-V = Inverse Variance random effects model. (B) Difference in body weights per group, post-intervention, stratified by dosing regimens. Within Forest Plot, Study or Subgroup = study stratified by dosing regimens; Mean = mean body weight per group in kgs; SD = standard deviation; Total = total number of participants in study group; Weight = amount of information contributed by study; IV = Inverse variance model; Random=random effects model; Risk of bias; + (green) = low risk of bias, ? (yellow) = unclear risk of bias, - (red) = high risk of bias

