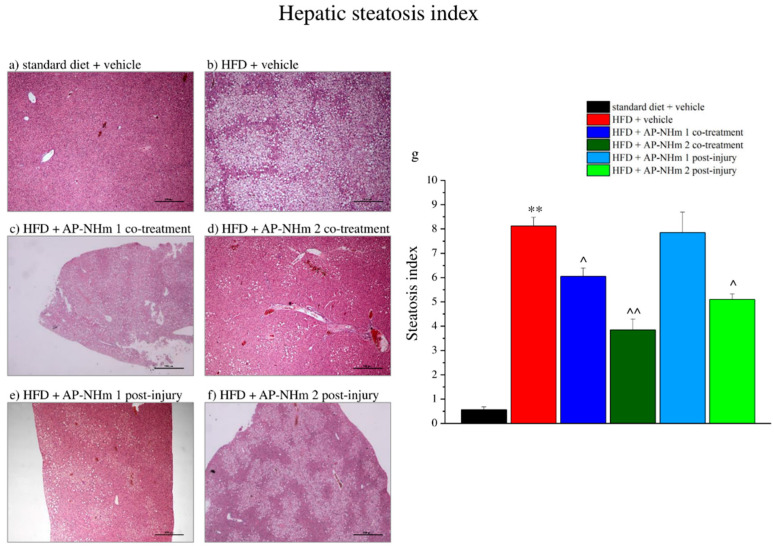
Figure 8.
Effects of AP-NHm 1–2, in co-treatment or in post-injury treatment, on hepatic tissue and steatosis index. (a–f) Histology of tissue sections of hepatic tissue: (a) standard diet + vehicle, (b) HFD + vehicle, (c) HFD + AP-NHm 1 co-treatment, (d) HFD + AP-NHm 2 co-treatment, (e) HFD + AP-NHm 1 post-injury, (f) HFD + AP-NHm 2 post-injury; (g) steatosis index of each group of treatment. Each value represents the mean ± SEM of 12 mice per group. ** p < 0.01 vs. standard diet + vehicle, ^ p < 0.05 and ^^ p < 0.01 vs. HFD + vehicle.

