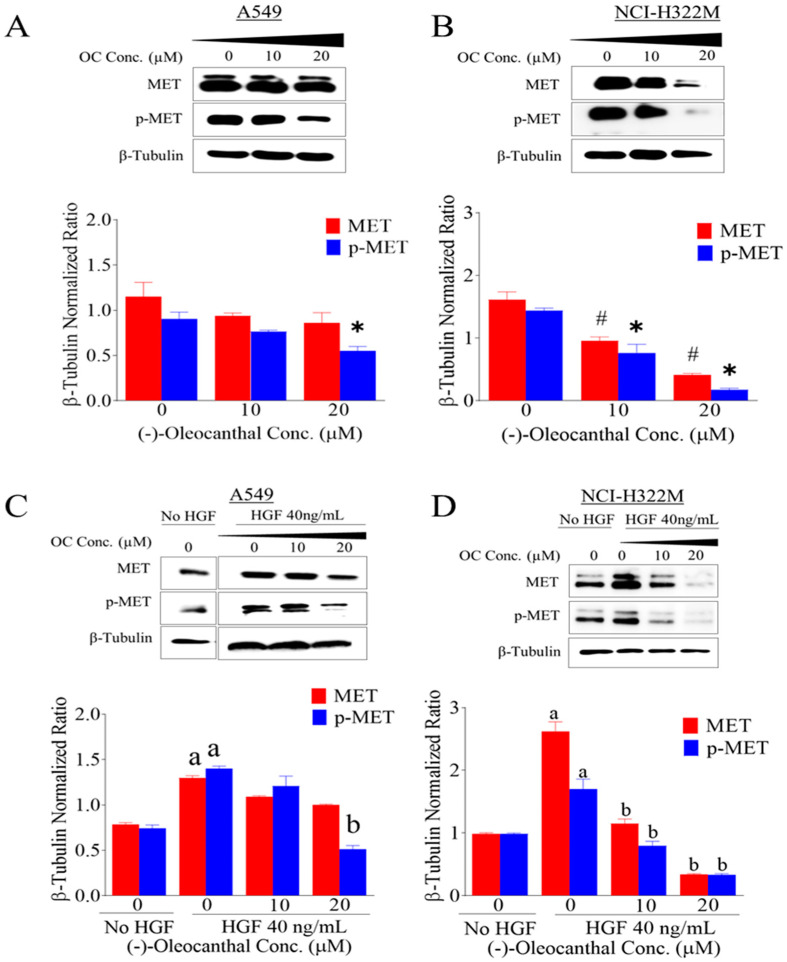
Figure 3.
The in vitro effects of OC treatments on the total and activated c-MET levels in human LC cells. Western blot analysis for OC treatment effects without HGF (A) A549 and (B) NCI-H322M cells and with HGF (40 ng/mL) (C) A549 and (D) NCI-H322M cells on the total and activated c-MET levels. Cells were plated at 1 × 10⁶ cells/100 mm culture plates in RPMI-1640 media supplemented with 10% FBS and allowed to adhere overnight. Cells were then washed twice with PBS and starved in both control and treatment media containing either vehicle control or OC treatments. In case of HGF, cells were separately treated with either vehicle control or OC treatments containing 40 ng/mL HGF for 48 h. Scanning densitometry was obtained for each blot, carried out in triplicate and the integrated optical density of each band was normalized with the corresponding density found for β-tubulin in the same blot. The bottom panel vertical bar graphs indicate the normalized integrated bands of total and activated c-MET optical density visualized in each lane ±SD. * and # p < 0.05 significant difference between vehicle control and OC treatment. a p < 0.05 significant difference between cells cultured without HGF treatment and with 40 ng/mL HGF over 48 h. b p < 0.05 significant difference between OC treatments and vehicle-treated controls in presence of 40 ng/mL HGF over 48 h.

