Abstract
Background
To develop and validate survival nomograms for predicting the overall survival (OS) and cancer-specific survival (CSS) in upper tract urothelial carcinoma (UTUC) patients.
Method
Patients diagnosed with UTUC from 2010 to 2015 in the Surveillance, Epidemiology, and End Results (SEER) database were retrospectively enrolled. Clinical characteristics and survival outcomes were respectively collected from the included patients. Then, eligible patients were divided into the training cohort and the validation cohort. Additionally, survival nomograms were developed based on the results of multivariate Cox analysis in the training cohort. Furthermore, Kaplan-Meier (KM) survival curves were generated to assess the actual effect of each variable. Lastly, the nomograms were validated using the concordance index (C-index), the area under the receiver operating characteristic (ROC) curve and calibration curves.
Results
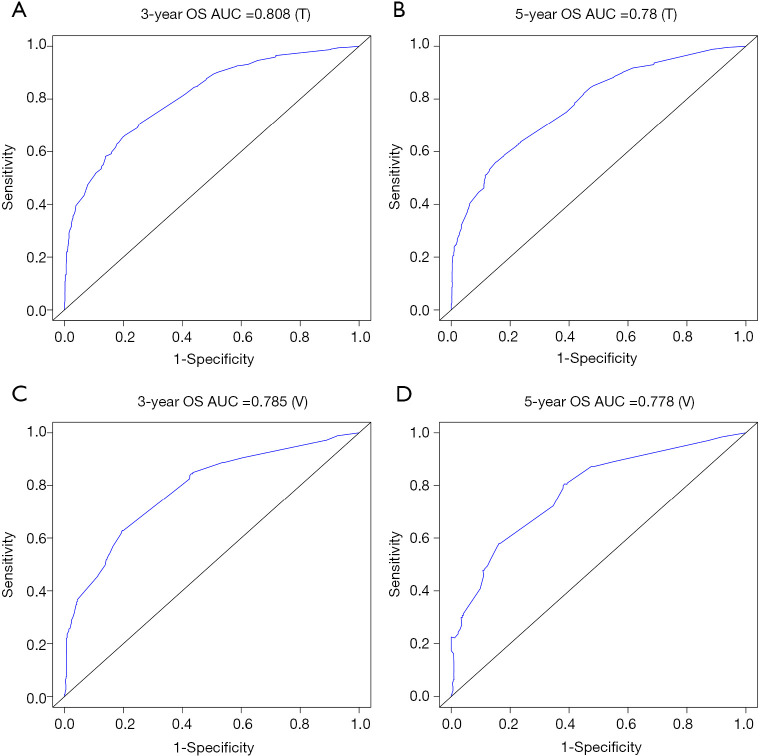
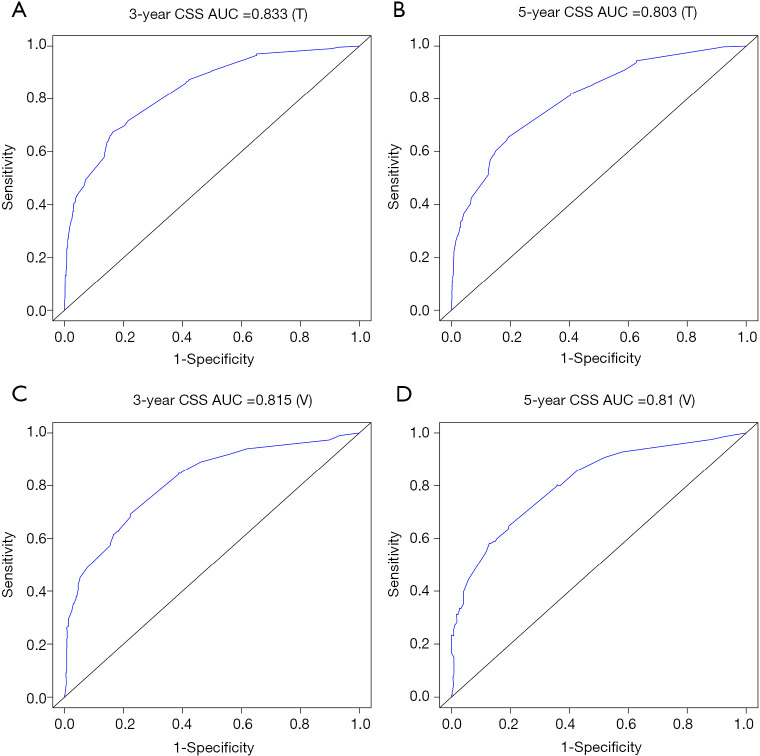
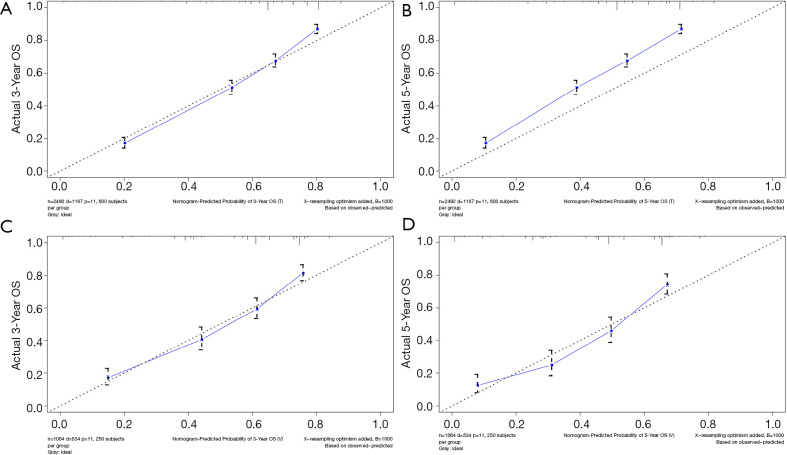
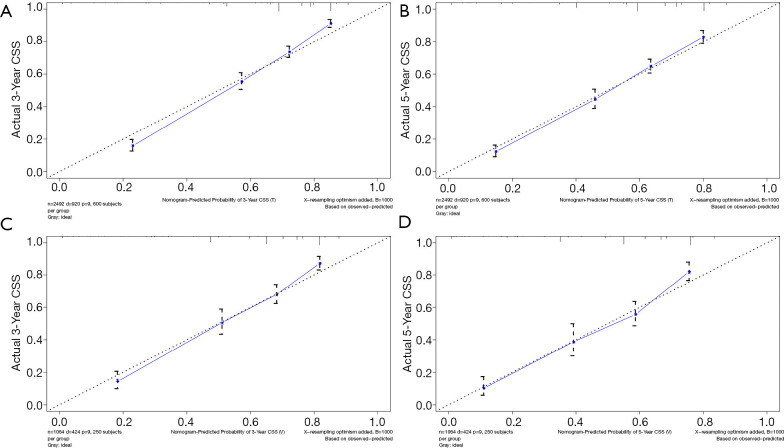
Totally, 3,556 patients were included, with 2,492 in the training cohort and 1,064 in the validation cohort. No significant differences were detected in comparisons in clinical characteristics between two cohorts. Based on the results of uni- and multivariate Cox regression analysis, seven factors (age, TNM stage, use of surgery/radiation and marital status) for OS and six factors (age, TNM stage and use of surgery/radiation) for CSS were selected to develop the survival nomograms. The C-index for OS and CSS was 0.763 and 0.793 in the training cohort, and 0.759 and 0.784 in the validation cohort. Additionally, the 3- and 5-year AUCs for OS were 0.808 and 0.780 in the training cohort, and 0.785 and 0.778 in the validation group. As for CSS, it was 0.833 and 0.803 in the training cohort, and 0.815 and 0.810 in the validation cohort. Lastly, the calibration curves indicated a good consistency between the actual survival and the predictive survival.
Conclusions
It was the first time to conduct survival models for UTUC patients with predictive performance. It might be valuable of clinical application and further exploration with more studies in the future.
Keywords: Prognostic model, nomogram, upper tract urothelial carcinoma (UTUC), SEER database
Introduction
Upper tract urothelial carcinoma (UTUC) is defined as any malignancies that affect the urothelial lining of the urinary tract, from the calyces to the distal ureter. It is an uncommon subtype of urothelial cancers, accounting for 5–7% of all renal carcinoma and 5–10% of all urothelial malignancies (1).
Overall, 60% of UTUCs are invasive diseases when diagnosed (2). Therefore, patients with UTUC usually feature with poor prognosis when tumors invade the muscle wall. Currently, the 5-year specific survival was less than 50% for pT2/pT3 diseases and less than 10% for pT4 diseases (3). Therefore, it was of great significance to explore the prognostic factors to improve the survival outcomes for UTUC patients. It was reported that the prognostic factors of UTUC can be divided into preoperative factors and postoperative factors, respectively (4). Preoperative factors mainly included age, sex, ethnicity, tobacco consumption and etc. (4-6), while tumor stage and grade, lymph node involvement, lymphvascular invasion and surgical margins were regarded as postoperative factors of UTUC (3,7-9). Unfortunately, the prognostic value of these parameters remained inconspicuous and accurate predictive tools were rare for UTUC patients.
Such dilemma can be attributed to relatively low prevalence of UTUC and the relative preponderance of urinary bladder carcinoma (UBC), so that much of the clinical decision of UTUC was made according to the evidence based on the UBC cohorts. While significant similarities exist between the two disease, ignorance of important difference may hinder us from optimizing therapy in patients with UTUC. Therefore, large cohort studies of UTUCs from multi-centers are necessary to achieve high-grade recommendations for UTUC management (2).
The purpose of our study was to explore the promising prognostic factors for UTUC based on the SEER database and to establish relevant nomograms to predict survival for UTUC patients.
Methods
Patients selection
SEER*Stat software (Version 8.3.6; NCI, Bethesda, USA) was applied to investigate the original data of patients diagnosed with UTUC from the Surveillance, Epidemiology, and End Results (SEER) database (http://seer.cancer.gov/). The SEER program is a population-based database which sorts out data on clinical data from 18 registries and covers about 28% of the United States population. Patients included in our study should meet the following criteria: (I) diagnosed as UTUC (International Classification of Diseases for Oncology: 8,120/3, 8,122/3, 8,130/3, 8,131/3) with positive histology; (II) primary site: C65.9 for renal pelvis and C66.9 for ureter; (III) age at diagnose was greater than or equal to 40 years old; (IV) complete data were available with active follow-up. In the meantime, the exclusion criteria of this study were as follows: (I) UTUC was not the first primary malignancy; (II) missing/unknown data existed in the included variables; (III) type of reporting source was death certificate only or autopsy only. Certainly, the final enrolled patients were all diagnosed between 2010 to 2015 to ensure a relatively long follow-up period.
Clinical characteristics and survival outcomes of included patients were collected by two independent investigators (Feng Qi and Xiyi Wei). Variables included age at diagnose, race (white, black and other), sex (male and female), laterality of the primary tumor (bilateral tumors also been excluded), use of surgery, radiation, chemotherapy, lymph node removal (LNR), American Joint Committee on Cancer (AJCC) 7th edition TNM stage, marital and insurance status, follow-up time and survival outcomes. Overall survival (OS) and cancer-specific survival (CSS) were the primary endpoints of this research. This study was exempt by Institutional Review Board (IRB) approval because the original data were from a public database.
Statistical analysis
To develop the survival nomograms and perform further validation, the final included patients were divided into two cohorts (the training cohort and the validation cohort) randomly at a ratio of 7:3 with the method of random-number generation. Comparisons of clinical characteristics between two groups were made utilizing the chi-square test.
Uni- and multivariate Cox proportional hazards regression analysis were conducted to explore the variables which can affect the OS and CSS significantly. Meanwhile, hazard ratios (HRs) with its corresponding 95% confidence intervals (CIs) of the risk factors were calculated. Then, prognostic nomograms to predict 3-year and 5-year survival probability were constructed according to the results of multivariate Cox proportional hazards regression analysis. Additionally, survival curves for different variables were performed by Kaplan-Meier (KM) analysis and were compared utilizing the log-rank test.
Finally, predictive ability of the survival models was evaluated. Calibration and the discrimination of the nomograms were measured both in the training cohort and the validation cohort. Discrimination was assessed by the Harrell's concordance index (C-index) and the receiver operating characteristic (ROC) curve (10,11). The area under the ROC curve (AUC) and the C-index range from 0.5 to 1.0, with 1.0 indicating a perfect discrimination ability and 0.5 suggesting the total chance (12). Furthermore, consistency between the expected survival and the observed survival was identified by calibration curves.
The chi-square test and Cox proportional hazards regression analysis were conducted using SPSS 23.0 software (SPSS Inc, Chicago, IL, USA). Rms and survival package were utilized to construct and validate the survival nomograms via RStudio software (Version 1.2.5001). During the whole analysis process, all tests were two sided, and P value <0.05 was considered to be statistically significant.
Results
Patient characteristics
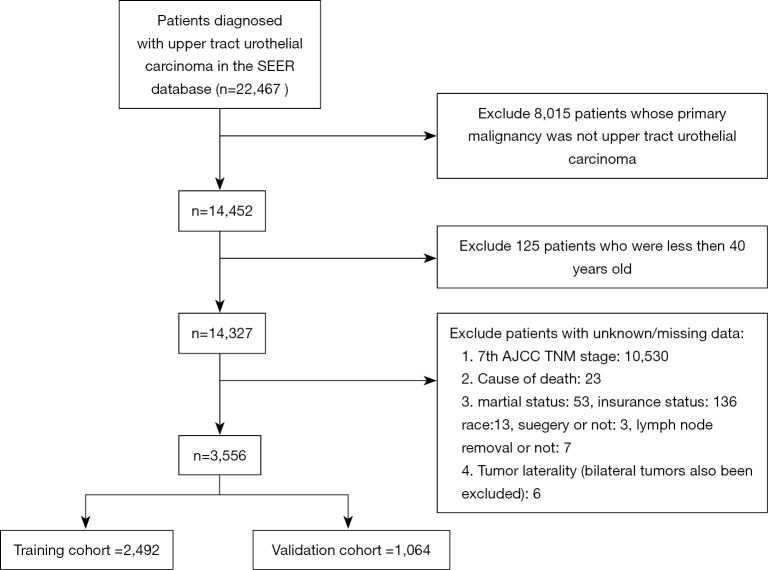
Three thousand five hundred and fifty-six patients diagnosed with UTUC between 2010 to 2015 were eventually included in this study (flow chart was present in Figure 1). Two thousand four hundred and ninety-two patients were divided into the training cohort while 1,064 patients were in the validation cohort. The training cohort was applied to develop and undergo internal validation of the survival nomograms while the validation cohort was assigned for external validation.
Figure 1.
Flow diagram of the selection process.
Generally, most of the included patients were 60–80 years old (59.93%), white (86.10%), male (57.65%), with an early N stage (N0: 82.03%), M stage (M0: 89.76%). A total of 89.71% of patients had undergone surgery and few patients had received radiotherapy (6.10%) and chemotherapy (25.79%). Basic characteristics of included patients and comparisons of each variable between two cohorts were shown in Table 1. There were no significant differences between two cohorts in age, race, sex, AJCC TNM stage, use of surgery/chemotherapy/radiotherapy/LNR, insurance status, marital status, tumor laterality and so on (all P>0.05).
Table 1. Clinical characteristics of included patients in the study.
| Variables | Total (n=3,556) | Training cohort (n=2,492) | Validation cohort (n=1,064) | P* |
|---|---|---|---|---|
| Age (year) | 0.608 | |||
| 40–59 | 530 | 363 | 167 | |
| 60–79 | 2,131 | 1,505 | 626 | |
| ≥80 | 895 | 624 | 271 | |
| Race | 0.811 | |||
| White | 3,062 | 2,141 | 921 | |
| Black | 169 | 122 | 47 | |
| Other | 325 | 229 | 96 | |
| Sex | 0.918 | |||
| Male | 2,050 | 1,438 | 612 | |
| Female | 1,506 | 1,054 | 452 | |
| Laterality | 0.669 | |||
| Left | 1,812 | 1,264 | 548 | |
| Right | 1,744 | 1,228 | 516 | |
| T stage | 0.631 | |||
| T1 | 1,182 | 817 | 365 | |
| T2 | 560 | 386 | 174 | |
| T3 | 1,419 | 1,007 | 412 | |
| T4 | 395 | 282 | 113 | |
| N stage | 0.834 | |||
| N0 | 2,917 | 2,042 | 875 | |
| ≥N1 | 639 | 450 | 189 | |
| M stage | 0.912 | |||
| M0 | 3,192 | 2,236 | 956 | |
| M1 | 364 | 256 | 108 | |
| Surgery | 0.589 | |||
| No | 366 | 252 | 114 | |
| Yes | 3,190 | 2,240 | 950 | |
| LNR | 0.969 | |||
| No/Unknown | 2,565 | 1,798 | 767 | |
| Yes | 991 | 694 | 297 | |
| Radiation | 0.751 | |||
| No | 3,339 | 2,342 | 997 | |
| Yes | 217 | 150 | 67 | |
| Chemotherapy | 0.146 | |||
| No/Unknown | 2,369 | 1,832 | 807 | |
| Yes | 917 | 660 | 257 | |
| Marital status | 0.366 | |||
| Married | 2,188 | 1,552 | 636 | |
| Previously married | 1,008 | 694 | 314 | |
| Never married | 360 | 246 | 114 | |
| Insurance status | 0.156 | |||
| Any medicaid | 311 | 224 | 87 | |
| Insured | 3,180 | 2,229 | 951 | |
| Uninsured | 65 | 39 | 26 |
*, P values of comparisons between the training cohort and the validation cohort. LNR, lymph node removal.
Cox analyses, KM analyses and nomograms construction
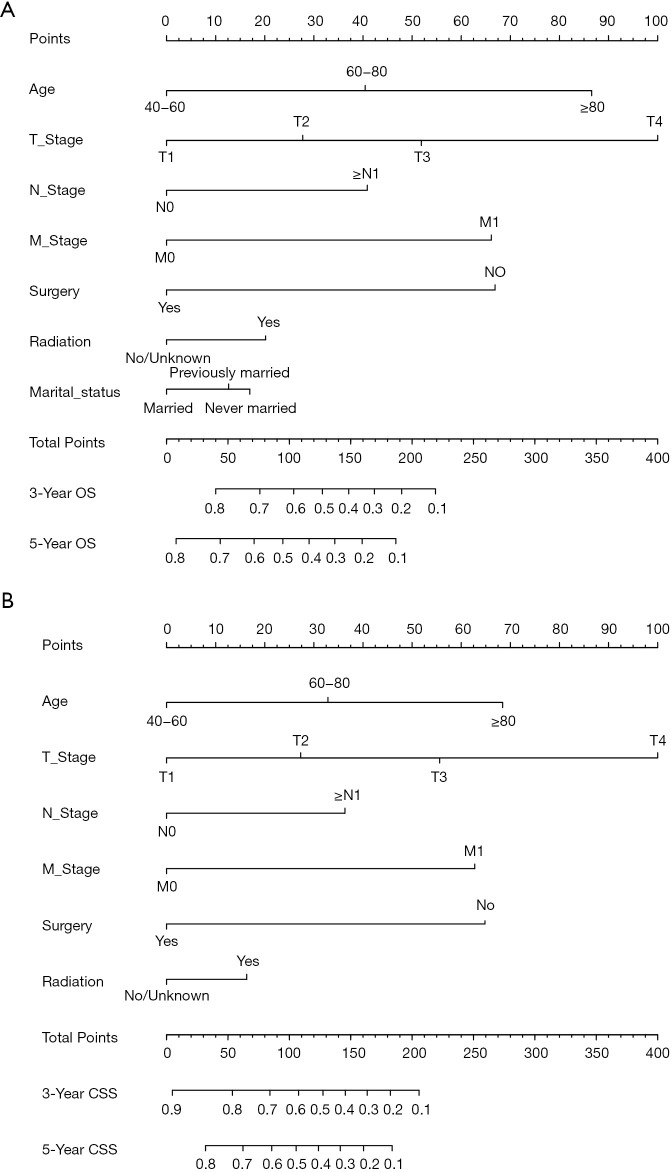
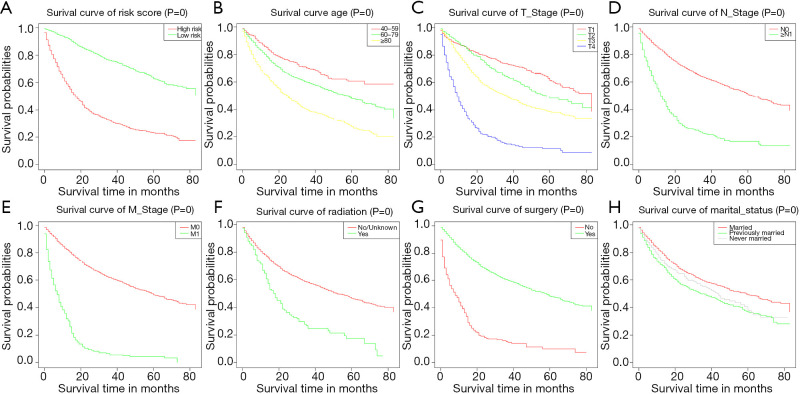
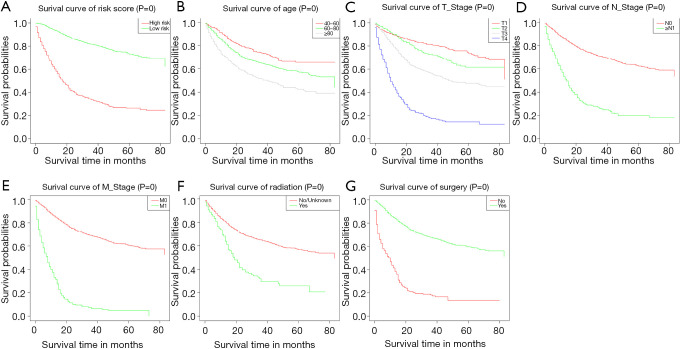
Twelve variables were enrolled in univariate Cox proportional hazards regression analysis, including age, race, sex, tumor laterality, TNM stage, use of surgery/chemotherapy/radiotherapy/LNR, insurance status and marital status. Then, 8 variables for OS and 9 variables for CSS were included in the multivariate Cox analysis for further exploration (Table 2 and Table 3, respectively). According to the results of multivariate Cox analysis, prognostic nomograms were conducted to predict the 3-year and 5-year OS and CSS probability (Figure 2). In the nomograms, a total point can be calculated by adding the score of each variable, from which survival probabilities can be assessed easily. Finally, KM survival curves for OS and CSS were generated to learn the actual effect of different variables (Figures 3,4).
Table 2. Uni- and multivariate analysis of the training cohort for OS.
| Variable | Univariate analysis | Multivariate analysis | |||||
|---|---|---|---|---|---|---|---|
| HR | 95% CI | P | HR | 95% CI | P | ||
| Age (year) | 0.000 | 0.000 | |||||
| 40–59 | Reference | Reference | |||||
| 60–79 | 1.484 | 1.220–1.806 | 0.000 | 1.679 | 1.378–2.047 | 0.000 | |
| ≥80 | 2.612 | 2.126–3.210 | 0.000 | 3.038 | 2.4563.757 | 0.000 | |
| Sex | 0.000 | 0.729 | |||||
| Male | Reference | Reference | |||||
| Female | 1.228 | 1.094–1.378 | 0.000 | 1.022 | 0.9051.153 | 0.729 | |
| Laterality | 0.515 | ||||||
| Left | Reference | ||||||
| Right | 1.039 | 0.926–1.165 | 0.515 | ||||
| Race | 0.089 | ||||||
| White | Reference | ||||||
| Black | 1.302 | 1.015–1.671 | 0.038 | ||||
| Other | 1.092 | 0.897–1.330 | 0.379 | ||||
| T stage | 0.000 | 0.000 | |||||
| T1 | Reference | Reference | |||||
| T2 | 1.328 | 1.087–1.632 | 0.006 | 1.435 | 1.172–1.756 | 0.000 | |
| T3 | 2.011 | 1.731–2.336 | 0.000 | 1.958 | 1.680–2.282 | 0.000 | |
| T4 | 5.661 | 4.733–6.770 | 0.000 | 3.619 | 2.985–4.387 | 0.000 | |
| N stage | 0.000 | 0.000 | |||||
| N0 | Reference | Reference | |||||
| ≥N1 | 3.263 | 2.870–3.708 | 0.000 | 1.695 | 1.454–1.976 | 0.000 | |
| M stage | 0.000 | 0.000 | |||||
| M0 | Reference | Reference | |||||
| M1 | 5.764 | 4.963–6.695 | 0.000 | 2.325 | 1.926–2.806 | 0.000 | |
| Surgery | 0.000 | 0.000 | |||||
| No | Reference | Reference | |||||
| Yes | 0.237 | 0.204–0.276 | 0.000 | 0.427 | 0.358–0.509 | 0.000 | |
| LNR | 0.820 | ||||||
| No | Reference | ||||||
| Yes | 1.015 | 0.893–1.154 | 0.820 | ||||
| Radiation | 0.000 | 0.011 | |||||
| No/Unknown | Reference | Reference | |||||
| Yes | 2.169 | 1.783–2.640 | 0.000 | 1.297 | 1.062–1.584 | 0.011 | |
| Marital status | 0.000 | 0.018 | |||||
| Married | Reference | Reference | |||||
| Previously married | 1.422 | 1.253–1.613 | 0.000 | 1.171 | 1.024–1.339 | 0.021 | |
| Never married | 1.241 | 1.023–1.506 | 0.029 | 1.240 | 1.018–1.510 | 0.032 | |
| Insurance status | 0.979 | ||||||
| Any medicaid | Reference | ||||||
| Insured | 0.998 | 0.814–1.224 | 0.986 | ||||
| Uninsured | 0.950 | 0.568–1.588 | 0.845 | ||||
OS, overall survival; HR, hazard ratio; CI, confidence interval; LNR, lymph node removal.
Table 3. Uni- and multivariate analysis of the training cohort for CSS.
| Variable | Univariate analysis | Multivariate analysis | |||||
|---|---|---|---|---|---|---|---|
| HR | 95% CI | P | HR | 95% CI | P | ||
| Age (year) | 0.000 | 0.000 | |||||
| 40–59 | Reference | Reference | |||||
| 60–79 | 1.431 | 1.153–1.775 | 0.001 | 1.630 | 1.310–2.028 | 0.000 | |
| ≥80 | 2.255 | 1.793–2.836 | 0.000 | 2.754 | 2.172–3.494 | 0.000 | |
| Sex | 0.000 | 0.268 | |||||
| Male | Reference | Reference | |||||
| Female | 1.286 | 1.129–1.464 | 0.000 | 1.080 | 0.943–1.236 | 0.268 | |
| Laterality | 0.623 | ||||||
| Left | Reference | ||||||
| Right | 1.033 | 0.908–1.176 | 0.623 | ||||
| Race | 0.051 | 0.724 | |||||
| White | Reference | Reference | |||||
| Black | 1.282 | 0.966–1.703 | 0.085 | 1.084 | 0.811–1.448 | 0.586 | |
| Other | 1.223 | 0.990–1.511 | 0.062 | 1.072 | 0.865–1.328 | 0.527 | |
| T stage | 0.000 | 0.000 | |||||
| T1 | Reference | Reference | |||||
| T2 | 1.366 | 1.072–1.740 | 0.012 | 1.516 | 1.188–1.936 | 0.001 | |
| T3 | 2.416 | 2.023–2.885 | 0.000 | 2.330 | 1.944–2.792 | 0.000 | |
| T4 | 7.392 | 6.034–9.056 | 0.000 | 4.503 | 3.623–5.597 | 0.000 | |
| N stage | 0.000 | 0.000 | |||||
| N0 | Reference | Reference | |||||
| ≥N1 | 3.846 | 3.347–4.420 | 0.000 | 1.737 | 1.469–2.054 | 0.000 | |
| M stage | 0.000 | 0.000 | |||||
| M0 | Reference | Reference | |||||
| M1 | 7.130 | 6.091–8.346 | 0.000 | 2.556 | 2.090–3.125 | 0.000 | |
| Surgery | 0.000 | 0.000 | |||||
| No | Reference | Reference | |||||
| Yes | 0.199 | 0.170–0.234 | 0.000 | 0.383 | 0.316–0.463 | 0.000 | |
| LNR | 0.486 | ||||||
| No | Reference | ||||||
| Yes | 1.052 | 0.912–1.215 | 0.486 | ||||
| Radiation | 0.000 | 0.017 | |||||
| No/Unknown | Reference | Reference | |||||
| Yes | 2.332 | 1.887–2.883 | 0.000 | 1.300 | 1.047–1.614 | 0.017 | |
| Marital status | 0.001 | 0.616 | |||||
| Married | Reference | Reference | |||||
| Previously married | 1.320 | 1.144–1.523 | 0.000 | 1.074 | 0.922–1.251 | 0.360 | |
| Never married | 1.127 | 0.902–1.409 | 0.292 | 1.067 | 0.850–1.339 | 0.576 | |
| Insurance status | 0.940 | ||||||
| Any medicaid | Reference | Reference | |||||
| Insured | 1.306 | 0.821–1.307 | 0.766 | ||||
| Uninsured | 0.980 | 0.545–1.763 | 0.946 | ||||
CSS, cancer-specific survival; HR, hazard ratio; CI, confidence interval; LNR, lymph node removal.
Figure 2.
Prognostic nomograms of 3- and 5-year OS (A) and CSS (B). OS, overall survival; CSS, cancer-specific survival.
Figure 3.
Kaplan-Meier curves of OS for risk stratification by risk score (A), age (B), T stage (C), N stage (D), M stage (E), the use of radiation (F), the use of surgery (G) and marital status (H).
Figure 4.
Kaplan-Meier curves of CSS for risk stratification by risk score (A), age (B), T stage (C), N stage (D), M stage (E), the use of radiation (F) and the use of surgery (G).
Nomogram validation
The methods of verification were divided into internal verification and external verification, with the application the training cohort and the validation cohort, respectively. For OS, the C-index was 0.763 in the training cohort and 0.759 in the validation cohort. As it for CSS, it was 0.793 and 0.784 in the training cohort and the validation cohort, respectively. The 3-year and 5-year AUCs for OS were 0.808 and 0.780 in the training cohort and 0.785 and 0.778 in the validation cohort (Figure 5). As for CSS, it was 0.833 and 0.803 in the training cohort and 0.815 and 0.810 in the validation cohort (Figure 6). The above results showed good discrimination performance of the nomograms. Finally, calibration curves suggested a good consistency between the expected OS/CSS and the observed OS/CSS (Figures 7,8).
Figure 5.
Three- and five-year ROC curves of OS in training (A,B) and validation (C,D) groups for validating nomogram model. ROC, receiver operating characteristic; OS, overall survival.
Figure 6.
Three- and five-year ROC curves of CSS in training (A,B) and validation (C,D) groups for validating nomogram model. ROC, receiver operating characteristic; CSS, cancer-specific survival.
Figure 7.
Three- and five-years calibration curves of OS in training (A,B) and validation (C,D) groups for validating nomogram model. OS, overall survival.
Figure 8.
Three- and five-years calibration curves of CSS in training (A,B) and validation (C,D) groups for validating nomogram model. CSS, cancer-specific survival.
Discussion
Urothelial carcinomas were the fourth most common tumor in the world, consisting of tumor from the lower (bladder and urethra) or the upper (renal collecting tubes, calyces and pelvis) urinary tract (4). UTUC accounted for only 5–10% of all urothelial malignancies, with an estimated annual incidence of 1–2 cases per 100,000 (1). Due to the combination of improved endoscopic techniques and improved bladder cancer survival, the occurrence rate of UTUC seemed to be rising in the last decades. As mentioned above, 60% of UTUCs were invasive (2) and UTUCs usually had a very poor prognosis when the tumor invaded the muscle wall. Currently, the 5yr specific survival was less than 50% for pT2/pT3 diseases and less than 10% for pT4 diseases (3). However, the low prevalence of UTUC and the relative preponderance of UBC leaded limited studies exploring the independent prognostic factors of UTUC. It was of great significance to determine the potential prognostic factors in order to improve the prognosis of patients with UTUC. Nomograms have its advantage in predicting the survival risk by combining and quantifying the importance of various prognostic factors, thus being comprehensively applied in clinical oncology assessment.
Our study demonstrated that age, TNM stage, use of surgery/radiotherapy and marital status were independent prognostic factors for OS. Moreover, age, TNM stage, use of surgery/radiotherapy was closely associated with CSS. Nomogram were established on account of these prognostic factors to predict OS and CSS for 3 and 5 years in patients with UTUCs postoperatively. In the validation cohort, the nomograms showed good discrimination performance.
According to the study from Raman et al. (13), the mean age of patients who was diagnosed as UTUC over the last three decades were from 68 to 73 years, and there were few patients who was diagnosed as UTUC before 40 years old. Therefore, patients below 40 years old were excluded in our study in order to eliminate the population bias. Consistent with the studies from Shariat et al. and Chromecki et al. (14,15), we confirmed that elderly patients had lower CSS and OS. This finding could be attributed to the different biologic potential of the tumor, which UTUCs become more aggressive in elderly patients.
In our study, patients with higher TNM grades had lower OS and CSS. Various studies have also shown that endoscopic evaluation and biopsy grade can predict the prognosis of patients with UTUC (16-18). However, unlike bladder urothelial carcinoma, the clinical staging of UTUC was much more difficult due to the thinness of the muscularis, so that biopsies that included underlying muscle were difficult to obtain. Therefore, except for the assessment of large extension or the presence of metastasis, imaging had poor predictive value and the result of biopsy grade should be evaluated with great consciousness (19). In conclusion, although clinical UTUC tumor staging might be unreliable, TNM grading could provide a fundamentally important parameters that predicts the recurrence and survival.
Furthermore, we found that the application of surgery and radiation was related to the prognosis of patients with UTUC. However, we excluded the use of chemotherapy as the prognostic factor of UTUC because we found that great heterogeneity existed in chemotherapy to treat UTUC. Some patients received adjuvant chemotherapy in order to prevent reoccurrence after surgery, while other patients received systematic chemotherapy due to their late stages. Additionally, Matin et al. demonstrated that the patients with high-risk UTUC showed a significant rate of downstaging and a 14% complete remission rate when they received neoadjuvant chemotherapy (20). Some small retrospective studies also showed adjuvant chemotherapy as an independent prognostic factor when predicting OS and CSS of patients with UTUC (21-23). Meanwhile, two studies concluded that the administration of adjuvant chemotherapy was not necessarily resulted in the benefit of OS and CSS in patients with high-risk UTUC (24,25). Therefore, more prospective studies were needed to enroll patients in clinical trials to explore the effect of specific way of chemotherapy on the prognosis of patients with UTUC.
Our research was based on the population-based database (SEER database), which can perfectly solve the problem of the low prevalence rate of UTUC. However, cases in this study were from retrospective cohorts, therefore more prospective, randomized clinical trials should be conducted to further explore the efficacy of this model. In conclusion, several independent prognostic factors were identified for both OS and CSS of patients with UTUC in our study. Furthermore, a nomogram prognostic assessment model for the patients with UTUC was established by integrating these independent prognostic factors, providing surgeons an effective tool to assess individualized survival rates of patients with UTUC.
Supplementary
The article’s supplementary files as
Acknowledgments
Funding: This work was supported by grants from the Six Talents Peaks Program of Jiangsu Province (No.2016-WSW-021), National Natural Science Foundation of China (No.81702520), Medical Research Project of Jiangsu Provincial Health and Family Planning Commission (No. H2018052), Research Project of Jiangsu Cancer Hospital (No. ZN201602), and the young talents program of Jiangsu Cancer Hospital (No. 2017YQL-04).
Ethical Statement: The authors are accountable for all aspects of the work in ensuring that questions related to the accuracy or integrity of any part of the work are appropriately investigated and resolved. This study was exempt by Institutional Review Board (IRB) approval because the original data were from a public database.
Footnotes
Conflicts of Interest: All authors have completed the ICMJE uniform disclosure form (available at http://dx.doi.org/10.21037/tau.2020.03.28). XL serves as an unpaid Section Editor of Translational Andrology and Urology from Oct 2019 to Dec 2021. The other authors have no other conflicts of interest to declare.
References
- 1.Siegel RL, Miller KD, Jemal A. Cancer statistics, 2016. CA Cancer J Clin 2016;66:7-30. 10.3322/caac.21332 [DOI] [PubMed] [Google Scholar]
- 2.Rouprêt M, Babjuk M, Comperat E, et al. European Association of Urology Guidelines on Upper Urinary Tract Urothelial Cell Carcinoma: 2015 Update. Eur Urol 2015;68:868-79. 10.1016/j.eururo.2015.06.044 [DOI] [PubMed] [Google Scholar]
- 3.Lughezzani G, Burger M, Margulis V, et al. Prognostic factors in upper urinary tract urothelial carcinomas: a comprehensive review of the current literature. Eur Urol 2012;62:100-14. 10.1016/j.eururo.2012.02.030 [DOI] [PubMed] [Google Scholar]
- 4.Rouprêt M, Babjuk M, Comperat E, et al. European Association of Urology Guidelines on Upper Urinary Tract Urothelial Carcinoma: 2017 Update. Eur Urol 2018;73:111-22. 10.1016/j.eururo.2017.07.036 [DOI] [PubMed] [Google Scholar]
- 5.Park J, Habuchi T, Arai Y, et al. Reassessment of prognostic heterogeneity of pT3 renal pelvic urothelial carcinoma: analysis in terms of proposed pT3 subclassification systems. J Urol 2014;192:1064-71. 10.1016/j.juro.2014.04.001 [DOI] [PubMed] [Google Scholar]
- 6.Rink M, Xylinas E, Margulis V, et al. Impact of smoking on oncologic outcomes of upper tract urothelial carcinoma after radical nephroureterectomy. Eur Urol 2013;63:1082-90. 10.1016/j.eururo.2012.06.029 [DOI] [PMC free article] [PubMed] [Google Scholar]
- 7.Clements T, Messer JC, Terrell JD, et al. High-grade ureteroscopic biopsy is associated with advanced pathology of upper-tract urothelial carcinoma tumors at definitive surgical resection. J Endourol 2012;26:398-402. 10.1089/end.2011.0426 [DOI] [PubMed] [Google Scholar]
- 8.Colin P, Ouzzane A, Yates DR, et al. Influence of positive surgical margin status after radical nephroureterectomy on upper urinary tract urothelial carcinoma survival. Ann Surg Oncol 2012;19:3613-20. 10.1245/s10434-012-2453-9 [DOI] [PubMed] [Google Scholar]
- 9.Roscigno M, Brausi M, Heidenreich A, et al. Lymphadenectomy at the time of nephroureterectomy for upper tract urothelial cancer. Eur Urol 2011;60:776-83. 10.1016/j.eururo.2011.07.009 [DOI] [PubMed] [Google Scholar]
- 10.Deng H, Qi X, Zhang Y, et al. Diagnostic accuracy of contrast-enhanced computed tomography for esophageal varices in liver cirrhosis: a retrospective observational study. J Evid Based Med 2017;10:46-52. 10.1111/jebm.12226 [DOI] [PubMed] [Google Scholar]
- 11.Hanley JA, McNeil BJ. The meaning and use of the area under a receiver operating characteristic (ROC) curve. Radiology 1982;143:29-36. 10.1148/radiology.143.1.7063747 [DOI] [PubMed] [Google Scholar]
- 12.Valentini V, van Stiphout RG, Lammering G, et al. Nomograms for predicting local recurrence, distant metastases, and overall survival for patients with locally advanced rectal cancer on the basis of European randomized clinical trials. J Clin Oncol 2011;29:3163-72. 10.1200/JCO.2010.33.1595 [DOI] [PubMed] [Google Scholar]
- 13.Raman JD, Messer J, Sielatycki JA, et al. Incidence and survival of patients with carcinoma of the ureter and renal pelvis in the USA, 1973-2005. BJU Int 2011;107:1059-64. 10.1111/j.1464-410X.2010.09675.x [DOI] [PubMed] [Google Scholar]
- 14.Shariat SF, Godoy G, Lotan Y, et al. Advanced patient age is associated with inferior cancer-specific survival after radical nephroureterectomy. BJU Int 2010;105:1672-7. 10.1111/j.1464-410X.2009.09072.x [DOI] [PubMed] [Google Scholar]
- 15.Chromecki TF, Ehdaie B, Novara G, et al. Chronological age is not an independent predictor of clinical outcomes after radical nephroureterectomy. World J Urol 2011;29:473-80. 10.1007/s00345-011-0677-0 [DOI] [PubMed] [Google Scholar]
- 16.Brien JC, Shariat SF, Herman MP, et al. Preoperative hydronephrosis, ureteroscopic biopsy grade and urinary cytology can improve prediction of advanced upper tract urothelial carcinoma. J Urol 2010;184:69-73. 10.1016/j.juro.2010.03.030 [DOI] [PubMed] [Google Scholar]
- 17.Brown GA, Matin SF, Busby JE, et al. Ability of clinical grade to predict final pathologic stage in upper urinary tract transitional cell carcinoma: implications for therapy. Urology 2007;70:252-6. 10.1016/j.urology.2007.03.051 [DOI] [PMC free article] [PubMed] [Google Scholar]
- 18.Guarnizo E, Pavlovich CP, Seiba M, et al. Ureteroscopic biopsy of upper tract urothelial carcinoma: improved diagnostic accuracy and histopathological considerations using a multi-biopsy approach. J Urol 2000;163:52-5. 10.1016/S0022-5347(05)67970-0 [DOI] [PubMed] [Google Scholar]
- 19.Scolieri MJ, Paik ML, Brown SL, et al. Limitations of computed tomography in the preoperative staging of upper tract urothelial carcinoma. Urology 2000;56:930-4. 10.1016/S0090-4295(00)00800-1 [DOI] [PubMed] [Google Scholar]
- 20.Matin SF, Margulis V, Kamat A, et al. Incidence of downstaging and complete remission after neoadjuvant chemotherapy for high-risk upper tract transitional cell carcinoma. Cancer 2010;116:3127-34. 10.1002/cncr.25050 [DOI] [PubMed] [Google Scholar]
- 21.Kwak C, Lee SE, Jeong IG, et al. Adjuvant systemic chemotherapy in the treatment of patients with invasive transitional cell carcinoma of the upper urinary tract. Urology 2006;68:53-7. 10.1016/j.urology.2006.01.053 [DOI] [PubMed] [Google Scholar]
- 22.Wei CH, Hsieh RK, Chiou TJ, et al. Adjuvant methotrexate, vinblastine and cisplatin chemotherapy for invasive transitional cell carcinoma: Taiwan experience. J Urol 1996;155:118-21. 10.1016/S0022-5347(01)66564-9 [DOI] [PubMed] [Google Scholar]
- 23.Fujita K, Taneishi K, Inamoto T, et al. Adjuvant chemotherapy improves survival of patients with high-risk upper urinary tract urothelial carcinoma: a propensity score-matched analysis. BMC Urol 2017;17:110. 10.1186/s12894-017-0305-4 [DOI] [PMC free article] [PubMed] [Google Scholar]
- 24.Hellenthal NJ, Shariat SF, Margulis V, et al. Adjuvant chemotherapy for high risk upper tract urothelial carcinoma: results from the Upper Tract Urothelial Carcinoma Collaboration. J Urol 2009;182:900-6. 10.1016/j.juro.2009.05.011 [DOI] [PubMed] [Google Scholar]
- 25.Vassilakopoulou M, de la Motte Rouge T, Colin P, et al. Outcomes after adjuvant chemotherapy in the treatment of high-risk urothelial carcinoma of the upper urinary tract (UUT-UC): results from a large multicenter collaborative study. Cancer 2011;117:5500-8. 10.1002/cncr.26172 [DOI] [PubMed] [Google Scholar]
Associated Data
This section collects any data citations, data availability statements, or supplementary materials included in this article.
Supplementary Materials
The article’s supplementary files as


