Abstract
Mounting evidence suggests that a variety of disease states are pathophysiologically related to activation of the contact system in vivo. The plasma contact system is composed of a cascade of serine proteases initiated by surface activation of factor XII, which can then proceed through a procoagulant pathway by activating the intrinsic coagulation factor XI, or a proinflammatory pathway by activating prekallikrein. Serpins are the primary endogenous inhibitors of the contact system, which irreversibly inhibit their respective protease(s), forming a stable complex. We modified an existing assay strategy for detecting these complexes in plasma using ELISAs and determined the effect of preanalytical variation caused by anticoagulant selection and processing time. The assays were sensitive and specific to inherited deficiency of individual contact factors. We conclude that these assays are robust and represent a relatively simple approach to the assessment of contact factor activation in plasma samples.
Keywords: anticoagulant, enzyme, factor XI, factor XII, kallikrein, serpin
Essentials.
The factor XII–driven contact pathway initiates intrinsic coagulation and inflammation.
Clinical assays evaluating the contact system are limited, and not standardized.
Measured levels of complexes are higher in EDTA‐anticoagulated samples
1. INTRODUCTION
The contact system (CS) is composed of the zymogens factor XII (FXII) and prekallikrein (PK) and the cofactor high‐molecular‐weight kininogen (HK). Factor XI (FXI), of the intrinsic coagulation pathway, is often considered a component of this pathway, as it is activated by the enzymatically active form of FXII (FXIIa). Thereafter, activation of FIX by FXIa proceeds to the common coagulation pathway resulting in thrombin generation. Activation of the CS is by direct contact of FXII with negatively charged surfaces, an interaction that results in a conformational change to reveal the active site of FXII. FXIIa can then cleave and activate FXI and/or PK, resulting in the generation of the active enzymes, FXIa or kallikrein (PKa), respectively. Additionally, activation of FXII and PK generates a reciprocal feedback loop, which may overcome the inhibitory capacity of the checkpoint serine protease inhibitors. 1 The dominant inhibitor of FXIIa and PKa in plasma is C1 esterase inhibitor (C1). 2 Although FXIa is also principally inhibited by C1, it may also be inhibited by alpha‐1 antitrypsin (α1at), apha‐2 antiplasmin, and (particularly in the presence of heparin) antithrombin (AT). 3 Finally, activated FIX (FIXa) is mainly inhibited by AT in plasma, the efficacy of which is logarithmically increased by the addition of heparin. 4
A recent resurgence of interest in the role of the CS in thrombosis and inflammatory disorders 5 , 6 , 7 has not been accompanied by a widespread adoption of assays to assess acute or chronic activation of the CS in clinical settings. We therefore reevaluated and adapted an existing methodologic approach to measure in vivo CS activation using an ELISA platform. 8 The panel of assays we describe allow quantification of complexes of the CS enzymes with their serpins in human plasma. We herein describe assays that allow detection of the following complexes: FXIIa:C1, PKa:C1, FXIa:C1, FXIa:α1at, FXIa:AT, and FIXa:AT. A major challenge in measuring CS complexes is the potential for artifactual ex vivo contact activation after blood is drawn into collection vials. Thus, in order to determine the ideal conditions for assaying activity of CS complexes, we also sought to identify the preanalytical variables that could influence assay results and data interpretation.
2. MATERIALS AND METHODS
2.1. Reagents
All reagents are commercially available. Monoclonal antibodies against FIXa and FXIa were purchased from Haematologic Technologies (Essex Junction, VT, USA). Anti‐PKa was purchased from Molecular Innovations (Novi, MI, USA) and anti‐FXIIa was also acquired from Molecular Innovations. A polyclonal antibody against AT was purchased from Haematologic Technologies, and anti‐α1at was purchased from Abcam (Cambridge, MA, USA). Polyclonal anti‐C1 was purchased from Agrisera (Vännäs, Sweden), and monoclonal anti‐C1 was purchased from R&D Systems (Minneapolis, MN, USA). All detection antibodies were biotinylated using EZ‐Link Sulfo‐NHS‐Biotin (ThermoFisher Scientific, Waltham, MA, USA). Assay plates were Nunc Maxisorp (ThermoFisher Scientific). Blood collection tubes containing sodium citrate (105‐109 mmol/L), sodium heparin, and EDTA were purchased from Becton Dickinson (Franklin Lakes, NJ, USA). SCAT‐27 tubes containing citrate and corn trypsin inhibitor (CTI) were purchased from Haematologic Technologies. Factor‐deficient plasmas for factors IX, XI, and XII were purchased from George King Bio‐Medical (Overland Park, KS, USA), and PK‐deficient plasma was purchased from Diapharma (West Chester, OH, USA). Kaolin was purchased from Sigma‐Aldrich (St Louis, MO, USA).
2.2. Sample collection and processing
Seven healthy control individuals (3 male, 4 female; mean age 34.6 ± 9.3 years) were recruited. No subject had a history of thrombosis, bleeding, or angioedema, and none had never received a blood product. No individual was currently taking any antiplatelet or anticoagulant therapies. All patients were fasted for at least 10 hours before collection. The same phlebotomist conducted all of the blood draws to limit variability in sampling technique. All samples were collected under an approved Institutional Review Board protocol for venipuncture. Blood samples were obtained by antecubital venipuncture using a 21G butterfly needle. The first 3 mL of blood was discarded. Blood was drawn into vacuum tubes containing anticoagulant, mixed by 5 end‐to‐end inversions, and plasma was prepared by 2 successive centrifugations at 2500 g for 15 minutes at 21°C. All plasmas were frozen within 40 minutes of initial blood draw, including centrifugation time, aside from studies evaluating the effect of time until processing.
2.3. Enzyme:serpin complex ELISA assays
Assay standards were generated by incubating the active enzyme with its respective inhibitors at a 1:8 molar ratio for 5 hours at 37°C, with gentle mixing every 1 hour, in phosphate buffered saline (PBS). When using AT, 1 U/mL heparin was added to the mixture. Enzyme‐inhibitor complex standards were diluted to a 1μM enzyme concentration and aliquoted for storage at −80°C. It was assumed that the molar concentration of the complexes is equivalent to the concentration of the coagulation enzyme in the standard preparation. Each standard was tested for enzymatic activity using the following chromogenic substrates: FXIIa‐S2302 (Diapharma); FXIa‐S‐2366 (Diapharma); PKa‐PKAL (American Diagnostics, Nashville, TN, USA); FIXa‐Pefachrome IXa (Pentapharm, Aesch, Switzerland). Standards were diluted into deficient plasma for the respective factor of interest, obtained from individuals with severe genetic deficiency, and certified to have < 1% factor activity; for example, FXIIa:C1 complexes were serially diluted into FXII‐deficient plasma. Deficient plasmas were used as blank calibration controls.
Capture plates (either 96‐ or 384‐well formats) were coated (100 µL) with either 1 μg/mL (FIX or FXI) or 2 μg/mL (FXII or PK) capture antibody overnight (15 hours) at 4°C, in a commercially available coating buffer (eBioscience, San Diego, CA, USA). Wells were washed 3 times with PBS containing 0.01% Tween 20, inverting and blotting after each wash to absorb excess buffer. Wells were then blocked with 1% bovine serum albumin at room temperature for 1 hour. The wash steps were repeated prior to sample loading. Plasmas for assay of FIXa:AT, FXIa:AT, or FXIa:α1at were diluted 1:20, while for FXIa:C1 and FXIIa:C1, samples were diluted 1:40, and for PKa:C1, 1:160, unless otherwise noted. These samples were diluted into PBS containing 5 mM of benzamidine and 25 µM of Phe‐Pro‐Arg‐chloromethylketone (FPRck) to inhibit further enzymatic activity. After a 2‐hour sample incubation at room temperature plates were again washed 3 times as before. Biotinylated anti‐C1 antibody was then added at 50 ng/mL in PBS, while anti‐AT or anti‐α1at were added at a final concentration of 90 ng/mL. All were incubated for 1 hour at room temperature. Following another series of washes, streptavidin horseradish peroxidase was added according to the manufacturer’s specifications. After a final series of washes, 3,3′,5,5′‐tetramethylbenzidine substrate was added, and quenched with 0.18 M sulfuric acid after a development period of 10 minutes at room temperature, making sure to shield the plate from light. The colorimetric readout was assessed using a spectrophotometer measuring absorbance at 450‐nm wavelength.
2.4. Substrate cleavage assay
Factor XII zymogen (370 nM) was added to buffer containing 100 µM S‐2302 substrate, and varying concentrations of dipotassium EDTA. Substrate cleavage was indicated by optical density at 405 nm using a Synergy H1 plate reader (BioTek, Winooski, VT, USA).
2.5. FXIa unactivated clotting time
FXI‐deficient plasma was supplemented with 30 nM of synthetic phospholipid, and mixed with 4‐(2‐hydroxyethyl)‐1‐piperazineethanesulfonic acid) buffered saline ± FXIa and 12.5 mM of calcium. Immediately, using a Start hemostasis analyzer (Stago, Mississauga, ON, Canada), the protocol for activated partial thromboplastin time was initiated. Clotting time was assessed when mechanical translocation of a bead was inhibited by coagulation and increased plasma viscosity. Kaolin was used as a positive control, and vehicle was used as a negative control.
2.6. Statistical analysis
Statistical analysis was conducted using Prism version 8 (GraphPad Software, La Jolla, CA, USA). Comparison of 2 groups was performed using Student’s t test. Comparison of 3 or more groups was performed using 1‐ or 2‐way analysis of variance, as appropriate, and the Student‐Newman‐Keuls post hoc test. Data are displayed as mean ± standard error of the mean. P <.05 confers statistical significance.
3. RESULTS
3.1. Assay design and validation of standards
The basic design of enzyme:inhibitor complex ELISA, which captures the enzymatic component and probes for complexes using antibodies against the respective inhibitor is shown in Figure 1. Zymogen‐deficient plasma was used as the diluent for the respective enzyme:serpin standard. Figure 2 depicts the standard curves generated by adding complexes into these deficient plasmas, compared to complexes in buffer alone. Additionally, use of monoclonal versus polyclonal antibody for detection was compared, revealing no significant differences for FXIa and FXIIa complexes with C1 (Figure S1). These data demonstrate that enzyme capture, and assay range is accurate in both plasma and buffer. Moreover, usage of either a polyclonal or monoclonal antibody for serpin detection maintains the assay range.
Figure 1.
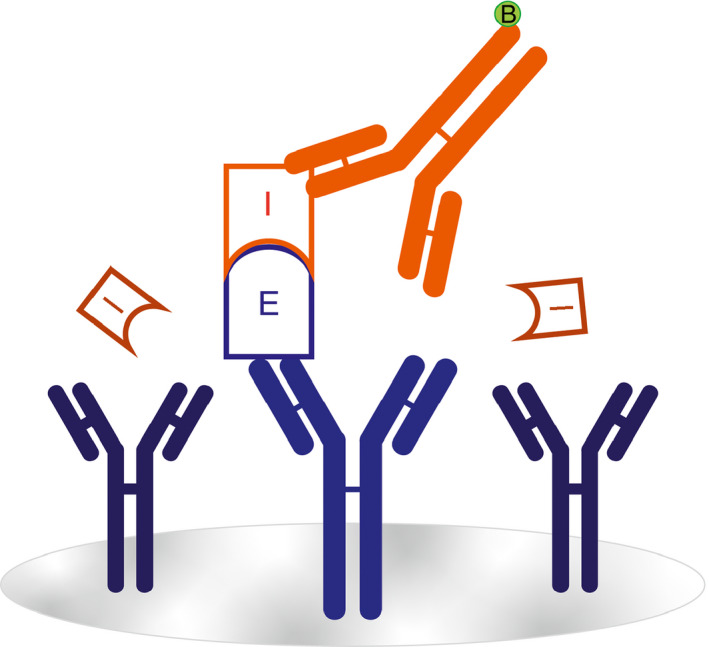
Illustrated concept of enzyme:serpin complex ELISA. Monoclonal antibodies (blue) specific to the enzymes (E) of the CS are used to coat the surface of an assay plate. Enzymes that have been inhibited (I) by a serpin are detected by a polyclonal antibody (red) specific for that serpin
Figure 2.
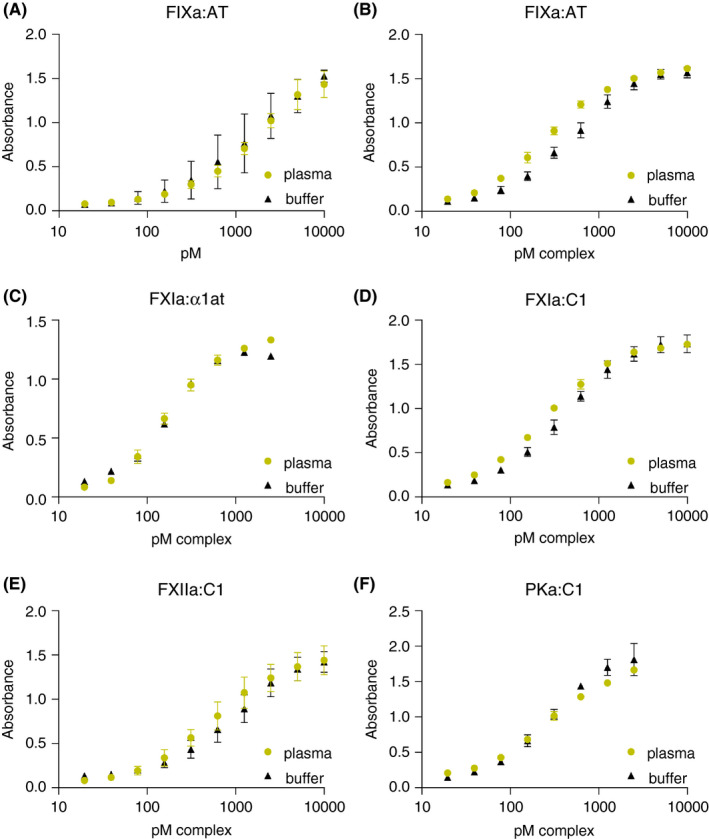
Assay sensitivity range. Plots of enzyme:serpin complex standards diluted into factor‐deficient plasmas (green), versus buffer (black). (A‐F) Concentration of complex standard (X axis) and respective absorbance (Y axis), title indicates assay. α1at, alpha‐1 antitrypsin; AT, antithrombin; C1, C1 esterase inhibitor; FIXa, activated factor IX; FXIa, activated factor XI; FXIIa, activated factor XII; PKa, kallikrein
We used substrate cleavage assays to verify that the standards contained minimal residual enzymatic activity. Enzyme‐serpin complexes were incubated with an appropriate chromogenic substrate for 45 minutes at 37°C and change in optical density over time was recorded (Figure 3). Enzyme alone was used as a positive control. In all assays, activity of the enzyme:serpin complexes was <1.5% of the respective enzyme concentration.
Figure 3.
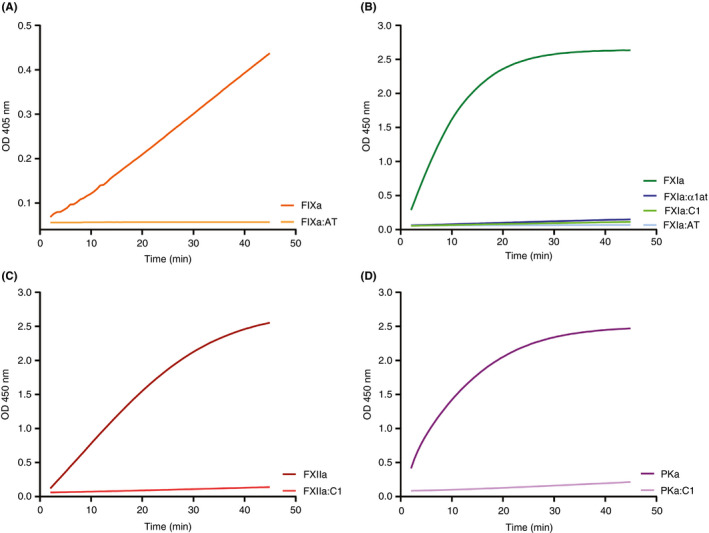
Generation of assay standards. Equal nanomolar concentration of active enzyme or enzyme:serpin complexes generated in vitro, were mixed with chromogenic substrates specific for the respective enzyme. Change in absorption of 450‐nm light measured by optical density (OD) is indicated on the Y axis, and time in minutes is indicated on the X axis. (A) FIXa and FIXa:AT complexes. (B) FXIa and complexes of FXIa:α1at, FXIa:AT, and FXIa:C1. (C) FXIIa versus XIIa:C1 complexes. (D) PKa compared to PKa:C1 complexes. Data are representative of 2 independent experiments; each condition was measured in triplicate and the average is depicted. α1at, alpha‐1 antitrypsin; AT, antithrombin; C1, C1 esterase inhibitor; FIXa, activated factor IX; FXIa, activated factor XI; FXIIa, activated factor XII; PKa, active enzyme of kallikrein
3.2. Assay development and analytical performance
ELISAs were tested for specificity and cross‐reactivity by assaying 200 nM of each preformed complex in each assay. Percent cross‐reactivity was calculated by dividing the calculated concentration of a cross‐reactive complex by the calculated concentration of the antigen with its intended antibody pair. These data are summarized in Table 1. For enzymes inhibited by AT or α1at, there was < 1% cross‐reactivity in all assays. For enzymes inhibited by C1, there was slightly more cross‐reactivity, with the highest level of cross‐reactivity seen in complexes of FXIIa:C1 at a level of 3.2% in the assay intended for PKa:C1. These data indicate that all assays have acceptably low cross reactivity at > 10‐fold saturating concentrations of the analytes.
Table 1.
Cross reactivity of assay standards
| FIXa:AT | FXIa:AT | FXIa:α1at | FXIa:C1 | FXIIa:C1 | PKa:C1 | X‐reactive | |
|---|---|---|---|---|---|---|---|
| FIXa:AT | 0.4 | 0.0 | 0.2 | 0.2 | 0.3 | ||
| FXIa:AT | 0.9 | 0.0 | 0.5 | 0.2 | 0.1 | ||
| FXIa:α1at | 0.0 | 0.0 | 0.4 | 0.0 | 0.2 | ||
| FXIa:C1 | 0.0 | 0.1 | 0.3 | 1.8 | 1.8 | ||
| FXIIa:C1 | 0.0 | 0.0 | 0.0 | 0.9 | 1.7 | ||
| PKa:C1 | 0.0 | 0.0 | 0.0 | 2.2 | 3.2 | ||
| Capture |
Rows represent the intended capture and detection strategy, while columns represent the complex standard used. Intersecting boxes represent the percent cross‐reactivity. Data depict the average percentages from three independent experiments
Abbreviations: α1at, alpha‐1 antitrypsin; AT, antithrombin; C1, C1 esterase inhibitor; FIXa, activated factor IX; FXIa, activated factor XI; FXIIa, activated factor XII; PKa, kallikrein.
Next, the assays were tested for intra‐ and inter‐assay variability. Four control samples were generated by the addition of 2, 20, or 200 µg/mL kaolin or vehicle plus 1 U/mL heparin, 12.5 mM calcium chloride, and 4 U/mL hirudin to normal plasma, followed by a 1‐hour incubation at 37°C. After activation was quenched using benzamidine and FPRck, kaolin particulate was centrifuged to pellet, and the plasma supernatant was frozen at −80°C. These samples were run in octuplicate on each plate. Intra‐assay variability was calculated by averaging the deviation of each test well from the mean value of all test wells for the same control sample in a single plate. Inter‐assay variation was calculated by determining the deviations of those averages across 15 plates. Table 2 summarizes the average variation of 15 plates of each assay depicted. Overall, the reproducibility was good, with the coefficient of variance consistent with a typical clinical assay.
Table 2.
Coefficient of variance (CV) within each assay, and across multiple assays.
| CV intra‐assay | CV interassay | |
|---|---|---|
| FIXa:AT | 5.9 ± 0.5 | 11.9 ± 1.1 |
| FXIa:AT | 4.1 ± 0.3 | 10.5 ± 1.8 |
| FXIa:α1at | 6.5 ± 0.9 | 13.2 ± 2.5 |
| FXIa:C1 | 6.8 ± 0.6 | 17.1 ± 1.9 |
| FXIIa:C1 | 4.8 ± 0.4 | 7.9 ± 0.7 |
| PKa:C1 | 5.1 ± 0.8 | 7.5 ± 0.4 |
Rows specify the assay performed, and columns represent intra‐ and inter‐assay CV values as defined. Intra‐assay variation was calculated as an average variation of 4 different control samples assayed in octuplicate per plate. Inter‐assay variation was calculated by determining the deviation of those averages across 15 plates.
Abbreviations: α1at, alpha‐1 antitrypsin; AT, antithrombin; C1, C1 esterase inhibitor; FIXa, activated factor IX; FXIa, activated factor XI; FXIIa, activated factor XII; PKa, kallikrein
Verification of the specificity of the assays was performed by contact activation of factor‐deficient plasmas by kaolin. Following activation, samples were spun to pellet the kaolin particulate, and supernatants were collected and frozen overnight. Plasma enzyme:serpin complexes were then quantified, as summarized in Table 3. We did not observe a significant increase in detected enzyme:serpin complexes in any factor‐deficient plasma following kaolin activation. However, activation of normal pooled plasma significantly increased the concentration of enzyme:serpin complexes in all cases. Collectively, these data suggest that capture of enzyme, and probing for serpin is an effective methodology to assay activation of the CS and intrinsic coagulation pathway in plasma.
Table 3.
Activation of factor‐deficient plasmas
| FIXa:AT | FXIa:AT | FXIa:α1at | FXIa:C1 | FXIIa:C1 | PKa:C1 | |
|---|---|---|---|---|---|---|
| NPP | 0.71 ± 0.02 | 0.22 ± <0.00 | 0.3 ± 0.04 | 0.14 ± 0.02 | 9.01 ± 0.24 | 8.96 ± 0.03 |
| NPP + Kaolin | 44.64 ± 2.06 | 5.99 ± 0.43 | 4.55 ± 0.09 | 7.3 ± 0.16 | 56.36 ± 1.19 | 236.25 ± 10.88 |
| Deficient | 0.84 ± <0.00 | 0.19 ± <0.00 | 0.19 ± 0.01 | 0.13 ± <0.00 | 1.81 ± 0.44 | 8.22 ± 0.11 |
| Def + Kaolin | 0.82 ± 0.02 | 0.19 ± <0.00 | 0.18 ± <0.00 | 0.13 ± <0.00 | 2.17 ± 0.15 | 8.48 ± <0.00 |
Rows indicate the type of plasma and activation status. Kaolin = 50 μg/mL kaolin at 37°C for 1 hour. Deficient (def) plasmas correspond to the complex being assayed; for example, FIX‐deficient patient was assayed for FIXa:AT complexes. Columns represent the assay being performed. Intersecting boxes indicate the nM concentration of complexes detected in the samples. These data are the result of 2 independent experiments.
Abbreviations: α1at, alpha‐1 antitrypsin; AT, antithrombin; C1, C1 esterase inhibitor; FIXa, activated factor IX; FXIa, activated factor XI; FXIIa, activated factor XII; NPP, normal pooled plasma; PKa, kallikrein.
3.3. Preanalytical variables
3.3.1. Anticoagulant
To determine if the anticoagulant used in the blood collection tubes contributed to variation in results, blood was collected into 5 different types of vacuum tubes at a single draw. Plasma was prepared from these tubes within 40 minutes of blood collection and stored at −80°C. These samples were then subjected to assay of the various enzyme:serpin complexes. Fold change from citrate for tubes containing EDTA, FPRck (in citrate), heparin, and CTI (in citrate) was calculated. In all assays, plasma in tubes containing EDTA differed significantly from citrate alone (Figure 4). Specifically, EDTA caused a significant increase in the concentration of detected complexes, possibly due to exogenous activation. In the assay detecting FXIIa:C1 complexes, CTI + citrate significantly reduced the concentration of detected complexes compared to citrate alone. However, in no other assay did the addition of CTI affect complex quantitation. In no assay did the addition of FPRck to citrate or collection in sodium heparin have a significant effect on detected complex levels.
Figure 4.
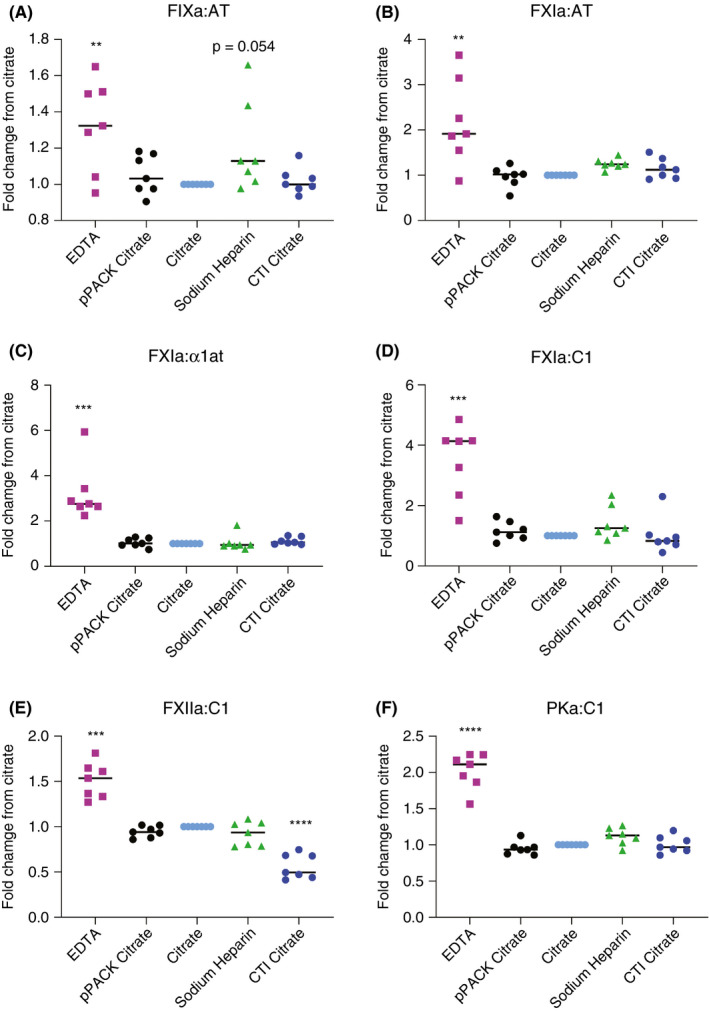
Anticoagulant selection as a preanalytical variable in contact activation analysis. Seven normal individuals were assayed following collection of blood into vials prefilled with various anticoagulant(s) as depicted on the X axis: citrate = 3.2%, EDTA = 7.2mg; FPRck = 25 μM, sodium heparin = 75 units; CTI = 50 µg/mL. The Y axis shows the fold change in complexes detected (μM) relative to concentration in citrate alone. **P ≤ .01, ***P ≤ .001, ****P ≤ .0001. α1at, alpha‐1 antitrypsin; AT, antithrombin; C1, C1 esterase inhibitor; FIXa, activated factor IX; FPRck, Phe‐Pro‐Arg‐chloromethylketone; FXIa, activated factor XI; FXIIa, activated factor XII; PKa, kallikrein
To identify the mechanism of increased complex detection in EDTA anticoagulant collection tubes, we designed studies to address if this was dependent on the cellular fraction. In the first experiment, whole blood collected in EDTA or citrate was mixed in a 1:1 ratio prior to separation of plasma. Separately, citrated plasma was added to a fresh vacutainer tube containing EDTA before a second centrifugation. These samples, labeled “blood 50/50” and “plasma 50/50,” respectively, were assayed for enzyme:serpin complexes (Figure 5). Interestingly, the presence of EDTA in the “blood 50/50,” or in “plasma 50/50” increased detection of FXIa:α1at and PKa:C1 complexes to levels comparable to direct collection of whole blood into EDTA. Using 2 different commercial preparations of FXII, we tested the enzymatic activity using a FXIIa‐specific substrate in different concentrations of EDTA (Figure S2). In aggregate, these data suggest that FXII activation during blood collection may be enhanced by EDTA, but this is independent of the cellular fraction.
Figure 5.
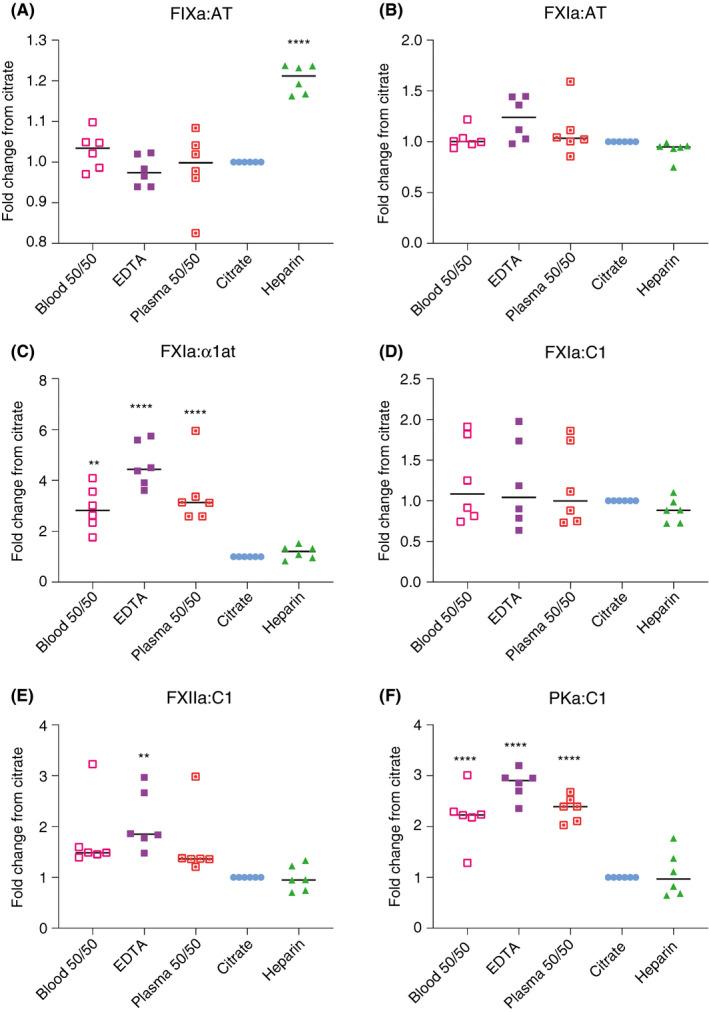
Effects of EDTA on contact activation in whole blood versus plasma. Enzyme:serpin analysis on plasmas collected in various anticoagulants as indicated. All values shown are relative to pM complex concentration detected in citrated plasma. **P ≤ .01, ****P ≤ .0001. α1at, alpha‐1 antitrypsin; AT, antithrombin; C1, C1 esterase inhibitor; FIXa, activated factor IX; FXIa, activated factor XI; FXIIa, activated factor XII; PKa, kallikrein
3.3.2. Processing time
The effect of elapsed time following collection on ex vivo activation of the CS was evaluated using the respective ELISA. Collection tubes were placed upright at room temperature for 0, 1, 2, or 8 hours prior to centrifugation, or agitated for 1 hour. In no case were we able to detect any significant difference in complex quantitation after 1 hour of incubation, even when agitated (Figure 6). However, following 2 hours of incubation, FXIIa:C1 levels increased significantly. At 8 hours after blood draw, FXIIa:C1, FXIa:C1, and FXIa:α1at demonstrated a significant increase in complex formation, likely indicative of time‐dependent ex vivo CS activation.
Figure 6.
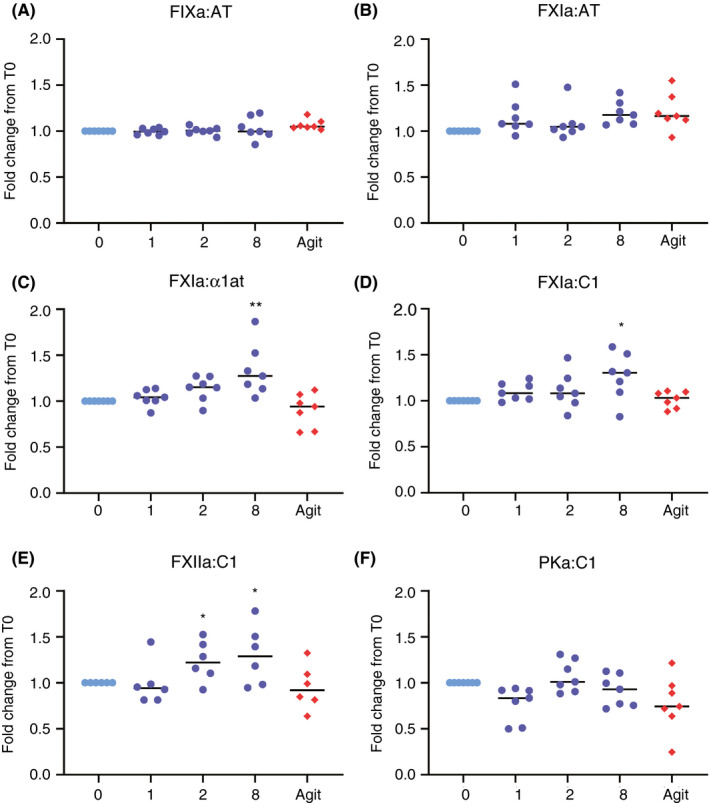
Delayed processing time contributes to ex vivo activation of the contact system. Blood was collected from seven normal individuals and allowed to incubate at room temperature for given time points, or agitated (Agit) for 1 hour. The X axis represents the time course in hours. The fold change from citrate at 0 hour was calculated per patient, illustrated on the Y axis. *P ≤ .05, **P ≤ .01. α1at, alpha‐1 antitrypsin; AT, antithrombin; C1, C1 esterase inhibitor; FIXa, activated factor IX; FXIa, activated factor XI; FXIIa, activated factor XII; PKa, kallikrein
4. DISCUSSION
In this communication, we describe the analytic and preanalytic characteristics of several ELISA assays that can be used to measure the in vivo generation of enzymes of the contact and intrinsic pathways. The data presented herein suggest that these assays provide a sensitive, specific, and reproducible methodologic approach. The choice of anticoagulant demonstrated significant differences within the same patient sample, with EDTA apparently causing increased ex vivo formation of all complexes assayed. EDTA anticoagulation has been demonstrated to produce higher D‐dimer levels compared to citrate, 9 supporting this rationale. It is possible that anticoagulant selection may influence sample pH, though reports differ. 10 , 11 However, decreasing pH has been demonstrated to reduce FXII‐surface interaction. 12 The addition of CTI was necessary to prevent ex vivo FXIIa:C1 complex formation, an indicator of ex vivo surface activation of coagulation in the collection tubes. 13
Measurement of enzyme:serpin complexes in plasma is an established approach to assess activation of coagulation pathways; for example, quantitation of thrombin:antithrombin and plasmin:antiplasmin complexes are accepted biomarkers of coagulation and fibrinolysis activation, respectively. The assays that we have developed are modified versions of previously described ELISAs that have been used to measure in vivo contact activation in sepsis, 2 , 14 , 15 endotoxemia, 16 dengue fever, 17 and cardiovascular disease. 18 , 19 Importantly, however, in those studies, quantitation of FXIIa:C1 and PKa:C1 complexes was performed by capturing C1 using a monoclonal antibody that detects a neoantigen present in cleaved or FXIIa‐ or PKa‐bound C1. 2 The currently described approach offers several advantages, specifically: (i) quantitation of total antigen (zymogen and complexes) within the same dilution allows generation of a ratio of activation without extrapolation across separate assays; (ii) samples can be probed for multiple discrete serpins while keeping enzyme concentration constant to determine inhibition ratios; and (iii) given that the zymogens circulate at a much lower concentration than the serpins, a much greater sensitivity and a larger analytical fraction can be achieved. For enzymes that are inactivated by several proteases, the plasma concentrations of the various serpin‐bound complexes will depend on their circulating half‐life (t1/2). Thus, for example, while C1 is the dominant inhibitor of FXIa in plasma (accounting for almost 50% of FXIa inactivation), its relatively shorter plasma t1/2 of approximately 100 minutes means that in the presence of acute activation of coagulation, the measured levels of FXIa:α1at—which accounts for only about 25% of FXIa inactivation but has a circulating t1/2 of approximately 350 minutes—will be relatively “overrepresented.” 20 Moreover, it has been demonstrated that addition of heparin to the sample results in a shift in the percentage of FXIa bound to AT. 3 This serves as an important consideration when analyzing plasmas from individuals with central venous access catheters, or heparinized intravenous needles, such as in hemodialysis patients or the critically ill. Inferring circulating enzymatic levels of a factor with multiple potential serpins, such as FXIa, from summation of the levels of these complexes is one strategy that could be used. Addition of a known concentration of FXIa directly to FXI‐deficient plasma and using these assays to “recover” the enzyme could be calculated as input versus output, providing a measure of total enzyme activity. 3 An alternative strategy would be to couple the analysis of complexes with total zymogen/enzyme levels, and to ascertain the percentage of circulating activated zymogen, perhaps in a dual‐color fluorescent immunoassay. Low amounts of FXIa can lead to thrombin generation, 21 suggesting a need for highly sensitive assays that can detect FXI activation in nonsevere disease states. The assays for FXIa used in this report are sensitive to FXI concentrations as low as 10‐40 pM, similar to earlier reports. 3 We measured plasma clotting time following titration of FXIa (Figure S3) into FXI deficient plasma to demonstrate that our assays are capable of detecting FXIa activity at levels that would affect a typical clotting assay.
Several alternative approaches to assess contact system activation in vivo have been proposed. Deficiency of individual zymogens and/or HK by one‐stage clotting assay has been used to infer ongoing factor consumption in some studies. 22 Similarly, ELISA assays that quantify deficiency of these proteins, which is presumed to be acquired, have been similarly interpreted. 22 , 23 Other groups have used functional assays to measure circulating active enzyme concentrations by the use of chromogenic or fluorogenic substrates, 24 or by clotting activity–based assays. 25 In addition, a number of specific isoform antibodies or nanobodies have been developed to quantify free (uncomplexed) activated FXII species. 26 , 27 Finally, several groups have developed assays to quantify HK cleavage products, including bradykinin. 28 , 29 To our knowledge, no studies have directly compared the performance or utility of these assays as diagnostic or prognostic clinical aids, although the range of applications is potentially very broad. One such application is inherited deficiency of C1 esterase inhibitor, which is associated with hereditary angioedema, a disorder characterized by episodic and sometimes life‐threatening soft‐tissue swelling due to unregulated FXII activation. Similarly, these assays may find utility in the assessment of contact and/or intrinsic pathway activation in thrombotic disorders, where animal models suggest that inhibition of FXI(a) or FXII(a) may provide safe and effective anticoagulation. 5 , 6 , 7 Finally, as we have shown, the assays may be used to establish the diagnosis of inherited deficiency of any of the contact or intrinsic factors following activation of the plasma by kaolin.
RELATIONSHIP DISCLOSURE
None of the authors has any relevant conflict of interest to declare.
Supporting information
Fig S1
Fig S2
Fig S3
Henderson MW, Noubouossie DF, Ilich A, et al. Protease: Serpin complexes to assess contact system and intrinsic pathway activation. Res Pract Thromb Haemost. 2020;4:789–798. 10.1002/rth2.12389
Handling Editor: Yotis Senis
Funding information
This study was funded by NIH grants 1UO1HL117659 and R01HL142604.
Contributor Information
Michael W. Henderson, @ConcernCarolina.
Nigel S. Key, Email: nigel_key@med.unc.edu.
REFERENCES
- 1. De Maat S, Hofman ZLM, Maas C. Hereditary angioedema: the plasma contact system out of control. J Thromb Haemost. 2018;16(9):1674–85. [DOI] [PubMed] [Google Scholar]
- 2. Nuijens JH, Huijbregts CC, Eerenberg‐Belmer AJ, Abbink JJ, Strack van Schijndel RJ, Felt‐Bersma RJ, et al. Quantification of plasma factor XIIa‐Cl(‐)‐inhibitor and kallikrein‐Cl(‐)‐inhibitor complexes in sepsis. Blood. 1988;72(6):1841–8. [PubMed] [Google Scholar]
- 3. Wuillemin WA, Minnema M, Meijers JC, Roem D, Eerenberg AJ, Nuijens JH, et al. Inactivation of factor XIa in human plasma assessed by measuring factor XIa‐protease inhibitor complexes: major role for C1‐inhibitor. Blood. 1995;85(6):1517–26. [PubMed] [Google Scholar]
- 4. Rosenberg JS, McKenna PW, Rosenberg RD. Inhibition of human factor IXa by human antithrombin. J Biol Chem. 1975;250(23):8883–8. [PubMed] [Google Scholar]
- 5. Gailani D, Gruber A. Factor XI as a therapeutic target. Arterioscler Thromb Vasc Biol. 2016;36(7):1316–22. [DOI] [PMC free article] [PubMed] [Google Scholar]
- 6. Lorentz CU, Verbout NG, Wallisch M, Hagen MW, Shatzel JJ, Olson SR, et al. Contact activation inhibitor and factor XI antibody, AB023, produces safe, dose‐dependent anticoagulation in a phase 1 first‐in‐human trial. Arterioscler Thromb Vasc Biol. 2019;39(4):799–809. [DOI] [PMC free article] [PubMed] [Google Scholar]
- 7. Maas C, Renne T. Coagulation factor XII in thrombosis and inflammation. Blood. 2018;131(17):1903–9. [DOI] [PubMed] [Google Scholar]
- 8. Nuijens JH, Huijbregts CCM, Cohen M, Navis GO, de Vries A , Eerenberg AJM, et al. Detection of activation of the contact system of coagulation in vitro and in vivo: quantitation of activated Hageman factor‐C‐1‐inhibitor and kallikrein‐C‐1‐inhibitor complexes by specific radioimmunoassays. Thromb Haemost. 1987;58(2):778–85. [PubMed] [Google Scholar]
- 9. Baker PM, Howgate SJ, Atherton J, Keeling DM. Comparison of a point of care device against current laboratory methodology using citrated and EDTA samples for the determination of D‐dimers in the exclusion of proximal deep vein thrombosis. Int J Lab Hematol. 2010;32(5):477–82. [DOI] [PubMed] [Google Scholar]
- 10. Gonzalez‐Covarrubias V, Dane A, Hankemeier T, Vreeken RJ. The influence of citrate, EDTA, and heparin anticoagulants to human plasma LC‐MS lipidomic profiling. Metabolomics. 2013;9(2):337–48. [Google Scholar]
- 11. Malmgren R, Beving H, Olsson P. Effects of different anticoagulants on human platelet size distribution and serotonin (5‐HT) induced shape change and uptake kinetics. Thromb Res. 1985;38(6):649–61. [DOI] [PubMed] [Google Scholar]
- 12. Samuel E, Samuel M, Villanueva GB. A model demonstrating different interactions of human coagulation factor XII (Hageman factor) with the surface at physiological and lower pH. Biochem Mol Biol Int. 1994;33(5):827–34. [PubMed] [Google Scholar]
- 13. Ramstrom S. Clotting time analysis of citrated blood samples is strongly affected by the tube used for blood sampling. Blood Coagul Fibrinolysis. 2005;16(6):447–52. [DOI] [PubMed] [Google Scholar]
- 14. Wuillemin WA, Fijnvandraat K, Derkx BHF, Peters M, Vreede W, ten Cate H, et al. Activation of the intrinsic pathway of coagulation in children with meningococcal septic shock. Thromb Haemost. 1995;74(6):1436–41. [PubMed] [Google Scholar]
- 15. Wuillemin WA, Lammle B. Activation of the contact system in patients with sepsis and with septic shock. Blood. 1997;89(10):3893–4. [PubMed] [Google Scholar]
- 16. Minnema MC, Pajkrt D, Wuillemin WA, Roem D, Bleeker WK, Levi M, et al. Activation of clotting factor XI without detectable contact activation in experimental human endotoxemia. Blood. 1998;92(9):3294–301. [PubMed] [Google Scholar]
- 17. van Gorp ECM , Minnema MC, Suharti C, Mairuhu ATA, Brandjes DPM, ten Cate H , et al. Activation of coagulation factor XI, without detectable contact activation in dengue haemorrhagic fever. Br J Haematol. 2001;113(1):94–9. [DOI] [PubMed] [Google Scholar]
- 18. Govers‐riemslag JWP, Smid M, Cooper JA, Bauer KA, Rosenberg RD, Hack CE, et al. The plasma kallikrein‐kinin system and risk of cardiovascular disease in men. J Thromb Haemost. 2007;5(9):1896–903. [DOI] [PubMed] [Google Scholar]
- 19. Minnema MC, Peters RJG, de Winter R , Lubbers YPT, Barzegar S, Bauer KA, et al. Activation of clotting factors XI and IX in patients with acute myocardial infarction. Arterioscler Thromb Vasc Biol. 2000;20(11):2489–93. [DOI] [PubMed] [Google Scholar]
- 20. Wuillemin WA, Hack CE, Bleeker WK, Biemond BJ, Levi M, ten Cate H. Inactivation of factor Xia in vivo: studies in chimpanzees and in humans. Thromb Haemost. 1996;76(4):549–55. [PubMed] [Google Scholar]
- 21. Wolberg AS, Kon RH, Monroe DM, Hoffman M. Coagulation factor XI is a contaminant in intravenous immunoglobulin preparations. Am J Hematol. 2000;65(1):30–4. [DOI] [PubMed] [Google Scholar]
- 22. Roeise O, Sivertsen S, Ruud TE, Bouma BN, Stadaas JO, Aasen AO. Studies on components of the contact phase system in patients with advanced gastrointestinal cancer. Cancer. 1990;65(6):1355–9. [DOI] [PubMed] [Google Scholar]
- 23. Battistelli S, Stefanoni M, Lorenzi B, Dell'Avanzato R, Varrone F, Pascucci A, et al. Coagulation factor levels in non‐metastatic colorectal cancer patients. Int J Biol Markers. 2008;23(1):36–41. [PubMed] [Google Scholar]
- 24. Butenas S, Orfeo T, Gissel MT, Brummel KE, Mann KG. The significance of circulating factor IXa in blood. J Biol Chem. 2004;279(22):22875–82. [DOI] [PubMed] [Google Scholar]
- 25. Butenas S, Undas A, Gissel MT, Szuldrzynski K, Zmudka K, Mann KG. Factor XIa and tissue factor activity in patients with coronary artery disease. Thromb Haemost. 2008;99(1):142–9. [DOI] [PubMed] [Google Scholar]
- 26. de Maat S , van Dooremalen S , de Groot PG , Maas C A nanobody‐based method for tracking factor XII activation in plasma. Thromb Haemost. 2013;110(3):458–68. [DOI] [PubMed] [Google Scholar]
- 27. Esnouf MP, Burgess AI, Dodds AW, Sarphie AF, Miller GJ. A monoclonal antibody raised against human beta‐factor XIIa which also recognizes alpha‐factor XIIa but not factor XII or complexes of factor XIIa with C1 esterase inhibitor. Thromb Haemost. 2000;83(6):874–81. [PubMed] [Google Scholar]
- 28. Hofman ZLM, de Maat S, Suffritti C, Zanichelli A, van Doorn C, Sebastian SAE, et al. Cleaved kininogen as a biomarker for bradykinin release in hereditary angioedema. J Allergy Clin Immunol. 2017; 140(6):1700–3. [DOI] [PubMed] [Google Scholar]
- 29. Yamamoto‐Imoto H, Zamolodchikov D, Chen Z‐L, Bourne SL, Rizvi S, Singh P, et al. A novel detection method of cleaved plasma high‐molecular‐weight kininogen reveals its correlation with Alzheimer's pathology and cognitive impairment. Alzheimers Dement (Amst). 2018;10:480–9. [DOI] [PMC free article] [PubMed] [Google Scholar]
Associated Data
This section collects any data citations, data availability statements, or supplementary materials included in this article.
Supplementary Materials
Fig S1
Fig S2
Fig S3


