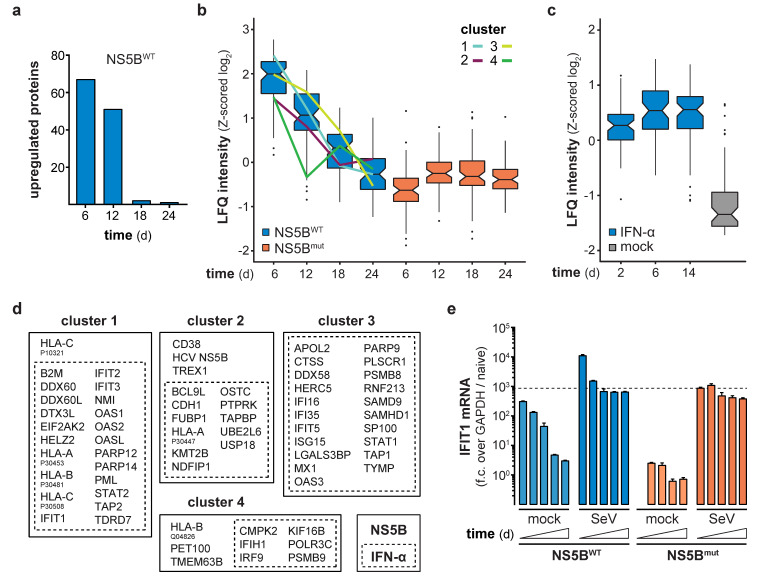
Figure 3.
Time-resolved proteomics identifies differentially regulated proteins in NS5B and IFN-α treated cells. (a) Number of significantly upregulated proteins (two-tailed Student’s t-test, S0 = 1, permutation-based FDR < 0.01, n = 4 technical replicates) at the indicated days post NS5BWT transduction as compared to NS5Bmut. (b,c) Box and whisker plots (median, hinges: 1st and 3rd quartiles, whiskers: ± 1.5 × inter-quartile-range) of Z-scored median log2 label-free quantification (LFQ) intensities of proteins, significantly upregulated at 6 days post NS5BWT transduction, tracked over time in NS5BWT and NS5Bmut transduced (b) or 8.25 ng/mL IFN-α and mock treated (c) cells. Hierarchical clustering (Euclidean distances, Ward agglomeration method; Figure S3) of Z-scored log2 LFQ intensities of these proteins in NS5BWT transduced cells across time points identified four main clusters of differentially upregulated proteins (cluster 1, light blue; cluster 2, purple; cluster 3, yellow; cluster 4, green). (d) Intersection of NS5BWT (solid box) upregulated proteins at day 6 post transduction with data of IFN-α (dashed box) treated cells. Upregulated proteins were assigned to each of the identified clusters. (e) IFIT1 mRNA levels in A549 cells non-infected or infected with Sendai Virus (SeV) at 7, 11, 15, 19, and 23 days after NS5BWT or NS5Bmut transduction. IFIT1 fold change (f.c., mean + s.d. of n = 3 technical replicates) over GAPDH and naïve cells was calculated. The dashed line indicates IFIT1 mRNA levels in SeV infected cells 7 days after NS5Bmut transduction.

