

Abstract
The purpose of this paper is to establish ways to predict the spatial distribution of the use of the intellectual property system from information on industrial property applications and grants (distinctive signs and new creations) and copyright registrations in 2018. This will be done using supervised learning algorithms applied to information on industrial property applications and grants (trademarks and new creations) and copyright registrations in 2018. Within the findings, 4 algorithms were identified with a level of explanation higher than 80%: (i) Linear Regression, with an elastic network regularization; (ii) Stochastic Gradient Descent, with Hinge loss function, Ringe regularization (L2) and a constant learning rate; (iii) Neural Networks, with 1,000 layers, with Adam’s solution algorithm and 2,000 iterations; (iv) Random Forest, with 10 trees.
Keywords: Spatial distribution, Distinctive signs, New creations, Supervised learning, Machine learning
Introduction
According to the World Intellectual Property Organization (WIPO, 2016), intellectual property (IP) refers to all creations of the intellect, which include (i) inventions, (ii) literary, artistic and scientific works, (iii) symbols, names and images used in commerce. Under the traditional protection scheme, IP is divided into three branches: industrial property, copyright and related rights, and plant varieties [1].
Specifically, Colombia is characterized by low levels of use of copyright and industrial property protection systems [2]. According to the World Intellectual Property Organization [3, 4], in 2017 Colombia ranked 48th out of 129 countries in terms of applications for patent registrations, 36th in terms of trademark applications and 69th in terms of industrial registrations.
The use of the industrial property system by residents in Colombia is significantly lower than the use given by foreigners. Therefore, the purpose of this paper is to establish how to predict the spatial distribution of the use of the intellectual property system from information on industrial property applications and grants (distinctive signs and new creations) and copyright registrations in 2018.
The data used correspond to records from the Superintendence of Industry and Commerce [5], on new creations and distinctive signs requested and granted at the departmental level in 2018, and information from the different types of copyright records in 2018 from the National Copyright Directorate [6].
In order to achieve this purpose, several supervised learning algorithms are applied [7], such as (Random Forest, KNN, Support Vector Machines, linear regression, neural networks, among others [8]).
Literature Review
Intellectual Property
Some of the most recent studies on intellectual property include the following. [9] found that reforms in IP systems in some countries led to a significant reduction in the cost of debt in IP-intensive industries, through lower rates of borrowing. [10] employed a dynamic panel, for 70 countries with data between 1965 and 2009, establishing that patent rights have no effect on productivity growth.
There is also the study of [11]. These authors found that the enforcement of intellectual property rights is positively related to increased exports to advanced economies [12], but has negative effects in developing countries, associated with reduced speed of technology transfers and incentives to invest in R&D. [13] established that rich countries and small or poor countries apply intellectual property rights for different reasons. The former to protect innovations, the latter seeking access to foreign markets. According to these authors, emerging countries have greater flexibility in the application of IP systems. For their part, [14] showed that most large developers employ a combination of informal mechanisms and formal intellectual property rights (copyright, patents and trademarks).
With respect to the use of trademarks, the study by [15], who were able to establish that trademarks allow for the measurement of the degree of innovation and the capacity of response in foreign markets, stands out. [16], based on 712 observations from a cross-sector sample of European companies, applied a panel data model. The results revealed a positive relationship between the companies’ international performance and the company’s attitude towards enriching its portfolio with externally developed trademarks. [17], through a survey of 48 Portuguese companies located in S&T parks and incubators, analyzed the direct and indirect effects of intellectual property rights protection mechanisms. Contrary to most studies, they found that formal protection of intellectual property rights is detrimental to the competitiveness of firms, but other non-formal mechanisms such as trade secrets do encourage it.
The paper by [18], uses data from 14,065 Chinese companies between 2007 and 2013. The authors use a discrete time risk model and analyze the effects of differences in internal and external innovation mechanisms, specifically the efficiency of innovation and the spillover effect of trade, on the probability of survival of firms.
As can be seen, the analysis of intellectual property is ongoing and the means of analysis are diverse, but generally involve the use of quantitative tools. The methods proposed in this paper are related to machine learning. A brief state of the art on its applications is presented below.
Machine Learning
In recent literature there are several machine learning applications that include medicine, energy, education, intellectual property, among others. [19] used machine learning algorithms to predict and diagnose heart disease in India. They compared the accuracy of four machine learning algorithms using 14 attributes obtained from intensive care unit data. A similar study, but applied to fatty liver disease, considering 577 patients was developed by [20].
From other fields, in [21], they apply different algorithms to public transport data from EUBra-BIGSEA (Europe-Brazil Collaboration of Big Data Scientific Research Through Cloud-Centric Applications). [22] applied decode-based learning for machine translation. [23] predict the energy produced in a wind farm from line regression, decision tree, K-neighbor, and cross-validation to reduce variance.
As for the applications of machine learning to intellectual property, in [24], they reviewed 57 papers on artificial intelligence, automatic and in-depth learning associated with intellectual property. In [25], the employed algorithms were Support Vector Machines, Neural Networks and Decision Trees.
Method
This section describes the data used, the design of the study, the procedure and the indicators and models used for the analysis.
Data
This paper uses as its primary source the records of the Superintendence of Industry and Commerce [5], on new creations and distinctive signs requested and granted at the departmental level in 2018 and information from the different types of copyright registrations in 2018 from [6]. Table 1 presents the data, sources and units used for the following sections. The free software used was Orange (Demsar et al. 2013).
Table 1.
Data sources and units used
| Variable | Unit | Source |
|---|---|---|
| Projected population 2018 | Number of inhabitants | [27] |
| Application for patents of invention | Ratio for every 10,000 inhabitants | [5] |
| Application for utility model patents | Ratio for every 10,000 inhabitants | [5] |
| Granting of patents of invention | Ratio for every 10,000 inhabitants | [5] |
| Granting of utility model patents | Ratio for every 10,000 inhabitants | [5] |
| Chemical Invention Patents Filed | Ratio for every 10,000 inhabitants | [5] |
| Electricity/Electronics Patents Filed | Ratio for every 10,000 inhabitants | [5] |
| Industrial design application | Ratio for every 10,000 inhabitants | [5] |
| Industrial designs awarded | Ratio for every 10,000 inhabitants | [5] |
| Designations of origin submitted | Ratio for every 10,000 inhabitants | [5] |
| Commercial School presented | Ratio for every 10,000 inhabitants | [5] |
| Commercial slogans presented | Ratio for every 10,000 inhabitants | [5] |
| Collective brand presented | Ratio for every 10,000 inhabitants | [5] |
| Trademarks presented | Ratio for every 10,000 inhabitants | [5] |
| Certification brand submitted | Ratio for every 10,000 inhabitants | [5] |
| Trade names presented | Ratio for every 10,000 inhabitants | [5] |
| Trade names granted | Ratio for every 10,000 inhabitants | [5] |
| Certification brand awarded | Ratio for every 10,000 inhabitants | [5] |
| Trademark granted | Ratio for every 10,000 inhabitants | [5] |
| Collective brand granted | Ratio for every 10,000 inhabitants | [5] |
| Commercial slogan granted | Ratio for every 10,000 inhabitants | [5] |
| Commercial teaching granted | Ratio for every 10,000 inhabitants | [5] |
| Phonogram registration | Ratio for every 10,000 inhabitants | [6] |
| Registration of artistic work | Ratio for every 10,000 inhabitants | [6] |
| Registration of unpublished literary work | Ratio for every 10,000 inhabitants | [6] |
| Registration of musical work | Ratio for every 10,000 inhabitants | [6] |
| Registration of contract and other acts | Ratio for every 10,000 inhabitants | [6] |
| Registration of audiovisual works | Ratio for every 10,000 inhabitants | [6] |
| Registration of published literary work | Ratio for every 10,000 inhabitants | [6] |
| Software Registration | Ratio for every 10,000 inhabitants | [6] |
Study Design
This study is quantitative and its scope is descriptive and predictive. The design is non-experimental and cross-sectional. The units of analysis are the departments of Colombia.
Procedure
Information on the statistics of new creations and distinctive signs was searched on the page of [5], and on copyright registrations on [6]. The most recent information was identified, i.e., data available from 2018. The information was organized considering the departments as units of analysis.
In order to control by the number of inhabitants of each department, the ratio of respective applications or concessions per 10,000 inhabitants was calculated. Different methods (algorithms) of supervised learning were applied for information processing: AdaBoost, Random Forest, SVM (Support Vector Machines), Neural Network, Stochastic Gradient Descent, Linear Regression, KNN and decision tree learning algorithm [28, 29].
Results
In this section, the different algorithms used to predict the number of trademarks are analyzed. The novelty of the analysis lies in the use of other information related to the use of industrial property and copyright protection systems, and the handling of artificial intelligence for projection.
In Fig. 1, the results for each of the algorithms used are presented. The results show the root mean square error (RMSE), the root mean absolute error (MAE) and R2, i.e. the proportion of the variance in the dependent variable that is predictable from the independent variables.
Fig. 1.
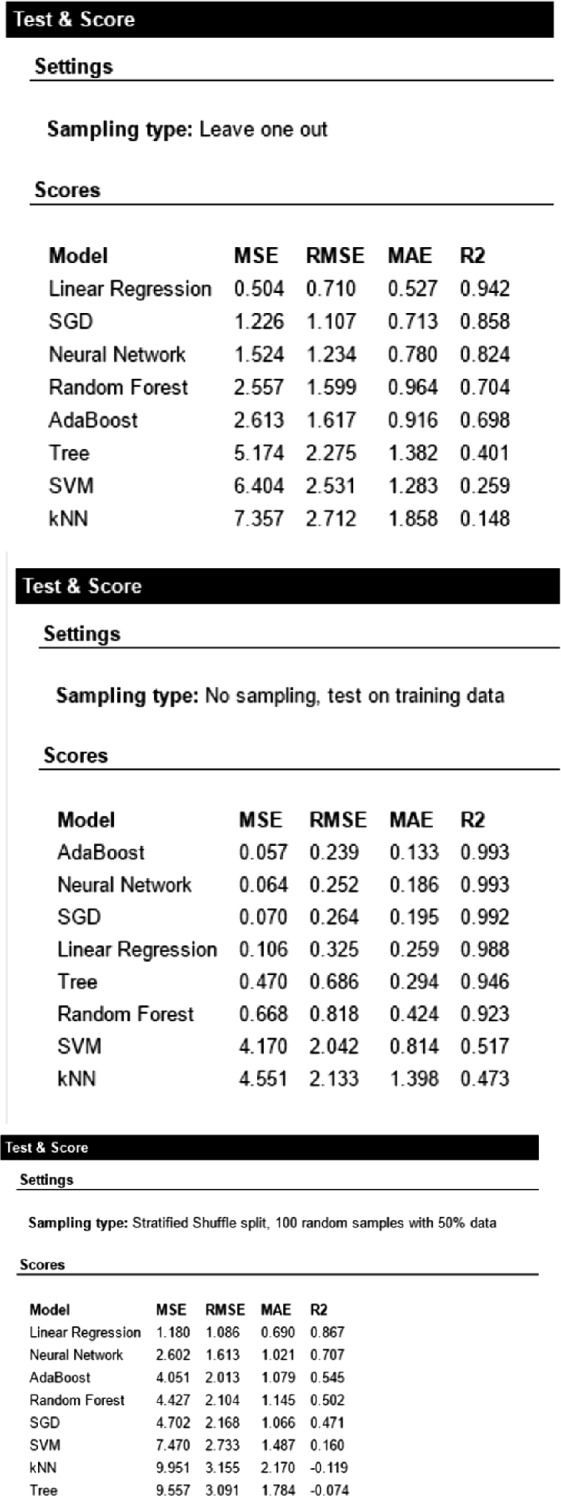
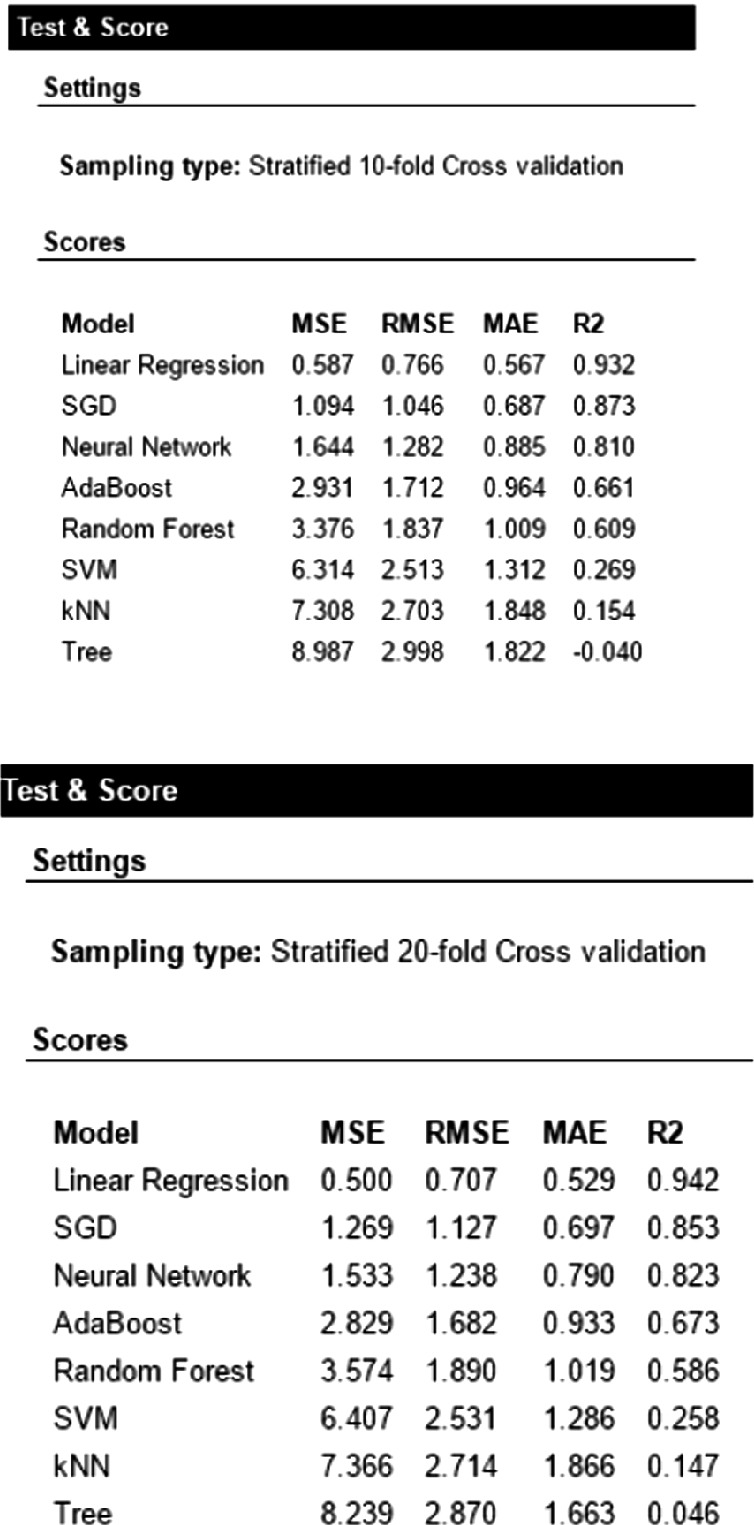
Algorithm results.
Source: own elaboration using Orange [26].
The different types of sampling used for prediction are shown: leave one out, test on the training data, boostraping of 100 repetitions with a training sample of 50% and 50% prediction, cross validation of 10 and 20 folds.
Based on the above, the evaluation is carried out considering R2 and the lowest MAE. The algorithms that presented the best behavior were:
Linear Regression, with an elastic network regulation
Stochastic Gradient Descent, with Hinge loss function, Ringe regularization (L2) and a constant learning rate
Neural networks, with 1,000 layers, with Adam’s solution algorithm and 2,000 iterations.
Random forests, with 10 trees
The AdaBoost algorithm has an over-adjustment to the data, so it should not be considered. The algorithms with less predictive capacity were: SVM, KNN and decision trees. The prediction results are presented in Annex 2.
Discussion and Conclusions
In the case of supervised learning it was possible to identify 4 algorithms with a level of explanation higher than 80%, these are: (i) Linear Regression, with an elastic network regularization; (ii) Stochastic Gradient Descent, with Hinge loss function, Ringe regularization (L2) and a constant learning rate; (iii) Neural Networks, with 1,000 layers, with Adam’s solution algorithm and 2,000 iterations; (iv) Random Forest, with 10 trees. The results found in this study are consistent with those of [25], and some algorithms are added.
The originality of this study lies in: (i) the transformation in ratios of the variables, since the other studies on intellectual property make the analysis in absolute values; (ii) the compendium of the information of the systems of protection of the intellectual property in Colombia; (iii) application of the artificial intelligence (machine learning) for the description and projection.
It is suggested that for future research a multivariate spatial analysis be conducted, for example using a geographically weighted regression or a panel data analysis, to determine the behavior of the innovation of the record and granting of distinctive signs in the light of other variables. Similarly, it would be appropriate to extend the study to a greater number of years and to the possibility of predicting other variables.
Contributor Information
Ying Tan, Email: ytan@pku.edu.cn.
Yuhui Shi, Email: shiyh@sustc.edu.cn.
Milan Tuba, Email: tuba@np.ac.rs.
Jenny-Paola Lis-Gutiérrez, Email: jlis@cuc.edu.co, Email: jplisg@unal.edu.co, Email: jplisg@libertadores.edu.co.
Melissa Lis-Gutiérrez, Email: melissa.lis@unimeta.edu.co, Email: mlisg@unal.edu.co.
Adriana Patricia Gallego-Torres, Email: adpgallegot@udistrital.edu.co.
Vladimir Alfonso Ballesteros Ballesteros, Email: vladimir.ballesteros@libertadores.edu.co.
Manuel Francisco Romero Ospina, Email: mfromeroo@libertadores.edu.co.
References
- 1.Lis-Gutiérrez, J.P., Zerda-Sarmiento, A., Balaguera, M., Gaitán-Angulo, M., Lis-Gutiérrez, M.: Uso del sistema de propiedad industrial para signos distintivos en Colombia: un análisis departamental (2000–2016). En: Campos, G., Castaño, M., Gaitán-Angulo, M. & Sánchez, V. (Comps). Diálogos sobre investigación: avances científicos Konrad Lorenz, pp 193–215. Bogotá: Konrad Lorenz Editores (2019)
- 2.Lis-Gutiérrez, J.P., Lis-Gutiérrez, M., Gaitán-Angulo, M., Balaguera, M.I., Viloria, A., Santander-Abril, J.E.: Use of the industrial property system for new creations in colombia: a departmental analysis (2000–2016). In: Tan, Y., Shi, Y., Tang, Q. (eds.) DMBD 2018. LNCS, vol. 10943, pp. 786–796. Springer, Cham (2018). 10.1007/978-3-319-93803-5_74
- 3.WIPO. World intellectual property indicators. Ginebra: OMPI (2018)
- 4.WIPO. Datos y cifras de la OMPI sobre PI, edición de 2018. Ginebra: OMPI (2019)
- 5.Superintendencia de Industria y Comercio. Estadísticas PI [base de datos] (2019)
- 6.Dirección Nacional de Derechos de Autor (DNDA). Estadísticas en línea [Base de datos]. Bogotá: DNDA (2019)
- 7.Moros Ochoa, A., Lis-Gutiérrez, J.P., Castro Nieto, G.Y., Vargas, C.A., Rincón. J.C.: La percepción de calidad de servicio como determinante de la recomendación: una predicción mediante inteligencia artificial para los hoteles en Cartagena. En: G. Campos, M.A. Castaño, M. Gaitán-Angulo, V. Sánchez (comp). Diálogos sobre investigación. Bogotá: Editorial Konrad Lorenz (2020)
- 8.Lis-Gutiérrez, J.P., Aguilera-Hernández, D., Escobedo David, L.R.: Análisis de las demandas de los integrantes del Ejército colombiano en calidad de víctimas; una aplicación de machine learning. En: G. Barbosa Castillo, M. Correa, y A. Ciro Gómez (eds.), Análisis de las demandas de los integrantes del Ejército en calidad de víctimas: una aplicación de “machine learning”, pp. 437–468. Universidad Externado de Colombia, Bogotá (2020)
- 9.Alimov A. Intellectual property rights reform and the cost of corporate debt. J. Int. Money Finance. 2019;91:195–211. doi: 10.1016/j.jimonfin.2018.12.004. [DOI] [Google Scholar]
- 10.Sweet C, Eterovic D. Do patent rights matter? 40 years of innovation, complexity and productivity. World Dev. 2019;115:78–93. doi: 10.1016/j.worlddev.2018.10.009. [DOI] [Google Scholar]
- 11.Auriol E, Biancini S, Paillacar R. Universal intellectual property rights: too much of a good thing? Int. J. Ind. Organ. 2019;65:51–81. doi: 10.1016/j.ijindorg.2019.01.003. [DOI] [Google Scholar]
- 12.Campi M, Dueñas M. Intellectual property rights, trade agreements, and international trade. Res. Policy. 2019;48(3):531–545. doi: 10.1016/j.respol.2018.09.011. [DOI] [Google Scholar]
- 13.Papageorgiadis N, McDonald F. Defining and measuring the institutional context of national intellectual property systems in a post-trips world. J. Int. Manag. 2019;25(1):3–18. doi: 10.1016/j.intman.2018.05.002. [DOI] [Google Scholar]
- 14.Miric M, Boudreau KJ, Jeppesen LB. Protecting their digital assets: the use of formal & informal appropriability strategies by App developers. Res. Policy. 2019;48(8):103738. doi: 10.1016/j.respol.2019.01.012. [DOI] [Google Scholar]
- 15.Barroso A, Giarratana MS, Pasquini M. Product portfolio performance in new foreign markets: the EU trademark dual system. Res. Policy. 2019;48(1):11–21. doi: 10.1016/j.respol.2018.07.013. [DOI] [Google Scholar]
- 16.Denicolai S, Hagen B, Zucchella A, Dudinskaya EC. When less family is more: trademark acquisition, family ownership, and internationalization. Int. Bus. Rev. 2019;28(2):238–251. doi: 10.1016/j.ibusrev.2018.09.002. [DOI] [Google Scholar]
- 17.Teixeira AA, Ferreira C. Intellectual property rights and the competitiveness of academic spin-offs. J. Innov. Knowl. 2019;4(3):154–161. doi: 10.1016/j.jik.2018.12.002. [DOI] [Google Scholar]
- 18.Zhang D, Zheng W, Ning L. Does innovation facilitate firm survival? Evidence from chinese high-tech firms. Econ. Model. 2018;75:458–468. doi: 10.1016/j.econmod.2018.07.030. [DOI] [Google Scholar]
- 19.Kannan R, Vasanthi V. Soft Computing and Medical Bioinformatics. Singapore: Springer; 2019. Machine learning algorithms with roc curve for predicting and diagnosing the heart disease; pp. 63–72. [Google Scholar]
- 20.Wu, C.C., et al.: Prediction of fatty liver disease using machine learning algorithms. Comput. Methods Programs Biomed. 170, 23–29 (2019) [DOI] [PubMed]
- 21.Alic, A.S., et al.: BIGSEA: a big data analytics platform for public transportation information. Future Gen. Comput. Syst. 96, 243–269 (2019)
- 22.Banik D, Ekbal A, Bhattacharyya P. Machine learning based optimized pruning approach for decoding in statistical machine translation. IEEE Access. 2019;7:1736–1751. doi: 10.1109/ACCESS.2018.2883738. [DOI] [Google Scholar]
- 23.Aguilar, R., Torres, J., Martín, C.: Aprendizaje Automático en la Identificación de Sistemas. Un caso de estudio en la generación de un parque eólico. Revista iberoamericana de automática e informática industrial 16(1), 114–127 (2018)
- 24.Aristodemou L, Tietze F. The state-of-the-art on Intellectual Property Analytics (IPA): a literature review on artificial intelligence, machine learning and deep learning methods for analysing intellectual property (IP) data. World Patent Inf. 2018;55:37–51. doi: 10.1016/j.wpi.2018.07.002. [DOI] [Google Scholar]
- 25.Havermans QA, Gabaly S, Hidalgo A. Forecasting European trademark and design filings: An innovative approach including exogenous variables and IP offices’ events. World Patent Inf. 2017;48:96–108. doi: 10.1016/j.wpi.2017.01.004. [DOI] [Google Scholar]
- 26.Demsar, J., et al.: Orange: data mining toolbox in Python. J. Mach. Learn. Res. 14(Aug), 2349–2353 (2013)
- 27.Departamento Administrativo Nacional de Estadística (DANE). Proyecciones de Población Departamental [Base de datos]. Bogotá: Dane (2020)
- 28.Quitian OIT, Lis-Gutiérrez JP, Viloria A. Supervised and unsupervised learning applied to crowdfunding. Adv. Intell. Syst. Comput. 2020;1108:90–97. [Google Scholar]
- 29.Viloria A, Lis-Gutiérrez JP, Gaitán-Angulo M, Stanescu CLV, Crissien T. Machine learning applied to the H index of colombian authors with publications in scopus. Smart Innov. Syst. Technol. 2020;167:388–397. doi: 10.1007/978-981-15-1564-4_36. [DOI] [Google Scholar]