

Abstract
In people living with HIV (PLWH) on antiretroviral therapy (ART), HIV latency is the major barrier to a cure. HIV persists preferentially in CD4+ T cells expressing multiple immune checkpoint (IC) molecules, including programmed death (PD)-1, T cell immunoglobulin and mucin-domain containing-3 (TIM-3) and T cell immunoreceptor with Ig and ITIM domains (TIGIT). We aimed to determine whether these and other IC molecules have a functional role in maintaining HIV latency and if blocking IC molecules with antibodies reverses HIV latency. Using an in vitro model that establishes latency in both non-proliferating and proliferating human CD4+ T cells, we show that proliferating cells express multiple IC molecules at high levels. Latent infection was enriched in proliferating cells expressing PD-1. In contrast, non-proliferating cells expressed IC molecules at significantly lower levels but, latent infection was enriched in cells expressing PD-1, TIM-3, cytotoxic T lymphocyte-4 (CTLA-4), or B and T lymphocyte attenuator (BTLA). In the presence of an additional T cell activating stimulus, SEB, antibodies to CTLA-4 and PD-1 reversed HIV latency in proliferating and non-proliferating CD4+ T cells respectively. In the absence of SEB, only the combination of antibodies to PD-1, CTLA-4, TIM-3 and TIGIT reversed latency. The potency of latency reversal was significantly higher following combination IC blockade compared to other latency reversing agents, including vorinostat and bryostatin. Combination IC blockade should be further explored as a strategy to reverse HIV latency.
Introduction
Antiretroviral therapy (ART) has revolutionized the treatment of human immunodeficiency virus (HIV) infection and has dramatically reduced mortality and morbidity. However, ART is lifelong, expensive, and often has side effects so there is an urgent need to identify strategies to cure HIV or induce “remission” to avoid lifelong treatment [1]. The major barrier to a cure for HIV infection is the persistence of latent infection in long lived resting and proliferating CD4+ T cells [2–5] that are more frequently detected in lymphoid tissue and the gastrointestinal tract [6–8]. It is highly likely that the mechanisms maintaining HIV latency differ in non-proliferating and proliferating T cells, suggesting that multiple interventions may be needed to eliminate latency.
One approach being tested to eliminate latently infected cells in people living with HIV (PLWH) on ART is to activate latent virus and thereby induce death of the infected cell through immune clearance or virus induced cytolysis [9, 10]. To date, clinical trials that have examined latency reversing agents (LRA), such as histone deacetylase inhibitors (HDACi), disulfiram or Toll-like receptor (TLR) agonists have shown modest latency reversal but without clearance of infected cells [11–15]. Furthermore, HDACi have been shown to induce adverse effects on adaptive immune function in vitro and have multiple off target effects [11, 16–21]. Therefore, alternative LRAs that are more potent and have a beneficial effect on adaptive immune function, to enhance immune-mediated clearance of infected cells, are needed.
Latent infection is enriched in CD4+ T cells expressing immune checkpoint (IC) molecules, first described for programmed death-1 (PD-1) in circulating CD4+ T cells in blood [22, 23], and more recently in T follicular helper cells in lymphoid tissue [7]. In simian immunodeficiency virus (SIV)-infected macaques on ART, there is also enrichment of virus in CD4+ T cells expressing cytotoxic T lymphocyte-4 (CTLA-4) and PD-1 in the extra-follicular and follicular lymphoid compartments, respectively [24]. We previously demonstrated that co-expression of multiple IC molecules including PD-1, lymphocyte activation gene 3 (LAG-3) and T cell immunoreceptor with Ig and ITIM domains (TIGIT) on CD4+ T cells from blood from PLWH on ART were highly enriched for HIV infection compared to cells that expressed fewer than three IC markers [23].
HIV transcription and virus production is largely dependent on host transcription factors that increase and localise to the nucleus following T cell activation (reviewed in [1]). Ligation of IC molecules can actively suppress these pathways [25]. We recently demonstrated that engagement of PD-1 in vitro inhibits the establishment of HIV latency in resting CD4+ T cells [26] and in latently infected cells isolated from PLWH on ART, programmed death ligand 1 (PD-L1) can block viral production at the transcriptional level by abrogating T cell receptor (TCR)-induced HIV reactivation [27]. Conversely, PD-1 blockade with the monoclonal antibody pembrolizumab in combination with the LRA bryostatin, enhances HIV production ex vivo without increasing T cell activation [27]. Together these data suggest that IC molecules alone or in combination can define latently infected cells, and PD-1 has a functional role in the establishment, maintenance and reversal of HIV latency in CD4+ T cells (reviewed in [28]), in addition to the more global effects anti-PD-1 might have on antigen specific T cell function.
The administration of antibodies to PD-1, PD-L1 or CTLA-4, either alone or in combination, are now licensed in many countries for the treatment of malignancy [29], and multiple small cases series have demonstrated that the safety of anti-PD-1 and anti-PD-L1 in PLWH is similar to individuals without HIV infection [30–37]. Antibodies to other IC molecules such LAG-3 and TIGIT are also now in clinical development and early phase studies [38].
In a single case report of a person living with HIV on ART with metastatic melanoma, we demonstrated that the administration of anti-CTLA-4 (ipilimumab) led to a significant increase in cell associated unspliced HIV RNA, potentially consistent with latency reversal [39]. Additionally, in the same person, a single dose of anti-PD-1 (nivolumab) increased cell-associated HIV RNA in CD4+ T cells [26]. Other case reports of anti-PD-1 (pembrolizumab) have not shown a change in cell associated unspliced HIV RNA, although the timing of sampling blood differed in each of these studies [40]. Finally, repeated dosing of anti-PD-1 has been associated with a decline in cell associated HIV DNA, potentially consistent with clearance of infected cells [27, 41]. We therefore hypothesised that IC molecules provide an attractive target to eliminate latent infection and that administration of antibodies to multiple IC molecules in combination, could synergistically reverse inhibitory signals required to maintain latency, thereby leading to latency reversal.
Materials and Methods
Cells.
The HEK 293T and TZM-bl cell lines cells were grown as a monolayer in Dulbecco’s minimal essential medium (DMEM, Gibco) supplemented with 10% (v/v) heat-inactivated fetal calf serum (FCS) (Bovogene, Keilor East, Australia), 100 U/mL penicillin, 100 μg/mL streptomycin and 292 μg/mL glutamine (Gibco) at 37°C and 5% CO2.
PBMC were isolated by Ficoll-Paque density gradient centrifugation (GE Healthcare, Chalfont St. Giles, UK) from buffy coats obtained from the Australian Red Cross Blood Service (Melbourne, Australia). Resting CD4+ T cells were negatively selected using magnetic cell sorting with an in house cocktail of antibodies to CD8 (clone OKT8), CD11b (OKM1), CD16 (3G8), HLA-DR (2–06), CD19 (FMC63), CD14 (FMC17) and CD69 (L78), goat-anti-mouse IgG magnetic beads (Miltenyi Biotech) and the AutoMACS Pro® (Miltenyi Biotech), as previously described [42–44]. Purity (≥96%) was based on CD3+ and CD4+ expression with mouse-anti-human(m-a-h)CD3-PE (HIT3a) and m-a-hCD4-FITC (M5E2, BD Biosciences).
Monocytes were positively selected from PBMC using magnetic cell sorting using CD14 antibodies (FMC17), as previously described [45]. Purity (≥98%) was based on CD14+ expression with m-a-hCD14-FITC (M5E2, BD). Primary cells were cultured in RPMI 1640 medium (Life Technologies) supplemented with 10% (v/v) heat inactivated FCS, 100 U/mL penicillin, 100 μg/mL streptomycin and 292 μg/mL glutamine (RF10) at 37°C and 5% CO2.
Virus and infection.
Plasmid DNA encoding a NL4.3 backbone with an AD8 envelope and EGFP inserted 1 base downstream of the env open reading frame [46] followed by an IRES-nef coding sequence, kindly provided by Yasuko Tsunetsugu-Yokota (National Institute of Infectious Diseases, Tokyo, Japan), was transiently transfected into HEK 293T cells with calcium phosphate precipitation [47]. Virus supernatant was harvested after 2 days, filtered by passage through a 0.2 μm filter, concentrated using 20% sucrose density ultracentrifugation and stored in aliquots at −80°C. Cells were infected for 2–3 hrs at an MOI of 0.5 as determined by limiting dilution on TZM-bl using the Reed and Muench method [48], followed by a wash step to remove unbound virus.
In vitro mono-HIV-latency assay.
Resting CD4+ T cells were labelled with proliferation dye eFluor670 (eBiosciences) per the manufacturer’s instructions. Labelled T cells were cultured with or without syngeneic sorted monocytes (mo : T cell ratio of 1:10) with 20 ng/mL staphylococcal enterotoxin B (SEB, Sigma) and 10 U/mL recombinant human (r-h)IL-2 (Roche Diagnostics) for 24 hrs, infected with full length nef-competent EGFP-reporter virus for 2–3 hrs after which excess virus was washed away and cells were cultured for 5 days in media supplemented with SEB and 10 U/ml IL-2. Productive infection was determined day 5 post-infection by detecting EGFP+ cells using flow cytometry. Subsequently, the non-productively infected (EGFP−), CD3+, HLA-DR− (m-a-hCD3-PB, UCHT1, m-a-hHLA-DR-BV650, G46–6, from BD Biosciences) non-proliferating (eFluor670HI) and proliferating (eFluor670LO) CD4+ T cells were sorted using a FACSAria, MoFlo Astrios or FACSAria Fusion Cell sorters (BD Biosciences). In some experiments the CD3+HLA-DR−EGFP− non-proliferating and proliferating cells were further sorted based on IC expression using m-a-hCD279/PD-1-PE (EH12.1, BD), m-a-hTIM-3-PE (F38–2E2, BioLegend), m-a-hCD152/CTLA-4-PE (BNI3, BD), m-a-hCD272/BTLA-PE (MIH26, BioLegend), m-a-hTIGIT-eFluor710 (MBSA43, eBioscience). In other experiments, non-proliferating and proliferating T cells were sorted based on the expression of any of the following molecules: PD-1, TIM-3, CTLA-4 and BTLA. For these experiments, all 4 PE-conjugated antibodies were added to the cells in combination with m-a-hCD45RA-V500 (Hl100, BD), to exclude CD45RA+ from the non-proliferating cell population prior to IC gating.
To determine latent infection, 100,000 – 200,000 sorted T cells were cultured in a flat bottom 96 well plate with 200 μL RF10 supplemented with integrase inhibitor L870812 (Merck, White House Station, NJ, USA) or Raltegravir (AIDS Research and Reference Reagent Program, Division of AIDS, NIAID, NIH; or Selleck Chem), both used at a final concentration of 1 μM, in the presence (positive control) or absence (negative control) of activation stimuli composed of 3 μg/mL plate bound m-a-hCD3 (UCHT1, BD Biosciences), 2 μg/mL soluble m-a-hCD28 (L293, BD Biosciences), 50 ng/mL r-hIL-7 (Sigma) and 10 U/mL r-hIL-2. Cells were harvested 72 hrs after stimulation and EGFP expression was quantified using the FacsCalibur or FacsCanto II (BD BioSciences). Results were analysed using Weasel software (Walter and Elisa Hall Institute, Melbourne, Australia), and to quantify latent infection the number of EGFP+ cells in the unstimulated culture (background) was subtracted from the number of EGFP+ cells in the stimulated culture. In some experiments, antibodies blocking immune checkpoint molecules; humanised anti-PD-1 (nivolumab, kind gift from Bristol Myers Squibb, New York, NY), humanised anti-CTLA-4 (ipilimumab, kind gift from Bristol Myers Squibb), m-a-hTIM-3 (clone F38–2E2, BioLegend), m-a-hTIGIT (clone MBSA43, eBiosciences), or isotype controls; hIgG4 (clone ET904, BioLegend), hIgG1 (clone ET901, BioLegend), mIgG1 (clone MOPC-21, BioLegend), were added to activate latent infection. For these experiments 10 μg/mL of IC blocker or isotype control was added to sorted cells with back-added thawed syngeneic monocytes (T:mo ratio of 10:1) in the presence or absence of SEB and with the standard activation stimuli in a parallel culture (positive control) for 72 hrs. When multiple ICB were added, equal amounts of the appropriate isotype control antibody were added to the control culture.
To calculate the IC blocker-induced latency reversal expressed as a percentage of maximal stimulation with anti-CD3/CD28+IL-7+IL-2, the number of EGFP+ cells in the unstimulated culture was subtracted from the number of EGFP+ cells in the anti-CD3/CD28 stimulated culture and this was set at 100% (maximal stimulation). To calculate the effect of IC blocker-induced reversing latency, the number of EGFP+ cells in the unstimulated control was subtracted from the number of EGFP+ cells in the IC blocker treated culture and expressed as a percentage of maximal stimulation.
In other experiments LRAs romidepsin (FK288, depsipeptide, 1 or 0.1 nM, Selleck Chem), JQ1 (1 or 0.1 uM, Selleck Chem) bryostatin (10 or 1 nM, Sigma Aldrich) PMA+ionomycin (2 nM and 0.5 uM respectively, both from Sigma Aldrich), or DMSO (as reconstitution solvent control, Sigma Aldrich) were added to sorted cells with the standard activation stimuli in a parallel culture (positive control) for 72 hrs.
Flow cytometry.
In all experiments live and single cells were gated using forward and side scatter plots. IC ligand expression on mDC and monocytes was determined on CD3−HLA-DR+ cells using m-a-hCD3-PB (UCHT1, BD), m-a-hHLA-DR-PerCP (L243, BD), m-a-hCD274/PD-L1-PE (MIHI, BD), m-a-hCD273/PD-L2-PE (MIH18, BD), m-a-hCD80-PE (L307.4, BD), m-a-hCD86-PE (2331, BD), m-a-hCD275/ICOSLigand-PE (2D3/B7-H2, BD), m-a-hGal9-PE (9M1–3, BioLegend), m-a-hCD112/Nectin-2/PVRL-2-PE (TX31, BioLegend), m-a-hCD155/PVR-PE (TX24, BioLegend), m-a-hCD270/HVEM-PE (eBioHVEM-122, eBiosciences) or mIgG2a-PE isotype control (MOPC-173, BioLegend).
Single IC expression on T cells was determined by gating on CD3+HLA-DR−EGFP− cells, which were subsequently separated into eFluor670HI (non-proliferating) and eFluor670LO (proliferating) populations using m-a-hCD3-PB (UCHT1, BD), m-a-hHLA-DR-PE-TexR (TU36, BD), m-a-hCD279/PD-1-PE (EH12.1, BD), m-a-hTIM-3-PE (F38–2E2, BioLegend), m-a-hCD152/CTLA-4-PE (BNI3, BD), m-a-hCD272/BTLA-PE (MIH26, BioLegend), m-a-hTIGIT-eFluor710 (MBSA43, eBioscience), mIgG2a-PE isotype control (MOPC-173, BioLegend) or mIgG1-eFluor710 isotype control (P36281, eBiosciences).
Co-expression of PD-1, TIM-3 and TIGIT on CD3+HLA-DR−EGFP− non-proliferating and proliferating cells was done using m-a-hCD3-PB, m-a-hHLA-DR-PE-TexR or m-a-hHLA-DR-BV650 (G46–6, BD), m-a-hCD279/PD-1-PE, m-a-hTIM-3-PE-Cy7 (F38–2E2, BioLegend), m-a-hTIGIT-eFluor710, mIgG1-PE isotype control (MOPC-21, BD), mIgG1-PE-Cy7 isotype control (MOPC-21, BioLegend) and mIgG1-eFluor710 isotype control.
Co-expression of PD-1, CTLA-4, TIM-3 and TIGIT on CD3+HLA-DR−EGFP− non-proliferating and proliferating cells was done using m-a-hCD3-BV711 (UCHT1, BD), m-a-hHLA-DR-BV650, m-a-hCD279/PD-1-BV421 (EH12.1, BD), m-a-hCD152/CTLA-4-PE, m-a-hTIM-3-PE-Cy7 and m-a-hTIGIT-eFluor710.
Percentage positive cells was calculated by subtracting FMO or isotype control values.
Ethics approval.
The use of blood samples from HIV negative donors for this study was approved by the Human Research and Ethics Committees from the Alfred Hospital (HREC156/11), Monash University (CF11/1888) and the University of Melbourne (1443071). Donors were recruited by the Red Cross Blood Transfusion Service and all provided written informed consent for the use of their blood products for the research.
Statistical analysis.
Differences between experimental conditions were analysed using Wilcoxon matched pairs signed rank test (n > 5) or paired student T-test (n ≤ 5) on GraphPad Prism (Version 6). P-values ≤0.05 were considered significant.
Results
1] IC molecules and ligands are highly expressed on proliferating CD4+ T cells following co-culture with monocytes.
To study the role of IC molecules in HIV latency, we first assessed the expression of multiple IC molecules; PD-1, CTLA-4, TIGIT, T cell immunoglobulin and mucin-domain containing-3 (TIM-3) and B and T lymphocyte attenuator (BTLA), and their ligands in an in vitro model of latency [44, 45]. The model involves co-culture of resting CD4+ T cells with monocytes in the presence of staphylococcal enterotoxin B (SEB), which are known to express high levels of IC ligands, followed by HIV infection with an EGFP expressing virus [49] and separation of proliferating and non-proliferating T cells based on expression of the proliferation dye eFluor670 [50] (Figure 1A). IC molecule expression was determined on T cells before infection and day 1 to 4 post infection and co-culture. Monocytes were excluded from the analysis by gating for CD3+HLA-DR− cells and IC molecule expression was measured by flow cytometry on the non-productively infected (EGFP−), non-proliferating (eFLuorHI) and proliferating (eFLuorLO) T cells (Figure 1B–G) and the percentage of cells expressing IC markers was calculated over the 4 days (Figure 1H) and the 3 days post-infection data are summarised in figure 1I. In the non-proliferating T cell population, the mean percentage of T cells expressing PD-1, TIM-3, BTLA and TIGIT all significantly increased but there was no change in expression of CTLA-4 (Figure 1I). In the proliferating T cells, the increase in expression of all IC molecules was substantial with up to 30–40% of cells expressing at least one IC molecule (Figure 1I).
Figure 1. Expression of IC molecules on non-proliferating and proliferating CD4+ T cells co-cultured with monocytes.
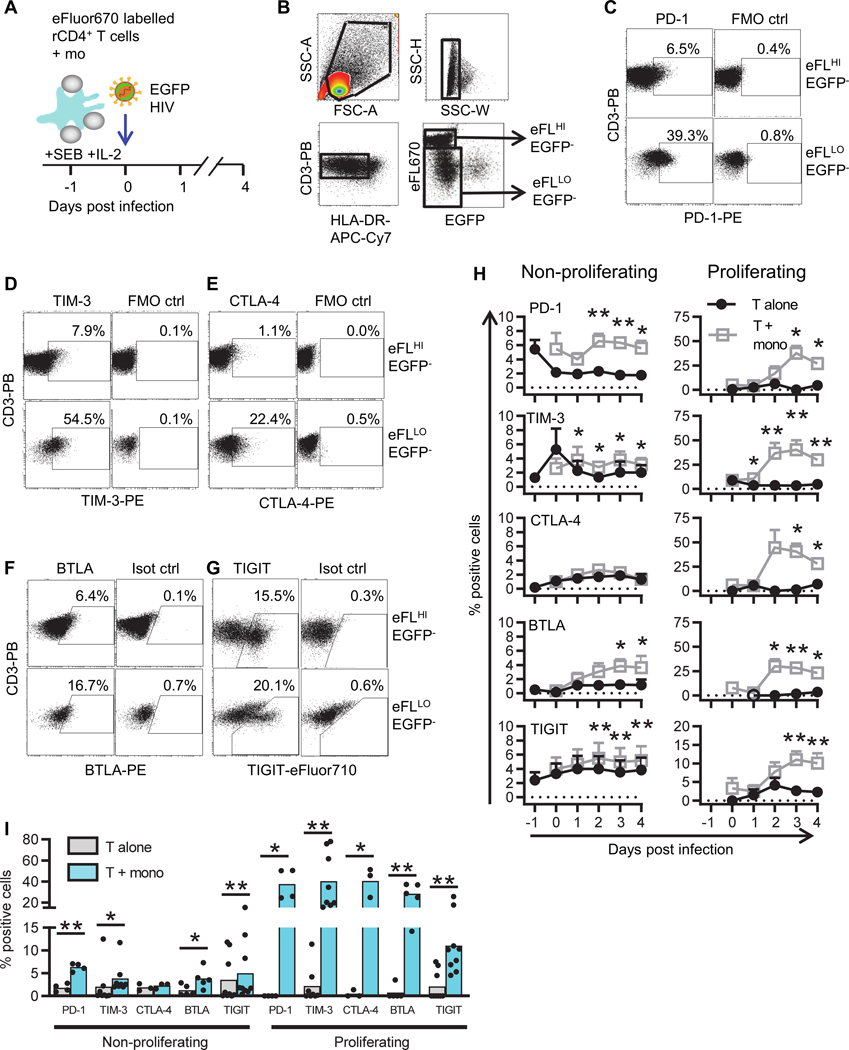
A: Schematic representation of the experimental set-up. Resting CD4+ T cells, isolated from PBMC of HIV-uninfected individuals, were co-cultured with syngeneic monocytes in the presence of SEB and infected with full length nef competent CCR5-tropic EGFP-reporter HIV. B: Cells were harvested for flow cytometry analysis and single cells were selected by assessment of forward scatter (FSC) and side scatter (SSC). T cells were identified by gating for CD3+HLA-DR− cells, and then gated for EGFP−, eFluor670HI (non-proliferating) and eFluor670LO (proliferating) T cells. Representative dot-plots showing gating strategy for C: PD-1, D: TIM-3, E: CTLA-4, F: BTLA and G: TIGIT. All dot-plots shown were from 3 days post-infection. H: Percentage of cells expressing PD-1 (n=4), TIM-3 (n=8), CTLA-4 (n=3), BTLA (n=5) and TIGIT (n=9) on EGFP− non-proliferating (left) and proliferating (right) T cells cultured alone (black circles) or with syngeneic monocytes (grey squares) was assessed by flow cytometry. Data points represent mean values ±SEM. Open circles indicate that fewer donors were used for the analysis of IC marker expression on proliferating T cells, as some donors did not have sufficient (>50,000 cells) proliferating T cells at that time point for analysis. I: The percentage of cells expressing PD-1, TIM-3, CTLA-4, BTLA and TIGIT 3 days post infection, on T cells cultured alone (grey bars) or co-cultured with syngeneic monocytes (blue bars). Data points represent mean ±SEM. Individual donor results are shown as black symbols. *p<0.05, **p<0.01, as determined by Student’s T test (n≤5) or Wilcoxon matched pairs signed rank test (n>5).
Next, we determined whether the cultured monocytes expressed ligands for IC molecules including Program Death (PD) Ligand (L) 1 (PD-L1) and PD-L2 (ligands for PD-1), Galectin 9 (Gal9, ligand for TIM-3), herpes virus entry mediator (HVEM, ligand for BTLA), CD80 and CD86 (ligands for CTLA-4), poliovirus receptor (PVR) and poliovirus receptor-like 2 (PVRL2, ligands for TIGIT). The same approach was used as described in Figure 1A, except this time we measured the expression of the IC ligands one day following infection and T cells were excluded from the analysis by gating for CD3−HLA-DR+ cells (Figure 2A). IC ligand expression was compared to fluorescent minus one (FMO) or isotype control (Figure 2B) and the percentage of cells expressing the IC ligands was calculated (Figure 2C). Monocytes expressed all IC ligands tested but there was a lower frequency of cells expressing PD-L1, PD-L2, CD80 and PVR compared to the other ligands (Figure 2C). There were no differences in IC ligand expression in the presence and absence of HIV (Figure 2C).
Figure 2. Expression of IC molecule ligands on monocytes.
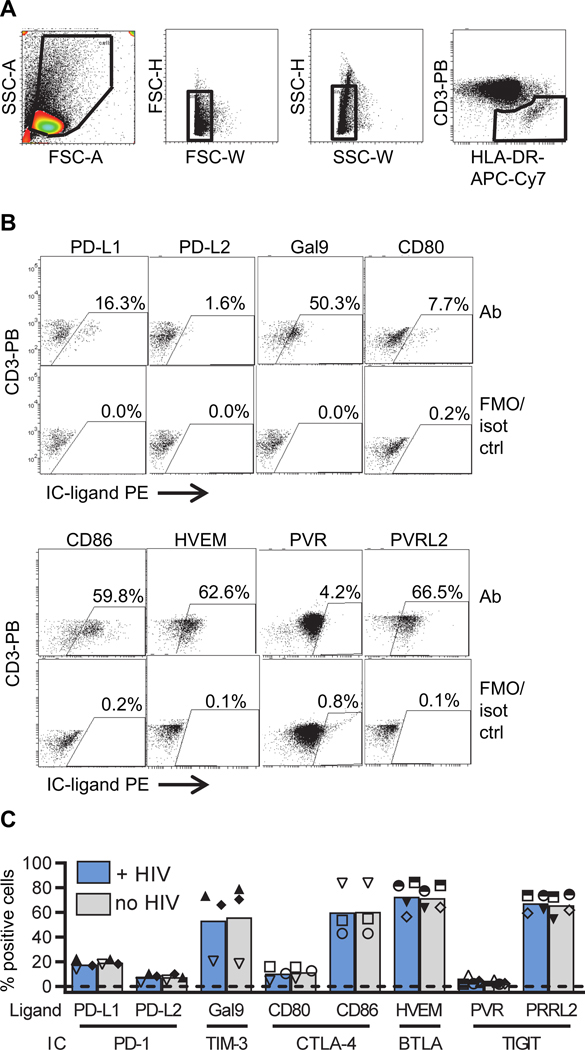
Expression of IC marker ligands on monocytes. Cells were cultured as described in Figure 1A, except IC ligands were measured one day following infection. A: Single cells were selected by side scatter (SSC) and forward scatter (FSC) and monocytes were defined by gating for CD3−HLA-DR+ cells. B: Representative dot-plots showing gating strategy for PD-L1, PD-L2, Gal9, HVEM, CD80, CD86, PVR and PVRL2. All dot-plots show samples at one day post infection and are compared to fluorescent minus one (FMO) control (ctrl) except the dot-plot for PVR which represents a baseline sample compared to isotype (iso) control. C: Percentage of monocytes expressing ligands for IC markers in the presence (blue) and absence (gray) of HIV, as determined by flow cytometry. Columns represent mean values (n=3–5) and each symbol represents individual donors. **p<0.01, as determined by Student’s T test.
2] HIV latency is enriched in T cells expressing multiple IC molecules in non-proliferating and proliferating CD4+ T cells.
CD4+ T cells from PLWH on ART that express PD-1 [22] or multiple IC molecules are enriched for HIV DNA [23]. We first confirmed whether these findings could be reproduced in our in vitro model of HIV latency. T cells were cultured with syngeneic monocytes in the presence of SEB and infected with the EGFP-reporter virus. On day 5 post-infection, EGFP− non-productively infected cells (i.e. potentially latently infected) in non-proliferating and proliferating T cell populations were sorted based on high and low eFluor670 expression, respectively. These two populations were then sorted on the basis of IC molecule expression (Figure S1) and inducible latent virus was quantified, as previously described [44, 45] (Figure 3A). Briefly, sorted cells were activated with anti-CD3/anti-CD28+IL-7+IL-2 in the presence of raltegravir (an HIV integrase inhibitor) to prevent subsequent rounds of infection. An increase in EGFP expression following stimulation was consistent with an increase in the frequency of latently infected cells [44]. Post integration latency was significantly enriched in non-proliferating T cells expressing high levels of PD-1, TIM-3, CTLA-4 or BTLA but not TIGIT, when compared to cells that did not express these IC molecules (p=0.01, 0.03, 0.01, 0.03 and 0.24 respectively) (Figure 3B and Table 1). In proliferating T cells, post integration latency was significantly enriched in PD-1HI compared to PD-1LO cells (p=0.04, Figure 3B). No enrichment for HIV-infected cells in IC expressing cells was detected when assessed for all other IC molecules (Figure 3B).
Figure 3. HIV latency is enriched in cells expressing high levels of IC molecules in non-proliferating and proliferating CD4+ T cells.

A: Resting CD4+ T cells were cultured with syngeneic monocytes in the presence of SEB and infected with EGFP-reporter virus. At day 5 post-infection CD3+HLA-DR− EGFP− (not productively infected), eFluor670HI (non-proliferating) and eFluor670LO (proliferating) T cells were further sorted based on IC molecule expression into low/negative (−) and high (+) expressing populations compared to FMO controls (see also Figure S1) or the expression of PD-1+CTLA-4+TIM-3+BTLA (multiple ICM) or none of these molecules. Sorted cells were cultured in the presence of the integrase inhibitor raltegravir (RAL) with and without anti-CD3/CD28+IL-7+IL-2. B: On day 8, EGFP+ cells were measured by flow cytometry and latent infection was calculated by subtracting the number of EGFP+ cells in the untreated culture from the number of EGFP+ cells in the stimulated culture. Red lines indicate median values and dots represent individual donors (n=4–6). *p<0.05, **p<0.01, as determined by Student’s T test (n≤5) or Wilcoxon matched pairs signed rank test (n>5). MFC denotes the median fold change between the samples with and without IC expression.
Table 1.
Enrichment of HIV in cells expressing immune checkpoint molecules.
| Mean fold enrichment of HIV with expression of IC | ||
|---|---|---|
| Non-proliferating | Proliferating | |
| PD-1 | 48.0 | 2.8 |
| TIM-3 | 4.6 | 1.4 |
| CTLA-4 | 4.9 | 0.7 |
| BTLA | 16.4 | 1.6 |
| TIGIT | 2.6 | 0.6 |
| PD-1 + TIM-3 + CTLA-4 + BTLA | 42.0 | 6.5 |
Mean fold change enrichment of HIV in cells that express immune checkpoint (IC) molecules, alone or in combination, compared to no expression of ICs. Cells were sorted following in vitro infection as described in figure 2. Similar experiments were performed for non-proliferating and proliferating T cells. A grey box indicates a significant increase of latent HIV in cells expressing high levels of IC molecules compared to cells expressing low to no IC molecules, defined as p<0.05 using a Student’s T test (n≤5) or Wilcoxon matched pairs signed rank test (n>5).
To determine whether co-expression of IC molecules resulted in a greater enrichment of HIV within our model, we performed the same experiments as described above but sorting cells that expressed any combination of PD-1, TIM-3, CTLA-4 and BTLA or none of these. Post integration latency was significantly enriched in both non-proliferating (mean fold change (MFC)=42; p=0.03) and proliferating (MFC= 48; p=0.03) T cells expressing one or more of the IC molecules, as compared to cells that expressed none of the IC molecules (Figure 3B and Table 1). However, for both non-proliferating and proliferating T cells, latency was still detected in the cells expressing low/none of the IC molecules. Finally, we observed no statistically significant correlations when comparing the frequency of IC expressing cells and the frequency of latent infection in either the non-proliferating or proliferating T cells (Figure S2). BTLA was excluded from these last experiments as there is currently no blocking antibody available and we aimed to investigate IC that have blocking antibodies available or in development for clinical use. Taken together these data demonstrate enrichment of latent HIV infection in proliferating and non-proliferating cells expressing multiple IC molecules alone or in combination.
3] Co-expression of multiple IC molecules is more frequent on proliferating CD4+ T cells.
Given that different cells can express one or more IC molecules, we next defined co-expression of IC molecules on T cells in this in vitro model for HIV latency. We first assessed the co-expression of PD-1, TIM-3 and TIGIT, as some of these IC molecules have been shown to be expressed on cells enriched for HIV using CD4+ T cells from PLWH on ART [23] and we had previously shown that PD-1 and TIM-3 were important in the establishment of latency [26]. Resting CD4+ T cells were co-cultured with monocytes and analysed for IC expression by flow cytometry. The percentage of cells positive for one IC (i.e. PD-1 or TIM-3 or TIGIT), two IC or three IC in combination was calculated (Figure 4A). Three days post infection, non-proliferating cells more frequently expressed a single IC than any combination of two IC (p<0.001, n=4, compared to single IC) or three IC (p<0.001, n=4, compared to single IC) (Figure 4B). Concomitant expression of two or three IC was far more common on proliferating than on non-proliferating cells. No statistically significant difference was observed in the frequency of cells expressing a single IC between non-proliferating and proliferating T cells. On day 3 post infection at the peak of IC expression, compared to non-proliferating T cells, proliferating T cells expressed two and three IC more frequently (p=0.0017 and 0.002, respectively for both) (Figure 4B). Overall, these results show that non-proliferating T cells more often express a single IC molecule while proliferating T cells more commonly co-express two or more IC molecules. These results were similar in the presence and absence of HIV infection (data not shown).
Figure 4. Co-expression of multiple IC molecules is more frequent on proliferating CD4+ T cells.
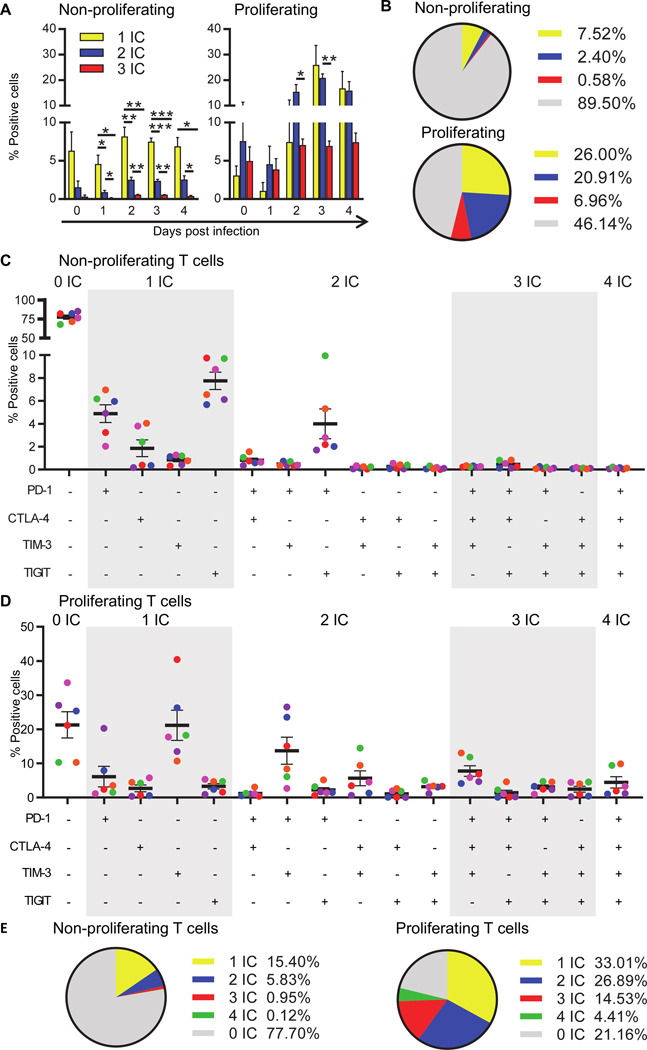
A: Co-expression of IC molecules PD-1, TIM-3 and TIGIT on T cells was determined in CD3+HLA-DR−EGFP− non-proliferating (left) and proliferating (right) T cells cultured with syngeneic monocytes by flow cytometry at the day of infection (d0), and on each day post infection (d1-d4), compared to isotype control. The cells are grouped to show the distribution of cells expressing none IC (grey), one IC (yellow), any combination of two IC (blue) or all three IC (red). Data points represent the mean of 4 donors ±SEM. B: Pie chart showing the distribution of IC molecule expression on non-proliferating (top) and proliferating (bottom) T cells on day 3 post infection. Co-expression of IC molecules PD-1, CTLA-4, TIM-3 and TIGIT on T cells was determined in CD3+HLA-DR−EGFP− non-proliferating (C) and proliferating (D) T cells cultured with syngeneic monocytes by flow cytometry at day 5 post infection, compared to isotype control. Black lines indicate mean values of 6 donors ±SEM and equal colours represent equal donors across the panels. E: Pie chart showing the distribution of IC expression on non-proliferating (left) and proliferating (right) T cells day 5 post infection. The cells are grouped to show the distribution of cells expressing none IC (grey), one IC (yellow), any combination of two IC (blue), any combination of three IC (red) or four IC (green).
Given the availability of anti-CTLA-4 in the clinic for management of melanoma [51], we also examined the co-expression of the same three IC together with CTLA-4. Proportions of cells expressing CTLA-4 was less frequent compared to the other IC molecules; i.e. PD-1 and TIGIT on non-proliferating and PD-1 and TIM-3 on proliferating T cells (Figure 4C). Again we found that there was more frequent expression of IC molecules in proliferating cells compared to non-proliferating cells, (expression of more than one IC was found in 46 and 7% and a single IC molecule in 33 and 15% of cells, respectively) (Figure 4C–E). Co-expression of all four IC molecules was the rarest population within either proliferating and non-proliferating cells (Figure 4E). Collectively, this data shows that the distribution of PD-1, CTLA-4, TIM-3 and TIGIT, expressed individually and in combination, differs between non-proliferating and proliferating T cells and that expression of more than one IC molecule was more frequent in proliferating T cells.
4] PD-1 blockade reverses latent HIV but only in the presence of SEB or other IC blockers.
To examine whether blocking IC, either alone or in combination, can reverse HIV latency in vitro, resting CD4+ T cells were co-cultured with monocytes in the presence of SEB and sorted into EGFP− non-proliferating and proliferating populations, as described above. IC blockers were added to the sorted cells in the presence of raltegravir and T20 (an integrase and fusion inhibitor respectively). As we exclude HLA-DR+ T cells during the sort on d5 post infection and select for CD3+ cells, the monocytes were excluded from the sorted population. Therefore, for the IC ligand to be present in the blocking experiment, syngeneic monocytes were added back to the cultures post sort (Figure 5A). Additionally, sorted cells were cultured, in the absence of monocytes, with anti-CD3/CD28+IL-7+IL-2, to induce maximal HIV production and to which all conditions were compared.
Figure 5. PD-1 blockade reverses latent HIV but only in the presence of SEB or other IC blockers.

A: Schematic representation of experimental set up to test if IC blockers can reverse HIV latency in vitro. Resting CD4+ T cells were cultured with syngeneic monocytes in the presence of SEB and infected with EGFP-reporter virus. At day 5 post infection, CD3+HLA-DR−EGFP− eFluor670HI (non-proliferating) and eFluor670LO (proliferating) T cells were sorted, cultured with integrase inhibitor (raltegravir), fusion inhibitor (T20) and left untreated or cultured with anti-CD3/CD28+IL-7+IL-2 (negative and positive control), or co-cultured with add-back syngeneic monocytes (mo) with the IC blocker, or combinations thereof, or isotype controls in the absence or presence of SEB. The cells were harvested 3 days post sort (day 8 post infection) and the number of EGFP+ cells was determined by flow cytometry (see also Figure S3A). Latency reversal following IC blockade is shown as a percentage of maximal anti-CD3/CD28+IL-7+IL-2 stimulation in non-proliferating (B) or proliferating (C) T cells. To calculate the percentage, the number of EGFP+ cells in unstimulated (mock) condition was subtracted from the number of EGFP+ cells following a maximal stimulus or stimulus from the IC blocker. Black lines indicate mean values of 6 donors ±SEM and equal colours represent equal donors across the panels. *p<0.05, as Wilcoxon matched pairs signed rank test determined using the number of EGFP+ cells (shown in Figure S3A–B) in the presence of the IC blocker compared to the corresponding isotype control.
The effect of anti-PD-1 (nivolumab) and anti-CTLA-4 (ipilimumab) were tested alone or in combination, as well as in combination with commercially available antibodies to TIM-3 and TIGIT. BTLA was not further examined as blocking agents are currently unavailable. Effects of IC blockers were assessed in the presence or absence of staphylococcal enterotoxin B (SEB). SEB is a super antigen that will drive proliferation in a subset of cells that express a specific Vb repertoire [52]. We assumed that SEB will drive proliferation of both uninfected and latently infected cells in this model. Latency reversal was quantified by measuring the increase in absolute number of cells that express EGFP following stimulation (Figure S3A) or as a proportion of maximal stimulation with anti-CD3/CD28+IL-7+IL-2 (Figure 5B). The mean(range) of EGFP+ cells in the untreated control was 10.8(8.4–17.1)/104 cells and this increased to 25.9(12.0–37.2)/104 cells following stimulation of the sorted non-proliferation T cells using a maximal stimulus (Figure S3A). For the sorted proliferating T cells, the number of EGFP+ cells increased from 22.3(3.5–47.5) /104 to 46.2(25.6–73.3) /104 using anti-CD3/CD28+IL-7+IL-2 (Figure S3B).
In non-proliferating CD4+ T cells, there was an increase in the number of EGFP+ cells following addition of anti-CD3/CD28+IL-7+IL-2 as expected (mean fold change, MFC 2.5; p=0.031; n=6) (Figure S3A), although there was quite considerable variation in inducible EGFP expression between donors. In the absence of SEB, a significant increase in EGFP+ cells was only observed when all four IC blockers were added (p=0.03; Figure 5B; Figure S3A). In the presence of SEB, the number of EGFP+ cells increased with anti-PD-1 alone (p=0.031) and in combination with anti-CTLA-4 (p=0.031) but not with anti-CTLA-4 alone (p=0.22) consistent with only anti-PD-1 inducing latency reversal. The addition of antibodies to TIM-3 (p=0.16) and TIGIT (p=0.22) had no further effect in enhancing EGFP expression (Figure 5B).
In the proliferating T cells, there was an increase in EGFP+ cells following the addition of anti-CD3/CD28+IL-7+IL-2 addition as expected (MFC 3.38; p=0.031; n=6) (Figure S3B). In the absence of SEB, the results were similar to the non-proliferating cells with an increase in EGFP only observed following the addition of all four IC blockers. In the presence of SEB, we observed that only anti-CTLA-4 induced a modest increase in the number of EGFP+ cells (p=0.031) (Figure S3B and Figure 5C). Interestingly, there was a decrease in the number of EGFP+ cells in the presence of anti-PD-1 (MFC 0.83; p=0.031) which was not related to a decrease in cell viability (data not shown).
To understand what factors might be associated with efficient latency reversal, we assessed whether there was a correlation between the induction of EGFP expression and the degree of T cell proliferation, as measured by an increase in the proportion of eFluor670LO cells for the non-proliferating cell cultures, or a decrease in eFluor670 mean fluorescent intensity (MFI) in the proliferating cells given the dye is diluted with each cell division. Following the addition of the IC blocker, no relationship was observed between cell proliferation and induction of EGFP expression (data not shown).
In summary, these data suggest that latency reversal could be achieved in both non-proliferating and proliferating latently infected cells when multiple IC blockers were used in combination without SEB. The degree of latency reversal was high; approaching 45% of what was achieved with maximal stimulation. In the presence of SEB, we found that latency reversal was possible using a single IC blocker in non-proliferating latently infected cells (using anti-PD-1) and in proliferating cells (using anti-CTLA-4) (Table 2). These data suggest that the use of a single IC blocker is unlikely to sufficiently activate latent infection in either proliferating or non-proliferating cells and an additional stimulus is required.
Table 2.
HIV latency reversal induced by immune checkpoint blockade or latency reversing agents in vitro.
| Immune checkpoint blockers | ||||
|---|---|---|---|---|
| Non-proliferating | Proliferating | |||
| No SEB | + SEB | No SEB | + SEB | |
| aPD-1 | 23.4 | 63.3 | 31.5 | 22.4 |
| Isot ctrl aPD-1 | 25.3 | 33.8 | 39.6 | 43.2 |
| aCTLA-4 | 38.6 | 66.3 | 39.3 | 53.2 |
| Isot ctrl aCTLA-4 | 27.0 | 52.3 | 47.8 | 37.1 |
| aPD-1+aCTLA-4 | 33.2 | 75.2 | 42.9 | 34.2 |
| Isot ctrl 2 ICB | 21.6 | 39.4 | 41.9 | 37.2 |
| aPD-1+aCTLA-4 +aTIM-3 | 40.5 | 65.3 | 49.6 | 40.7 |
| Isot ctrl 3 ICB | 22.9 | 30.2 | 31.7 | 36.8 |
| aPD-1+aCTLA-4 +aTIM-3+aTIGIT | 44.6 | 74.1 | 48.2 | 35.1 |
| Isot ctrl 4 ICB | 22.8 | 56.8 | 19.2 | 39.8 |
| Other LRAs | ||||
| Non-proliferating | Proliferating | |||
| DMSO | 7.0 | 2.7 | ||
| Romi 1 nM | 1.2 | 6.3 | ||
| Romi 0.1 nM | 5.1 | 7.2 | ||
| JQ1 1 μM | 2.7 | 2.0 | ||
| JQ1 0.1 μM | 5.2 | 7.8 | ||
| Bryo 10 nM | 50.9 | 42.6 | ||
| Bryo 1 nM | 64.8 | 47.4 | ||
| PMA+iono | 26.5 | 87.2 | ||
The percentage of maximal response induced following stimulation with anti-CD3 and anti-CD28 is shown. Increase in EGFP expression (latency reversal) is shown as the mean % of maximal activation with anti-CD3/28+IL-7+IL-2 following addition of IC blocking (ICB) antibodies or isotype control (isot ctrl), alone or in combination (top panels) or latency reversing agents (LRA; bottom panels). A grey box indicates a significant increase compared to isotype control (for immune checkpoint blockade or DMSO (for other LRAs), defined as p<0.05, using the frequency of EGFP+ cells shown in Figure S3. a = anti; Romi = romidepsin, bryo = bryostatin; PMA = phorbol 12-myristate 13-acetate; iono = ionomycin.
5] Substantially lower potency of latency reversal with commonly used LRAs compared to IC blockade.
To investigate the relative potency of IC blockade for latency reversal compared to other LRAs that have been shown to reverse latent HIV, we next assessed commonly used LRAs in the same in vitro model in separate experiments (Figure 6A). We tested three different classes of LRAs; the HDACi romidepsin, the bromodomain inhibitor JQ1, and an activator of protein kinase C (PKC) bryostatin. Of note, lower doses of romidepsin were used for these continuous 3-day reactivation cell cultures to avoid the toxic effects of high 40nM romidepsin observed in continuous T cell cultures elsewhere (data not shown). As positive controls, we included anti-CD3/CD28+IL-7+IL-2 and the combination of phorbol 12-myristrate 13-acetate (PMA) and ionomycin that mimic T cell activation, activating the transcription factors nuclear factor kappa-light-chain-enhancer of activated B cells (NF-κB) and nuclear factor of activated T cells (NFAT) to initiate HIV transcription [53]. Of the LRAs tested, only bryostatin led to a statistically significant increase in the frequency of EGFP+ cells in both non-proliferating and proliferating latently infected cells, reaching 65 and 43% of maximal stimulation induced by anti-CD3/CD28+IL-7+IL2 (Figure 6, Figure S3A and Table 2). In this model of latency, we demonstrate that IC blockade in combination, or using SEB with either anti-PD-1 or anti-CTLA-4 was more potent than commonly used LRAs such as romidepsin (tested at continuous low doses) or JQ1.
Figure 6. Potency of commonly used LRAs in this in vitro model.
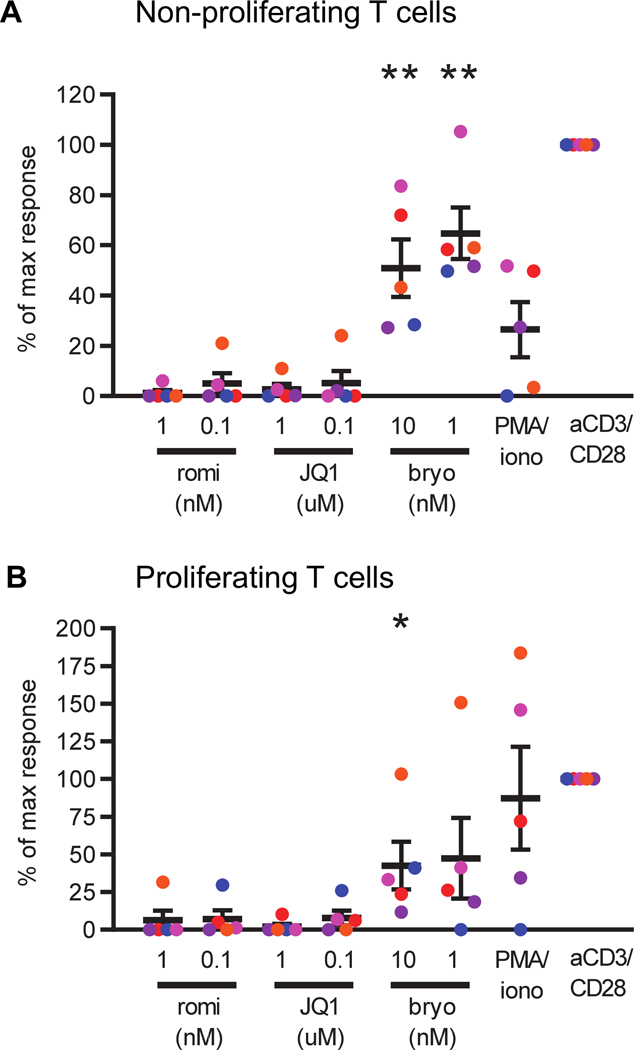
To determine the relative potency of latency reversal by commonly used LRAs in the same in vitro model as with IC blockade (Fig 5), cells were cultured as described in figure 5A with the exception that after day 5, monocytes were not added back to the sorted cells. Cells were then cultured with different LRAs, in the presence of an integrase inhibitor. The cells were harvested 3 days post addition of an LRA (day 8 post infection) and the number of EGFP+ cells was determined by flow cytometry (see also Figure S3C–D). EGFP expression following stimulation with an LRA is shown as a percentage of the maximal stimulation by anti-CD3/CD28+IL-7+IL-2 (set at 100%) in non-proliferating (A) and proliferating (B) CD4+ T cells. Black lines indicate mean values of 5 donors ±SEM and equal colours represent equal donors across the panels. **p<0.01 as determined by Student’s T test. Romi = romidepsin, bryo = bryostatin, iono = ionomycin.
Discussion
In PLWH on ART, HIV persists preferentially in CD4+ T cells expressing multiple immune checkpoint (IC) molecules in particular PD-1 [7, 22, 23]. To determine the role of multiple IC molecules and blockers in the maintenance and reversal of HIV latency, we used an in vitro model that can establish latency in both non-proliferating and proliferating T cells [44, 45, 50]. These two populations of latently infected cells can not be distinguished when evaluating CD4+ T cells ex vivo from PLWH on ART. We found HIV latency to be enriched in non-proliferating and proliferating T cells expressing IC molecules and the enrichment was greater in non-proliferating cells that expressed multiple IC molecules. Using multiple IC blockers that are licensed for the treatment of malignancy (anti-PD-1 and anti-CTLA-4) and in pre-clinical development (anti-TIM-3 and anti-TIGIT), we demonstrated that reversal of HIV latency was possible with a single IC antibody in combination with a T cell activation stimulus (here SEB), or with a combination of multiple antibodies to IC molecules without another stimulus. In this latency model, the potency of IC blockade in reversing latency was comparable to reversing HIV latency with the PKC activator bryostatin and greater than commonly used LRAs such as the HDACi romidepsin (used at low dose) or the bromodomain inhibitor JQ1. Given the additional potential beneficial effects of IC blockade in enhancing the function of HIV-specific CD4+ and CD8+ T cells [54, 55], IC blockade is an attractive option to move forward into clinical evaluation as both a potential LRA and as a strategy to boost HIV-specific T cell function.
Using an in vitro model of HIV latency, latent infection was found to be enriched in non-proliferating CD4+ T cells expressing PD-1, TIM-3, CTLA-4 or BTLA but in proliferating T cells, this enrichment was only found in T cells expressing PD-1. IC molecules were expressed at high levels but were often co-expressed on proliferating T cells, whereas non-proliferating T cells more commonly expressed a single IC molecule. The mechanisms behind the need for multiple IC blockers to reverse latent infection in non-proliferating and proliferating cells may be different. For the non-proliferating cells, multiple IC blockers may be required to target different cells that express a single IC molecule, while for the proliferating cells, multiple IC blockers are needed due to the high frequency of co-expression of different types of ICs on the same cell.
Blocking IC molecules inhibits the negative signalling in the T cell activation process, effectively releasing the breaks on T cell activation. TCR and super-antigen signalling induce multiple transcription factors to become active and/or translocate to the nucleus leading to induction of HIV transcription and virus production [56, 57], amongst many other changes in the host cell. These host transcription factors predominantly include NF-κB, NFAT, specificity protein 1 (SP-1) and activator protein 1 (AP-1) (reviewed in [58]). We recently showed that PD-1 signalling prevents activation of the positive transcription elongation factor b (P-TEFb), a master regulator of HIV transcription, through inhibition of TCR-induced CDK9 phosphorylation and cyclin T1 expression [27]. Whether these or other pathways are important for latency reversal following combination IC blockade remains to be determined.
In our in vitro model, we found that a single IC blocker could reverse latency but only in the presence of SEB (see Figure 5). Furthermore, anti-PD-1 was the only antibody that could reverse latency in non-proliferating T cells, whilst only anti-CTLA-4 reversed latency in proliferating T cells. The lack of activity of anti-CTLA-4 in non-proliferating cells may be a result of the low expression of CTLA-4 on these cells (see Figure 1H). This is expected because CTLA-4 is upregulated on cells following T cell receptor (TCR) priming [59] and these cells had not undergone proliferation in response to the super antigen SEB. In contrast, the proliferating T cells expressed high levels of CTLA-4 (see Figure 1H), as expected following stimulation with a super-antigen or TCR-mediated stimulation. Similarly, the failure of anti-PD-1 to reverse HIV latency in proliferating cells when used on its own, would be a major limitation as an LRA. Although administration of the combination of anti-PD-1 and anti-CTLA-4 is now recommended in the management of some malignancies, toxicity was significantly increased [29]. An increase in toxicity would significantly limit the use of combination IC blockade as an HIV cure intervention, given that PLWH now have a near normal life expectancy on long term ART.
Blocking immune checkpoint molecules can also induce T cell proliferation. It is therefore feasible that driving T cell proliferation could increase the number of latently infected cells in vivo, which would not be desirable. In our in vitro model, we observed enhanced T cell proliferation upon IC blockade when combined with super-antigen SEB, as expected, but no correlation was observed between the degree of proliferation and reversal of latency (data not shown). In our model, we did not directly measure the number of latently infected cells, but rather the number of cells with inducible virus. It is certainly possible that the cultures also contain cells infected with intact virus which don’t respond to stimulation. This has been well described in CD4+ T cells from PLWH on ART and referred to as non-induced intact proviruses [60]. Further work is needed to also measure the total number of infected cells prior to and following IC blockade to exclude the possibility of proliferation of infected cells that contain non-induced intact provirus.
There were several limitations to this study. First, we used an in vitro model to probe the effects of different IC molecules. These results need confirmation using CD4+ T cells from PLWH on ART ex vivo and/or in vivo administration of an ICB antibody. We are currently studying changes in cell associated HIV RNA and plasma HIV RNA in the context of clinical trials of anti-PD-1 and anti-CTLA-4 in PLWH with cancer (clinicaltrials.gov NCT02408861). Despite this limitation, our model has several advantages including; i) the ability to separate proliferating and non-proliferating latently infected cells, which is currently not possible with cells from PLWH; ii) the measurement of inducible virus rather than cell associated RNA, which allows quantification of the number of infected cells that undergo latency reversal; and iii) the incorporation of a super-antigen to drive proliferation. A second limitation of this study is that we did not assess every possible combination of two or three IC blockers. Instead, we focused on the clinically relevant combination of anti-PD-1 and anti-CTLA-4 and added other IC blockers (TIM-3, TIGIT) to this well-established clinically tested combination. A third limitation is that the use of SEB is not a physiological stimulus but can mimic an antigen specific response. Other co-stimuli should be further evaluated. A fourth limitation of our study is that we did not evaluate the role of LAG-3 because we were unable to detect an increase in LAG-3 expression upon co-culturing the CD4+ T cells with monocytes. Furthermore, we did not have access to a clinically relevant anti-LAG3 antibody to test in vitro. Finally, we only quantified inducible EGFP expression as a marker of latency reversal. Other proximal markers such as cell associated unspliced and multiply spliced RNA were not quantified, however, given there are blocks in transcriptional elongation and splicing described in resting CD4+ T cells [61] and that protein expression will be required for either immune mediated clearance or virus induced cytolysis, we felt that quantification of protein expression would be most informative.
In conclusion, using an in vitro model that can establish latency in both non-proliferating and proliferating T cells, we show that antibodies blocking signalling of specific IC molecules could reverse HIV latency in both proliferating and non-proliferating T cells, but this was only achieved in the presence of an additional T cell activating stimulus or when four antibodies were used in combination. Given that SEB is not a physiological stimulus and not feasible to deliver in vivo [62], further studies are needed to identify alternative secondary stimulus to replace SEB. One approach could be therapeutic vaccination for HIV [63] which could drive T cell proliferation but also enhance the generation of antigen-specific T cells, as recently demonstrated in the setting of cancer [64]. Alternatively, the PKC agonist bryostatin, or a related compound [65], might be a complimentary stimulus given that bryostatin appears to be safe in vivo [66], induces T cell activation and acts as an LRA alone [53] or in combination with anti-PD-1 [27]. The administration of a combination of IC blockers should be further explored as a path to HIV remission off ART.
Supplementary Material
Key points.
Blocking CTLA-4 or PD-1 combined with T cell activation reverses HIV latency
Without T cell activation, blocking multiple immune checkpoints reverses latency
Acknowledgements
We thank Damian Purcell (University of Melbourne, Parkville, Australia) and Yasuko Tsunetsugu-Yokota (National Institute of Infectious Diseases, Tokyo, Japan) for providing us with the EGFP-reporter virus. We thank G. Paukovics, J. Le Masurier and P. Donaldson (Alfred Medical Research and Educational Precinct (AMREP) Flow Cytometry Core Facility, Melbourne, Australia) and T. Luka, C. Li, A. Hind and D. Blashki (University of Melbourne Flow Cytometry Facility, Melbourne, Australia) for flow cytometric cell sorting. We thank Ashish Nair (University of Melbourne) for his help processing the human buffy coats. We thank Alan Korman from Bristol Myers Squibb for providing us with nivolumab (anti-PD-1) and ipilimumab (anti-CTLA-4).
This study was supported by funds from amfAR (grant 108237-51-RGRL; 109226-58-RGRL); the National Health and Medical Research Council (NHMRC) of Australia (APP1041795; APP3162044); and the National Institutes of Health Delaney AIDS Research Enterprise (DARE) to find a cure collaboratory (UM1AI126611-01). S.R.L. is an NHMRC Practitioner Fellow.
References
- 1.Deeks SG, Lewin SR, Ross AL, Ananworanich J, Benkirane M, Cannon P, Chomont N, Douek D, Lifson JD, Lo YR, Kuritzkes D, Margolis D, Mellors J, Persaud D, Tucker JD, Barre-Sinoussi F, A.S.T.a.C.W.G. International, Alter G, Auerbach J, Autran B, Barouch DH, Behrens G, Cavazzana M, Chen Z, Cohen EA, Corbelli GM, Eholie S, Eyal N, Fidler S, Garcia L, Grossman C, Henderson G, Henrich TJ, Jefferys R, Kiem HP, McCune J, Moodley K, Newman PA, Nijhuis M, Nsubuga MS, Ott M, Palmer S, Richman D, Saez-Cirion A, Sharp M, Siliciano J, Silvestri G, Singh J, Spire B, Taylor J, Tolstrup M, Valente S, van Lunzen J, Walensky R, Wilson I, and Zack J, International AIDS Society global scientific strategy: towards an HIV cure 2016. Nat Med, 2016. 22(8): p. 839–850. [DOI] [PMC free article] [PubMed] [Google Scholar]
- 2.Chun TW, Carruth L, Finzi D, Shen X, DiGiuseppe JA, Taylor H, Hermankova M, Chadwick K, Margolick J, Quinn TC, Kuo YH, Brookmeyer R, Zeiger MA, Barditch-Crovo P, and Siliciano RF, Quantification of latent tissue reservoirs and total body viral load in HIV-1 infection. Nature, 1997. 387(6629): p. 183–188. [DOI] [PubMed] [Google Scholar]
- 3.Hosmane NN, Kwon KJ, Bruner KM, Capoferri AA, Beg S, Rosenbloom DI, Keele BF, Ho YC, Siliciano JD, and Siliciano RF, Proliferation of latently infected CD4+ T cells carrying replication-competent HIV-1: Potential role in latent reservoir dynamics. J Exp Med, 2017. 214(4): p. 959–972. [DOI] [PMC free article] [PubMed] [Google Scholar]
- 4.Lorenzi JC, Cohen YZ, Cohn LB, Kreider EF, Barton JP, Learn GH, Oliveira T, Lavine CL, Horwitz JA, Settler A, Jankovic M, Seaman MS, Chakraborty AK, Hahn BH, Caskey M, and Nussenzweig MC, Paired quantitative and qualitative assessment of the replication-competent HIV-1 reservoir and comparison with integrated proviral DNA. Proc Natl Acad Sci U S A, 2016. 113(49): p. E7908–E7916. [DOI] [PMC free article] [PubMed] [Google Scholar]
- 5.Bui JK, Halvas EK, Fyne E, Sobolewski MD, Koontz D, Shao W, Luke B, Hong FF, Kearney MF, and Mellors JW, Ex vivo activation of CD4+ T-cells from donors on suppressive ART can lead to sustained production of infectious HIV-1 from a subset of infected cells. PLoS Pathog, 2017. 13(2): p. e1006230. [DOI] [PMC free article] [PubMed] [Google Scholar]
- 6.Chun TW, Nickle DC, Justement JS, Meyers JH, Roby G, Hallahan CW, Kottilil S, Moir S, Mican JM, Mullins JI, Ward DJ, Kovacs JA, Mannon PJ, and Fauci AS, Persistence of HIV in gut-associated lymphoid tissue despite long-term antiretroviral therapy. J Infect Dis, 2008. 197(5): p. 714–720. [DOI] [PubMed] [Google Scholar]
- 7.Banga R, Procopio FA, Noto A, Pollakis G, Cavassini M, Ohmiti K, Corpataux JM, de Leval L, Pantaleo G, and Perreau M, PD-1(+) and follicular helper T cells are responsible for persistent HIV-1 transcription in treated aviremic individuals. Nat Med, 2016. 22(7): p. 754–761. [DOI] [PubMed] [Google Scholar]
- 8.Estes JD, Kityo C, Ssali F, Swainson L, Makamdop KN, Del Prete GQ, Deeks SG, Luciw PA, Chipman JG, Beilman GJ, Hoskuldsson T, Khoruts A, Anderson J, Deleage C, Jasurda J, Schmidt TE, Hafertepe M, Callisto SP, Pearson H, Reimann T, Schuster J, Schoephoerster J, Southern P, Perkey K, Shang L, Wietgrefe SW, Fletcher CV, Lifson JD, Douek DC, McCune JM, Haase AT, and Schacker TW, Defining total-body AIDS-virus burden with implications for curative strategies. Nat Med, 2017. 23(11): p. 1271–1276. [DOI] [PMC free article] [PubMed] [Google Scholar]
- 9.Kim Y, Anderson JL, and Lewin SR, Eliminating HIV Latency: putting the “kill” into “shock and kill” Cell Host and Microbe, 2018. 23(1): p. 14–26. [DOI] [PMC free article] [PubMed] [Google Scholar]
- 10.Zerbato JM, Purves HV, Lewin SR, and Rasmussen TA, Between a shock and a hard place: challenges and developments in HIV latency reversal. Curr Opin Virol, 2019. 38: p. 1–9. [DOI] [PMC free article] [PubMed] [Google Scholar]
- 11.Elliott JH, Wightman F, Solomon A, Ghneim K, Ahlers J, Cameron MJ, Smith MZ, Spelman T, McMahon J, Velayudham P, Brown G, Roney J, Watson J, Prince MH, Hoy JF, Chomont N, Fromentin R, Procopio FA, Zeidan J, Palmer S, Odevall L, Johnstone RW, Martin BP, Sinclair E, Deeks SG, Hazuda DJ, Cameron PU, Sekaly RP, and Lewin SR, Activation of HIV transcription with short-course vorinostat in HIV-infected patients on suppressive antiretroviral therapy. PLoS Pathog, 2014. 10(10): p. e1004473. [DOI] [PMC free article] [PubMed] [Google Scholar]
- 12.Rasmussen TA, Tolstrup M, Brinkmann CR, Olesen R, Erikstrup C, Solomon A, Winckelmann A, Palmer S, Dinarello C, Buzon M, Lichterfeld M, Lewin SR, Ostergaard L, and Sogaard OS, Panobinostat, a histone deacetylase inhibitor, for latent-virus reactivation in HIV-infected patients on suppressive antiretroviral therapy: a phase 1/2, single group, clinical trial. Lancet HIV, 2014. 1(1): p. e13–21. [DOI] [PubMed] [Google Scholar]
- 13.Sogaard OS, Graversen ME, Leth S, Olesen R, Brinkmann CR, Nissen SK, Kjaer AS, Schleimann MH, Denton PW, Hey-Cunningham WJ, Koelsch KK, Pantaleo G, Krogsgaard K, Sommerfelt M, Fromentin R, Chomont N, Rasmussen TA, Ostergaard L, and Tolstrup M, The Depsipeptide Romidepsin Reverses HIV-1 Latency In Vivo. PLoS Pathog, 2015. 11(9): p. e1005142. [DOI] [PMC free article] [PubMed] [Google Scholar]
- 14.Vibholm L, Schleimann MH, Hojen JF, Benfield T, Offersen R, Rasmussen K, Olesen R, Dige A, Agnholt J, Grau J, Buzon M, Wittig B, Lichterfeld M, Petersen AM, Deng X, Abdel-Mohsen M, Pillai SK, Rutsaert S, Trypsteen W, De Spiegelaere W, Vandekerchove L, Ostergaard L, Rasmussen TA, Denton PW, Tolstrup M, and Sogaard OS, Short-Course Toll-Like Receptor 9 Agonist Treatment Impacts Innate Immunity and Plasma Viremia in Individuals With Human Immunodeficiency Virus Infection. Clin Infect Dis, 2017. 64(12): p. 1686–1695. [DOI] [PMC free article] [PubMed] [Google Scholar]
- 15.Archin NM, Liberty AL, Kashuba AD, Choudhary SK, Kuruc JD, Crooks AM, Parker DC, Anderson EM, Kearney MF, Strain MC, Richman DD, Hudgens MG, Bosch RJ, Coffin JM, Eron JJ, Hazuda DJ, and Margolis DM, Administration of vorinostat disrupts HIV-1 latency in patients on antiretroviral therapy. Nature, 2012. 487(7408): p. 482–485. [DOI] [PMC free article] [PubMed] [Google Scholar]
- 16.Jones RB, Mueller S, O’Connor R, Rimpel K, Sloan DD, Karel D, Wong HC, Jeng EK, Thomas AS, Whitney JB, Lim SY, Kovacs C, Benko E, Karandish S, Huang SH, Buzon MJ, Lichterfeld M, Irrinki A, Murry JP, Tsai A, Yu H, Geleziunas R, Trocha A, Ostrowski MA, Irvine DJ, and Walker BD, A Subset of Latency-Reversing Agents Expose HIV-Infected Resting CD4+ T-Cells to Recognition by Cytotoxic T-Lymphocytes. PLoS Pathog, 2016. 12(4): p. e1005545. [DOI] [PMC free article] [PubMed] [Google Scholar]
- 17.Beliakova-Bethell N, Mukim A, White CH, Deshmukh S, Abewe H, Richman DD, and Spina CA, Histone deacetylase inhibitors induce complex host responses that contribute to differential potencies of these compounds in HIV reactivation. J Biol Chem, 2019. 294(14): p. 5576–5589. [DOI] [PMC free article] [PubMed] [Google Scholar]
- 18.Brinkmann CR, Hojen JF, Rasmussen TA, Kjaer AS, Olesen R, Denton PW, Ostergaard L, Ouyang Z, Lichterfeld M, Yu X, Sogaard OS, Dinarello C, and Tolstrup M, Treatment of HIV-Infected Individuals with the Histone Deacetylase Inhibitor Panobinostat Results in Increased Numbers of Regulatory T Cells and Limits Ex Vivo Lipopolysaccharide-Induced Inflammatory Responses. mSphere, 2018. 3(1): p. e00616–17. [DOI] [PMC free article] [PubMed] [Google Scholar]
- 19.Clutton G, Xu Y, Baldoni PL, Mollan KR, Kirchherr J, Newhard W, Cox K, Kuruc JD, Kashuba A, Barnard R, Archin N, Gay CL, Hudgens MG, Margolis DM, and Goonetilleke N, The differential short- and long-term effects of HIV-1 latency-reversing agents on T cell function. Sci Rep, 2016. 6: p. 30749. [DOI] [PMC free article] [PubMed] [Google Scholar]
- 20.Garrido C, Tolstrup M, Sogaard OS, Rasmussen TA, Allard B, Soriano-Sarabia N, Archin NM, and Margolis DM, In-vivo administration of histone deacetylase inhibitors does not impair natural killer cell function in HIV+ individuals. AIDS, 2019. 33(4): p. 605–613. [DOI] [PMC free article] [PubMed] [Google Scholar]
- 21.Pace M, Williams J, Kurioka A, Gerry AB, Jakobsen B, Klenerman P, Nwokolo N, Fox J, Fidler S, Frater J, and Investigators C, Histone Deacetylase Inhibitors Enhance CD4 T Cell Susceptibility to NK Cell Killing but Reduce NK Cell Function. PLoS Pathog, 2016. 12(8): p. e1005782. [DOI] [PMC free article] [PubMed] [Google Scholar]
- 22.Chomont N, El-Far M, Ancuta P, Trautmann L, Procopio FA, Yassine-Diab B, Boucher G, Boulassel MR, Ghattas G, Brenchley JM, Schacker TW, Hill BJ, Douek DC, Routy JP, Haddad EK, and Sekaly RP, HIV reservoir size and persistence are driven by T cell survival and homeostatic proliferation. Nat Med, 2009. 15(8): p. 893–900. [DOI] [PMC free article] [PubMed] [Google Scholar]
- 23.Fromentin R, Bakeman W, Lawani MB, Khoury G, Hartogensis W, DaFonseca S, Killian M, Epling L, Hoh R, Sinclair E, Hecht FM, Bacchetti P, Deeks SG, Lewin SR, Sekaly RP, and Chomont N, CD4+ T Cells Expressing PD-1, TIGIT and LAG-3 Contribute to HIV Persistence during ART. PLoS Pathog, 2016. 12(7): p. e1005761. [DOI] [PMC free article] [PubMed] [Google Scholar]
- 24.McGary CS, Deleage C, Harper J, Micci L, Ribeiro SP, Paganini S, Kuri-Cervantes L, Benne C, Ryan ES, Balderas R, Jean S, Easley K, Marconi V, Silvestri G, Estes JD, Sekaly RP, and Paiardini M, CTLA-4(+)PD-1(−) Memory CD4(+) T Cells Critically Contribute to Viral Persistence in Antiretroviral Therapy-Suppressed, SIV-Infected Rhesus Macaques. Immunity, 2017. 47(4): p. 776–788 e5. [DOI] [PMC free article] [PubMed] [Google Scholar]
- 25.Wherry EJ and Kurachi M, Molecular and cellular insights into T cell exhaustion. Nat Rev Immunol, 2015. 15(8): p. 486–99. [DOI] [PMC free article] [PubMed] [Google Scholar]
- 26.Evans VA, van der Sluis RM, Solomon A, Dantanarayana A, McNeil C, Garsia R, Palmer S, Fromentin R, Chomont N, Sekaly RP, Cameron PU, and Lewin SR, Programmed cell death-1 contributes to the establishment and maintenance of HIV-1 latency. AIDS, 2018. 32(11): p. 1491–1497. [DOI] [PMC free article] [PubMed] [Google Scholar]
- 27.Fromentin R, DaFonseca S, Costiniuk CT, El-Far M, Procopio FA, Hecht FM, Hoh R, Deeks SG, Hazuda DJ, Lewin SR, Routy JP, Sekaly RP, and Chomont N, PD-1 blockade potentiates HIV latency reversal ex vivo in CD4(+) T cells from ART-suppressed individuals. Nat Commun, 2019. 10(1): p. 814–821. [DOI] [PMC free article] [PubMed] [Google Scholar]
- 28.Wykes MN and Lewin SR, Immune checkpoint blockade in infectious diseases. Nat Rev Immunol, 2017. 18: p. 91–104. [DOI] [PMC free article] [PubMed] [Google Scholar]
- 29.Wolchok JD, Chiarion-Sileni V, Gonzalez R, Rutkowski P, Grob JJ, Cowey CL, Lao CD, Wagstaff J, Schadendorf D, Ferrucci PF, Smylie M, Dummer R, Hill A, Hogg D, Haanen J, Carlino MS, Bechter O, Maio M, Marquez-Rodas I, Guidoboni M, McArthur G, Lebbe C, Ascierto PA, Long GV, Cebon J, Sosman J, Postow MA, Callahan MK, Walker D, Rollin L, Bhore R, Hodi FS, and Larkin J, Overall Survival with Combined Nivolumab and Ipilimumab in Advanced Melanoma. N Engl J Med, 2017. 377(14): p. 1345–1356. [DOI] [PMC free article] [PubMed] [Google Scholar]
- 30.Uldrick TS, Goncalves PH, Abdul-Hay M, Claeys AJ, Emu B, Ernstoff MS, Fling SP, Fong L, Kaiser JC, Lacroix AM, Lee SY, Lundgren LM, Lurain K, Parsons CH, Peeramsetti S, Ramaswami R, Sharon E, Sznol M, Wang CJ, Yarchoan R, Cheever MA, and Cancer T Immunotherapy Trials Network −12 Study, Assessment of the Safety of Pembrolizumab in Patients With HIV and Advanced Cancer-A Phase 1 Study. JAMA Oncol, 2019. 5(9): p. 1332–1339. [DOI] [PMC free article] [PubMed] [Google Scholar]
- 31.Husnain M, Park W, Ramos JC, Johnson TE, Chan J, Dasari A, Mudad R, and Hosein PJ, Complete response to ipilimumab and nivolumab therapy in a patient with extensive extrapulmonary high-grade small cell carcinoma of the pancreas and HIV infection. J Immunother Cancer, 2018. 6(1): p. 66–71. [DOI] [PMC free article] [PubMed] [Google Scholar]
- 32.Colston E, Grasela D, Gardiner D, Bucy RP, Vakkalagadda B, Korman AJ, and Lowy I, An open-label, multiple ascending dose study of the anti-CTLA-4 antibody ipilimumab in viremic HIV patients. PLoS One, 2018. 13(6): p. e0198158. [DOI] [PMC free article] [PubMed] [Google Scholar]
- 33.Cook MR and Kim C, Safety and Efficacy of Immune Checkpoint Inhibitor Therapy in Patients With HIV Infection and Advanced-Stage Cancer: A Systematic Review. JAMA Oncol, 2019. 5(7): p. 1049–1054. [DOI] [PubMed] [Google Scholar]
- 34.Chang E, Sabichi AL, Kramer JR, Hartman C, Royse KE, White DL, Patel NR, Richardson P, Yellapragada SV, Garcia JM, and Chiao EY, Nivolumab Treatment for Cancers in the HIV-infected Population. J Immunother, 2018. 41(8): p. 379–383. [DOI] [PMC free article] [PubMed] [Google Scholar]
- 35.Al Homsi MU, Mostafa M, and Fahim K, Favorable Response to Treatment with Avelumab in an HIV-Positive Patient with Advanced Merkel Cell Carcinoma Previously Refractory to Chemotherapy. Case Rep Oncol, 2018. 11(2): p. 467–475. [DOI] [PMC free article] [PubMed] [Google Scholar]
- 36.Bari S, Muzaffar J, Chan A, Jain SR, Haider AM, Adams Curry M, and Hostler CJ, Outcomes of Programmed Cell Death Protein 1 (PD-1) and Programmed Death-Ligand 1(PD-L1) Inhibitor Therapy in HIV Patients with Advanced Cancer. J Oncol, 2019. 2019: p. 2989048. [DOI] [PMC free article] [PubMed] [Google Scholar]
- 37.Spano JP, Veyri M, Gobert A, Guihot A, Perre P, Kerjouan M, Brosseau S, Cloarec N, Montaudie H, Helissey C, Flament T, Gounant V, Lavole A, Poizot-Martin I, and Katlama C, Immunotherapy for cancer in people living with HIV: safety with an efficacy signal from the series in real life experience. AIDS, 2019. 33(11): p. F13–F19. [DOI] [PubMed] [Google Scholar]
- 38.Webster RM, The immune checkpoint inhibitors: where are we now? Nat Rev Drug Discov, 2014. 13(12): p. 883–884. [DOI] [PubMed] [Google Scholar]
- 39.Wightman F, Solomon A, Kumar SS, Urriola N, Gallagher K, Hiener B, Palmer S, McNeil C, Garsia R, and Lewin SR, Effect of ipilimumab on the HIV reservoir in an HIV-infected individual with metastatic melanoma. AIDS, 2015. 29(4): p. 504–506. [DOI] [PMC free article] [PubMed] [Google Scholar]
- 40.Scully EP, Rutishauser RL, Simoneau CR, Delagreverie H, Euler Z, Thanh C, Li JZ, Hartig H, Bakkour S, Busch M, Alter G, Marty FM, Wang CC, Deeks SG, Lorch J, and Henrich TJ, Inconsistent HIV reservoir dynamics and immune responses following anti-PD-1 therapy in cancer patients with HIV infection. Ann Oncol, 2018. 29(10): p. 2141–2142. [DOI] [PMC free article] [PubMed] [Google Scholar]
- 41.Guihot A, Marcelin AG, Massiani MA, Samri A, Soulie C, Autran B, and Spano JP, Drastic decrease of the HIV reservoir in a patient treated with nivolumab for lung cancer. Ann Oncol, 2018. 29(2): p. 517–518. [DOI] [PubMed] [Google Scholar]
- 42.Cameron PU, Saleh S, Sallmann G, Solomon A, Wightman F, Evans VA, Boucher G, Haddad EK, Sekaly RP, Harman AN, Anderson JL, Jones KL, Mak J, Cunningham AL, Jaworowski A, and Lewin SR, Establishment of HIV-1 latency in resting CD4+ T cells depends on chemokine-induced changes in the actin cytoskeleton. Proc Natl Acad Sci U S A, 2010. 107(39): p. 16934–16939. [DOI] [PMC free article] [PubMed] [Google Scholar]
- 43.Saleh S, Wightman F, Ramanayake S, Alexander M, Kumar N, Khoury G, Pereira C, Purcell D, Cameron PU, and Lewin SR, Expression and reactivation of HIV in a chemokine induced model of HIV latency in primary resting CD4+ T cells. Retrovirology, 2011. 8: p. 80–91. [DOI] [PMC free article] [PubMed] [Google Scholar]
- 44.Evans VA, Kumar N, Filali A, Procopio FA, Yegorov O, Goulet JP, Saleh S, Haddad EK, da Fonseca Pereira C, Ellenberg PC, Sekaly RP, Cameron PU, and Lewin SR, Myeloid dendritic cells induce HIV-1 latency in non-proliferating CD4+ T cells. PLoS Pathog, 2013. 9(12): p. e1003799. [DOI] [PMC free article] [PubMed] [Google Scholar]
- 45.Kumar NA, Cheong K, Powell DR, da Fonseca Pereira C, Anderson J, Evans VA, Lewin SR, and Cameron PU, The role of antigen presenting cells in the induction of HIV-1 latency in resting CD4(+) T-cells. Retrovirology, 2015. 12: p. 76–92. [DOI] [PMC free article] [PubMed] [Google Scholar]
- 46.Yamamoto T, Tsunetsugu-Yokota Y, Mitsuki YY, Mizukoshi F, Tsuchiya T, Terahara K, Inagaki Y, Yamamoto N, Kobayashi K, and Inoue J, Selective transmission of R5 HIV-1 over X4 HIV-1 at the dendritic cell-T cell infectious synapse is determined by the T cell activation state. PLoS Pathog, 2009. 5(1): p. e1000279. [DOI] [PMC free article] [PubMed] [Google Scholar]
- 47.Das AT, Klaver B, and Berkhout B, A hairpin structure in the R region of the human immunodeficiency virus type 1 RNA genome is instrumental in polyadenylation site selection. J Virol, 1999. 73(1): p. 81–91. [DOI] [PMC free article] [PubMed] [Google Scholar]
- 48.Reed LJM, H., A simple method of estimating fifty per cent endpoints. The American Journal of Hygiene, 1938. 27(3): p. 493–497. [Google Scholar]
- 49.Pardoll DM, The blockade of immune checkpoints in cancer immunotherapy. Nat Rev Cancer, 2012. 12(4): p. 252–264. [DOI] [PMC free article] [PubMed] [Google Scholar]
- 50.Kumar NA, van der Sluis RM, Mota T, Pascoe R, Evans VA, Lewin SR, and Cameron PU, Myeloid Dendritic Cells Induce HIV Latency in Proliferating CD4(+) T Cells. J Immunol, 2018. 201(5): p. 1468–1477. [DOI] [PMC free article] [PubMed] [Google Scholar]
- 51.Kyi C and Postow MA, Immune checkpoint inhibitor combinations in solid tumors: opportunities and challenges. Immunotherapy, 2016. 8(7): p. 821–837. [DOI] [PMC free article] [PubMed] [Google Scholar]
- 52.Ferry T, Thomas D, Perpoint T, Lina G, Monneret G, Mohammedi I, Chidiac C, Peyramond D, Vandenesch F, and Etienne J, Analysis of superantigenic toxin Vbeta T-cell signatures produced during cases of staphylococcal toxic shock syndrome and septic shock. Clin Microbiol Infect, 2008. 14(6): p. 546–54. [DOI] [PubMed] [Google Scholar]
- 53.Spina CA, Anderson J, Archin NM, Bosque A, Chan J, Famiglietti M, Greene WC, Kashuba A, Lewin SR, Margolis DM, Mau M, Ruelas D, Saleh S, Shirakawa K, Siliciano RF, Singhania A, Soto PC, Terry VH, Verdin E, Woelk C, Wooden S, Xing S, and Planelles V, An in-depth comparison of latent HIV-1 reactivation in multiple cell model systems and resting CD4+ T cells from aviremic patients. PLoS Pathog, 2013. 9(12): p. e1003834. [DOI] [PMC free article] [PubMed] [Google Scholar]
- 54.Trautmann L, Janbazian L, Chomont N, Said EA, Gimmig S, Bessette B, Boulassel MR, Delwart E, Sepulveda H, Balderas RS, Routy JP, Haddad EK, and Sekaly RP, Upregulation of PD-1 expression on HIV-specific CD8+ T cells leads to reversible immune dysfunction. Nat Med, 2006. 12(10): p. 1198–1202. [DOI] [PubMed] [Google Scholar]
- 55.Kaufmann DE and Walker BD, PD-1 and CTLA-4 inhibitory cosignaling pathways in HIV infection and the potential for therapeutic intervention. J Immunol, 2009. 182(10): p. 5891–7. [DOI] [PMC free article] [PubMed] [Google Scholar]
- 56.Tong-Starkesen SE, Luciw PA, and Peterlin BM, Signaling through T lymphocyte surface proteins, TCR/CD3 and CD28, activates the HIV-1 long terminal repeat. J Immunol, 1989. 142(2): p. 702–707. [PubMed] [Google Scholar]
- 57.Stevenson M, Stanwick TL, Dempsey MP, and Lamonica CA, HIV-1 replication is controlled at the level of T cell activation and proviral integration. EMBO J, 1990. 9(5): p. 1551–1560. [DOI] [PMC free article] [PubMed] [Google Scholar]
- 58.Mbonye U and Karn J, The Molecular Basis for Human Immunodeficiency Virus Latency. Annu Rev Virol, 2017. 4(1): p. 261–285. [DOI] [PubMed] [Google Scholar]
- 59.Krummel MF and Allison JP, CD28 and CTLA-4 have opposing effects on the response of T cells to stimulation. J Exp Med, 1995. 182(2): p. 459–465. [DOI] [PMC free article] [PubMed] [Google Scholar]
- 60.Ho YC, Shan L, Hosmane NN, Wang J, Laskey SB, Rosenbloom DI, Lai J, Blankson JN, Siliciano JD, and Siliciano RF, Replication-competent noninduced proviruses in the latent reservoir increase barrier to HIV-1 cure. Cell, 2013. 155(3): p. 540–51. [DOI] [PMC free article] [PubMed] [Google Scholar]
- 61.Yukl SA, Kaiser P, Kim P, Telwatte S, Joshi SK, Vu M, Lampiris H, and Wong JK, HIV latency in isolated patient CD4(+) T cells may be due to blocks in HIV transcriptional elongation, completion, and splicing. Sci Transl Med, 2018. 10(430). [DOI] [PMC free article] [PubMed] [Google Scholar]
- 62.Fraser JD, Clarifying the mechanism of superantigen toxicity. PLoS Biol, 2011. 9(9): p. e1001145. [DOI] [PMC free article] [PubMed] [Google Scholar]
- 63.Mylvaganam GH, Silvestri G, and Amara RR, HIV therapeutic vaccines: moving towards a functional cure. Curr Opin Immunol, 2015. 35: p. 1–8. [DOI] [PMC free article] [PubMed] [Google Scholar]
- 64.McNeel DG, Eickhoff JC, Wargowski E, Zahm C, Staab MJ, Straus J, and Liu G, Concurrent, but not sequential, PD-1 blockade with a DNA vaccine elicits anti-tumor responses in patients with metastatic, castration-resistant prostate cancer. Oncotarget, 2018. 9(39): p. 25586–25596. [DOI] [PMC free article] [PubMed] [Google Scholar]
- 65.Marsden MD, Loy BA, Wu X, Ramirez CM, Schrier AJ, Murray D, Shimizu A, Ryckbosch SM, Near KE, Chun TW, Wender PA, and Zack JA, In vivo activation of latent HIV with a synthetic bryostatin analog effects both latent cell “kick” and “kill” in strategy for virus eradication. PLoS Pathog, 2017. 13(9): p. e1006575. [DOI] [PMC free article] [PubMed] [Google Scholar]
- 66.Gutierrez C, Serrano-Villar S, Madrid-Elena N, Perez-Elias MJ, Martin ME, Barbas C, Ruiperez J, Munoz E, Munoz-Fernandez MA, Castor T, and Moreno S, Bryostatin-1 for latent virus reactivation in HIV-infected patients on antiretroviral therapy. AIDS, 2016. 30(9): p. 1385–1392. [DOI] [PubMed] [Google Scholar]
Associated Data
This section collects any data citations, data availability statements, or supplementary materials included in this article.