

Abstract
Developmental Language Disorder (DLD) is a neurodevelopmental disorder characterized by difficulty learning and using language, and this difficulty cannot be attributed to other developmental conditions. The aim of the current study was to examine structural differences in dorsal and ventral language pathways between adolescents and young adults with and without DLD (age range: 14–27 years) using anatomical magnetic resonance imaging (MRI) and diffusion tensor imaging (DTI). Results showed age-related structural brain differences in both dorsal and ventral pathways in individuals with DLD. These findings provide evidence for neuroanatomical correlates of persistent language deficits in adolescents/young adults with DLD, and further suggest that this brain-language relationship in DLD is better characterized by taking account the dynamic course of the disorder along development.
Keywords: developmental language disorder, dorsal pathway, ventral pathway, structural brain imaging
1. Introduction
Developmental language disorder (DLD) is a neurodevelopmental disorder characterized by difficulty learning and using language, and this difficulty cannot be attributed to sensory, intellectual, social, or emotional problems (Leonard, 1998). Epidemiological studies have shown that DLD affects approximately 7% of children starting school (Norbury et al., 2016; Tomblin et al., 1997). Morphosyntactic deficits are the primary hallmark of DLD. Children with DLD have significant problems with production and/or comprehension of grammatical inflections and complex sentences, and these deficits persist well into adolescence and adulthood (Norbury, Tomblin, & Bishop, 2008). While most earlier work focused on development of morphology and syntax in DLD, recent studies have shown that individuals with DLD also have atypical lexical-semantic development, which frequently manifests as a small quantity of words learned as well as a poor quality of words learned (see Nation, 2014, for a review).
Despite its high prevalence rate, the neurobiology of DLD remains poorly understood (Krishnan, Watkins, & Bishop, 2016). Understanding the neural basis of DLD is important, both theoretically and clinically. On the one hand, DLD represents the lower end of the normal distribution with regard to language ability (Dollaghan, 2011; Leonard, 2014), and thus findings concerning the neurobiological basis of DLD will shed light on the mechanisms underlying individual differences in language development and learning. On the other hand, better understanding of the neural correlates of DLD will provide knowledge on the potential causes of language learning difficulties, which, in turn, will inform effective clinical interventions.
1.1. The Dual-stream Model of Language
Understanding the neurobiology of language has been an enduring problem in neuroscience. During the past decade, growing evidence supports a dual-stream model of language, wherein two anatomically and functionally distinct pathways work together to facilitate language learning and processing (e.g., Dick, Bernal, & Tremblay, 2014; Friederici, 2009; Friederici & Gierhan, 2013; Hickok & Poeppel, 2004; Saur et al., 2008). Despite some variations in details of each proposal, a general consensus has emerged that the dorsal pathway supports auditory-to-motor integration by mapping acoustic speech sounds to articulatory representations, while the ventral pathway supports lexical-semantic processing, mapping sound-based representations of speech to widely distributed conceptual representations. These two language pathways have different specialties in terms of anatomical projections and function, and a successful execution of language behavior requires complex collaboration and integration of processing between them (Cloutman, 2013; Rolheiser, Stamatakis, & Tyler, 2011).
1.1.1. The Dorsal Pathway.
The dorsal pathway connects the temporal cortex with the frontal cortex via the white matter tracts of the arcuate fasciculus (AF) and superior longitudinal fasciculus (SLF) (Catani, Johnes, & Ffytche, 2005; Glasser & Rilling, 2008). The prominent language-relevant regions in the dorsal pathway include the pars opercularis (BA44) of the inferior frontal gyrus (IFG), the transverse temporal gyrus (TTG)1, the superior temporal gyrus (STG), planum temporale, and the supramarginal gyrus (SMG). Brain imaging studies have suggested that most components of the AF/SLF tracts reach maturation during late adolescence, and the frontal portion of the AF/SLF continues to mature in early adulthood (Asato et al., 2010; Lebel et al., 2012; Simmonds et al., 2014).
A prominent function of the dorsal pathway is auditory-to-motor mapping (Hickok & Poeppel, 2004; Liégeois et al., 2019; Saur et al., 2008). This function is associated with the structural connection between the temporal cortex and the premotor cortex, which facilitates the translation of auditory representations of speech signals into articulatory/motor representations. Brain imaging studies showed that this part of the dorsal pathway was detectable in newborns (i.e., the fiber tract could be delineated in diffusion-weighted imaging (DWI) data by tractography), and was strongly activated as a function of speech input (Brauer et al., 2013; Leroy et al., 2011; Perani et al., 2011). These findings suggest that the dorsal pathway connecting the temporal cortex with the premotor cortex is sensitive to speech sounds early on, providing a possible neurobiological basis for the tuning process as the native phonology develops.
Recently, researchers proposed that the dorsal connection between the temporal cortex and the pars opercularis (BA44) of the IFG is relevant for more complex linguistic function, such as processing of syntactically complex sentences (Brauer et al., 2013; Friederici, 2009; Perani et al., 2011; Wilson et al., 2011). DWI data showed that unlike the dorsal connection between the temporal cortex and the premotor cortex, this part of the dorsal pathway was not detectable in infants, but was able to be delineated in the brains of 7-year-olds and above (Brauer et al., 2013). This finding is consistent with behavioral studies showing late acquisition of syntactically complex sentences in children.
1.1.2. The Ventral Pathway.
The ventral pathway consists of several fiber bundles, including 1) the inferior fronto-occipital fasciculus (IFOF) that connects the frontal cortex with the posterior temporal cortex, the occipital cortex, and the parietal cortex, 2) the inferior longitudinal fasciculus (ILF) that connects the temporal pole, hippocampal formation, and the inferior temporal gyrus to most of the occipital cortex, and 3) the uncinate fasciculus (UF) that connects the superior aspect of the temporal pole to the basal and lateral portions of the frontal cortex (Bajada et al., 2015; Dick et al., 2014; Duffau et al., 2013; Friederici, 2009; Saur et al., 2008). The prominent language-relevant regions in the ventral pathway include the inferior temporal gyrus (ITG), the middle temporal gyrus (MTG), the temporal pole, and the pars triangularis and the pars orbitalis of the IFG.
Researchers have successfully delineated the ventral pathway in newborns (Brauer et al., 2013; Perani et al., 2011). Lifespan DWI studies showed that the IFOF and the ILF tracts reached maturation in young adulthood, whereas the UF was one of the latest maturing tracts in the brain, with development continuing in the third decade of life (Asato et al., 2010; Lebel et al., 2012; Simmonds et al., 2014).
In terms of the function of the ventral pathway, it is generally agreed that the ventral pathway is associated with lexical-semantic processing, serving as a sound-to-meaning interface by mapping auditory representations to widely distributed semantic representations (Duffau et al., 2013; Hickok & Poeppel, 2004; Friederici & Gierhan, 2013; Saur et al., 2008; Wong et al., 2011). However, the unique contribution of each fiber tract to lexical-semantic processing remains poorly understood. Brauer et al. (2011) proposed that the initial prominence of the ventral pathway may also play a compensatory role in supporting syntactic processing in young children when the dorsal connection between the temporal cortex and the IFG is not sufficient due to its immaturity.
1.2. Brain Research on DLD
Despite growing evidence for the neurobiology of language development, there is a paucity of research on brain structure and/or function in DLD, not to mention age-related differences in the brain. Much of the earlier work centered on whether individuals with DLD have atypical structural asymmetry in language-relevant regions. The presumption of these studies is that if a lateralized brain facilitates language development and learning, then a disruption of the normal pattern of left-hemisphere language lateralization could be a cause of poor language development, as shown in individuals with DLD. The results in general showed reversal of asymmetry in multiple language-relevant brain regions in individuals with DLD, including the planum temporale and the IFG (Cohen, Campbell, & Yaghmai, 1989; de Fossé et al., 2004; Gauger, Lombardino, & Leonard, 1997; Herbert et al., 2005; Jernigan, Hdsselink, Sowell, & Tallal, 1991; Plante, Swisher, Vance, & Rapcsak, 1991). However, Bishop (2013) challenged this popular view of DLD as a result of a poorly lateralized brain. Using genetic data to support her arguments, Bishop suggested that atypical cerebral asymmetry may act as a separate risk factor for DLD, or alternatively, be a consequence of DLD.
In addition to earlier work on cerebral asymmetry, recent studies showed abnormal structure and function of language-relevant regions in DLD. For example, functional MRI studies showed reduced brain activations within the frontal, temporal, and parietal areas in individuals with DLD during language tasks (Badcock et al., 2012; de Guibert, et al., 2011; Hugdahl et al., 2004). In terms of structural brain imaging findings, individuals with DLD (age range: 8 to 30 years across different studies) revealed abnormal morphology and volumes of several language-relevant brain regions, including the IFG, the planum temporale, and the STG (Badcock et al., 2012; Clark & Plante, 1998; Gauger et al., 1997; Herbert et al., 2003; Jancke et al., 2007; Jernigan et al., 1991; Kurth et al., 2018; Leonard et al., 2002). However, findings pertaining to the direction of volumetric difference (i.e., smaller vs. larger volumes in the brain regions of interest in DLD) were inconsistent across studies, and this difference may be, at least partially, attributed to whether the whole brain measures (e.g., intracranial volumes) were controlled, or how they were controlled.
A dearth of research focuses on language-relevant white matter fiber tracts in the DLD population. Only five diffusion tensor imaging (DTI) studies have been conducted to examine the AF/SLF tracts in the dorsal pathway in children with and without DLD (Morgan et al., 2018; Roberts et al., 2014; Verhoeven et al., 2012; Verly et al., 2018; Vydrova et al., 2015), and two of them included the IFOF, ILF, UF in the ventral pathway as well (Verly et al., 2018; Vydrova et al., 2015). Most findings (but see Morgan et al., 2018) suggest deficient structural connectivity of both dorsal and ventral pathways in children with DLD. It remains unclear whether group differences occur in adolescence and early adulthood, and vary across age.
To sum up, there have been growing attempts to study the neurobiology of DLD in the past decades. However, results remain inconsistent due to varying methods, small sample size, heterogeneity of subjects with DLD, as well as sample limitation (e.g., postmortem case study (Cohen et al., 1989), or recruitment of male subjects only (de Fossé et al., 2004)). Moreover, DLD is a neurodevelopmental disorder, and thus neuroanatomical differences might look different across age if DLD is considered in a developmental context. At the phenotypic level, substantial evidence has shown a dynamic nature of DLD, suggesting a continuous interaction between the language environment and learning capabilities of a child (Evans, 2001; Poll, 2011; Thomas & Karmiloff-Smith, 2002). Soriano-Mas et al. (2009) showed global increases in gray and white matter volumes in the brains of children with DLD, as well as regional gray matter increases in the right perisylvian region and in the occipital petalia. Of particular interest was the fact that in older children (over 11 years of age) these brain differences were not significant between the DLD and non-DLD group. It should be noted that intracranial volumes (ICV) were not corrected for volumetric analysis in the study, and thus results might be reversed after adjusting for ICV. Nevertheless, Soriano-Mas et al.’ work confirms the dynamic nature of DLD, and highlights the necessity to take account of age in evaluating the neuroanatomical basis of DLD.
1.3. The Current Study
The aim of the current study was to examine structural differences in dorsal and ventral language pathways between adolescents and young adults with and without DLD. We aimed to address the limitations in previous studies by 1) increasing the sample size, 2) recruiting participants via school-wide screening of language ability in order to reduce sampling bias, and 3) expanding the age range of participants to examine whether group differences varied between the ages of 14 and 27 (i.e., adolescence and young adulthood). The regions of interest (ROIs) included: 1) the gray matter volumes of language-relevant brain regions in the dorsal and ventral pathways, and 2) the white matter microstructure of the fiber tracts in the two pathways. We hypothesized that individuals with DLD would show poorer development of both dorsal and ventral language pathways across the study age range than the comparison participants, given that they have persistent language learning difficulty in multiple domains of language (e.g., phonology, syntax, semantics) in adolescence and adulthood (Leonard, 1998).
2. Methods
2.1. Participants
Subjects were recruited from two sources targeting different age groups. None of the subjects reported having other neurodevelopmental disorders (e.g., intellectual disabilities, autism spectrum disorders) or hearing loss. Table 1 summarizes the demographic information and test scores of all subjects. While the prevalence rate for males with DLD was relatively higher than those for females with DLD (Tomblin et al., 1997), females in general are more willing to participate in research studies than males (Markanday, Brennan, Gould, & Pasco, 2013), which explains why we had more female subjects with DLD than male subjects with DLD in the current study.
Table 1.
Summary of demographics and test scores for participants with and without developmental language disorder (DLD) in each cohort.
| Comparison (n = 12) |
DLD (n = 14) |
||||
|---|---|---|---|---|---|
| M | SD | M | SD | p | |
| Cohort 1 | |||||
| Age (year) | 22.10 | .51 | 22.42 | 2.02 | .53 |
| Sex (Male:Female) | 4:8 | 5:9 | .90 | ||
| Handedness (Right:Left) | 12:0 | 13:1 | .35 | ||
| Language Composite Scores | 100.05 | 11.85 | 68.51 | 16.00 | <.001 |
| Nonverbal IQ | 112.50 | 10.03 | 89.36 | 13.40 | <.001 |
| Comparison (n = 61) |
DLD (n = 19) |
||||
| M | SD | M | SD | p | |
| Cohort 2 | |||||
| Age (year) | 16.62 | 1.40 | 16.96 | 1.49 | .36 |
| Sex (Male:Female) | 25:36 | 8:11 | .93 | ||
| Handedness (Right:Left) | 55:6 | 13:6 | .02 | ||
| Language Composite Scores | 102.09 | 9.54 | 78.47 | 5.15 | <001 |
| Nonverbal IQ | 100.46 | 14.56 | 84.16 | 9.58 | <001 |
2.1.1. Cohort 1.
The first cohort of subjects was drawn from the Iowa Longitudinal Study (Tomblin, 2008; DLD: n = 14, Comparison: n = 12). These participants were originally assessed in kindergarten and validated as having either typical language development or DLD using diagnostic standards and measurement tools (Tomblin, Records, & Zhang, 1996). At the point of testing, they were within the age range of 19 to 27 years old, having either typical language functioning or persistent language difficulty as shown in our longitudinal database. To reconfirm their diagnosis at the time of testing, all participants were tested on two nonverbal IQ measures and three language tasks. The two nonverbal IQ measures were the Block Design and Matrix Reasoning subtests from Wechsler Abbreviated Scale of Intelligence (WASI, Wechsler, 1999). The three language tasks included: 1) Word Derivations, a subtest from The Test of Adolescent and Adult Language, Fourth Edition (TOAL-4; Hammill, Brown, Larsen, & Wiederholt, 2007), 2) Peabody Picture Vocabulary Test, Fourth Edition (PPVT-4; Dunn & Dunn, 2007), and 3) a modified version of the Token Task (de Renzi & Faglioni, 1978; Morice & McNicol, 1985). Language composite scores were obtained by averaging the standard scores of three language measures. Subjects in the DLD group must have a persistent diagnosis of DLD shown in our longitudinal database, as well as having the current language composite scores below one standard deviation (SD) below the mean. Subcortical volumes (i.e., the basal ganglia and the hippocampus) of 12 subjects with DLD and 12 subjects with typical language ability in Cohort 1 have been reported elsewhere (Lee, Nopoulos, & Tomblin, 2013).
2.1.2. Cohort 2.
The second cohort of subjects was recruited from several high schools and colleges in Eastern Iowa (DLD: n = 19; Comparison: n = 61). The age range was between 14–20 years old. The recruitment method was different from the one used in the first cohort. Instead of recruiting subjects from our longitudinal study, we recruited the second cohort via school-wide screening of language ability in order to reduce sampling bias. Adolescents were then drawn from the screened pool to provide a sample that had a roughly rectangular distribution, with oversampling of adolescents in the high and low ends of the normal distribution with regard to language. By doing so, results would be able to shed light on the biological mechanisms underlying individual differences in language.
The diagnosis of DLD was based on five language tests and the nonverbal IQ subtests of the WASI (Wechsler, 1999). The five language tests used in the diagnosis included: 1) PPVT-4 (Dunn & Dunn, 2007) to assess receptive vocabulary, 2) Expressive Vocabulary Test, Second Edition (EVT-2; Williams, 1997) to assess expressive vocabulary, 3) Recalling Sentences in Clinical Evaluation of Language Fundamentals, Fourth Edition (CELF-4; Semel, Wiig, & Secord, 2003) to assess the ability to recall and reproduce sentences of syntactic complexity, 4) Understanding Spoken Paragraphs in CELF-4 to assess passage comprehension, and 5) Word Derivations in the TOAL-4 (Hammill et al., 2007) to assess knowledge of derivational morphology. Language composite scores were then obtained by averaging the standard scores of all language measures. Individuals with DLD must have their language composite scores below one SD below the mean.
2.1.3. Establishing Comparability of Language Measures Used in Two Cohorts.
Given the two-year gap between the two phases of subject recruitment, different recruitment methods, as well as different ages of subjects, the measurement of subject’s language ability requires use of different tasks. In these cases, it is assumed that different measures we chose are reflective of a common latent trait. Several studies have shown that oral language in childhood and adolescence consists largely of a unidimensional latent trait (Anthony, Davis, Williams, & Anthony, 2014; Bornstein, Hahn, Putnick, & Suwalsky, 2013; Language and Reading Research Consortium, 2015; Tomblin & Zhang, 2006). Therefore, we can expect that different manifest measures in this study are reflective of the same latent language ability trait. To test this prediction, we examined the correlation of the tests in common across the cohorts (i.e., PPVT and Word Derivations in TOAL-4) with the tests that were unique in each cohort. The results showed that the common measures were strongly correlated with the unique measures employed for Cohort 1, r = .60, p = .001, and for Cohort 2, r = .81, p < .001. The Fisher’s r-to-z transformation showed that these two correlations were not significantly different, z = −1.9, p = .06, suggesting that language measures used in different cohorts were indeed reflective of the same latent language ability trait. Thus, groups were comparable between the two cohorts with regard to language status (i.e., DLD or Comparison).
The study was approved by the institutional review board (IRB) at the University of Iowa. All participants provided consent in accord with the Declaration of Helsinki after being informed of the study procedures and purpose.
2.2. MRI Acquisition
All image scans were obtained at the University Hospital and Clinics of Iowa using the Siemens 3T Trio scanner. Subjects underwent an imaging protocol that collects high-resolution anatomical images and a diffusion tensor sequence.
2.2.1. Anatomical Image.
The high-resolution anatomical images consisted of a T1 weighted volume and also proton density (PD/T2) images collected with a dual echo fast spin-echo two-dimensional (2D) sequence. The T1 weighted images were acquired in the coronal plane using a 3D MP-RAGE sequence with the following parameters: echo time (TE) = 2.86 ms, repetition time (TR) = 2300 ms, inversion time = 900 ms, flip angle = 10°, number of excitations (NEX) = 1, field of view (FOV) = 256 × 256 × 256 mm, and slice thickness = 1 mm. The PD/T2 weighted images were acquired with the following parameters: TE = 430 ms, TR = 4800 ms, NEX = 1, slice thickness = 1.4 mm, FOV = 256 × 256 × 256 mm, and turbo factor = 137. The total time of image acquisition was approximately 21 minutes.
2.2.2. Diffusion-Weighted Image.
The diffusion-weighted images were collected using a 2D twice refocused echo-planar spin-echo sequence with the following parameters: TE = 81 ms, TR = 9000 ms, FOV = 256 × 256 mm, Matrix = 128 × 128, slice thickness = 2.0 mm, the number of diffusion directions = 64, and b-values = 1000 s/mm2. The total time of image acquisition was approximately ten minutes.
2.3. Image Preprocessing and Processing
2.3.1. Anatomical Image Processing.
The anatomical data were preprocessed using AutoWorkup, an automated procedure implemented in the software package Brain Research: Analysis of Images, Networks, and Systems (BRAINS; Magnotta et al., 2002). The steps of the standard pipeline included: 1) anterior commissure (AC)-posterior commissure (PC) alignment of T1 volume, 2) co-registration of T2-weighted images to AC-PC aligned T1, defining of Talairach parameters to warp the Talairach grid onto the raw space of each subject, 3) tissue classification of white matter, gray matter, and cerebrospinal fluid (Harris et al., 1999), and 4) skull stripping using an artificial neural network (Magnotta et al., 1999). After completion of AutoWorkup, all scans were individually inspected for quality control. The brains were then parcellated into functional regions using FreeSurfer (Dale, Fischl, & Sereno, 1999; Fischl, Sereno, & Dale, 1999; Fischl, Liu, & Dale, 2001). Cortical gray matter volumes reported in the current study were extracted for ROIs from each subject’s brain image in its native space. Figure 1 showed the ROIs, including STG, TTG, pars opercularis, and SMG in the dorsal pathway, and ITG, MTG, pars triangularis, pars orbitalis, and temporal pole in the ventral pathway.
Figure 1.

FreeSurfer map of the regions of interest in the left hemisphere. The transverse temporal gyrus (TTG) is buried within the lateral sulcus. ITG: Inferior temporal gyrus; MTG: Middle temporal gyrus; SMG: Supramarginal gyrus; STG: Superior temporal gyrus; TP: Temporal Pole; TTG: Transverse temporal gyrus.
2.3.2. Diffusion-weighted Image Processing.
The DTIPrep software (Liu et al., 2010) was used to perform several quality assurance steps as well as removing volumes within a scan that did not meet its minimal quality criteria before tensor image estimation. The automatic pipeline in the software includes: 1) protocol verification, 2) slice-wise checking, and 3) detection and removal of artifacts caused by eddy-currents, head motion, bed vibration and pulsation, venetian blind artifacts, as well as intensity inconsistencies (Oguz et al., 2014). The final dataset contained an averaged baseline image and diffusion-weighted images that passed all the quality assurance tests. Next, we used the Guided Tensor Restore Anatomical Connectivity Tractography (GTRACT; Cheng et al., 2006) software to process the output files from the DTIPrep, including estimation of tensor images and subsequent computation of fractional anisotropy. Johns Hopkins University (JHU) white matter tractography atlas was then used to label white matter fiber tracts of interest, including the SLF (connections between the frontal, parietal, occipital, and temporal lobes), IFOF (connections between the frontal lobe and the occipital lobe), UF (connections between the frontorbital cortex and the anterior temporal lobe), and ILF (connections between temporal lobe and the occipital lobe) (see Hua et al., 2008; Wakana et al., 2007, for details). In JHU atlas, SLF and AF are not delineated separately. Figure 2 shows the fiber tracts of interest.
Figure 2.

JHU white matter tractography atlas of the regions of interest. IFOF: Inferior fronto-occipital fasciculus; ILF: Inferior longitudinal fasciculus; SLF: Superior longitudinal fasciculus; UF: Uncinate fasciculus.
2.4. Statistical Analysis
Statistical analyses were carried out using SPSS version 25. Brain measures more than two SDs away from the mean were considered as outliers and thus removed from the dataset for the purpose of normalization. False discovery rate (FDR) was used to correct for multiple comparisons (Benjamini & Hochberg, 1995). In all analyses, sex, handedness, cohort, and nonverbal IQ were controlled as covariates. It should be noted that we did not aim to contrast the two cohorts; instead, we treated them as one sample that spans adolescence into adulthood. To be conservative, we created a dummy variable for cohort (i.e., Cohort 1 and 2), and entered it in the model as a covariate to control for the potential cohort effect.
We had one participant with DLD from the longitudinal database who was older (27 years) than the rest of the participants (14 to 24 years). To explore whether including this participant skewed the results, we ran all the analyses without him/her, and findings were not materially different. Thus, we did not remove the participant from our datasets. We also want to point out that generally speaking, it is less optimal to include subjects with left handedness. However, the relationship between handedness and DLD remains unclear. Bishop (2013) showed that while there seems no genetic links between handedness and speech/language difficulties, the high comorbidity may reflect delayed neuromotor maturation. Thus, excluding participants with DLD who are left handed may create a sampling bias. It is noted that the direction of results remained the same when excluding participants with left handedness.
2.4.1. Volumetric Analysis.
There was a significant difference in the intracranial volume (ICV) between the DLD group (M = 1284.71, SD = 152.12) and the comparison group (M = 1396.32, SD = 157.28) after controlling for age, sex, handedness, cohort, and nonverbal IQ, F(1, 99) = 11.04 p = .001, =.10. Thus, we transformed absolute volumes into relative volumes to avoid potential confounding effects. Relative volumes were obtained by dividing absolute volumes by ICV and then multiplying by 100. Analysis of variance (ANOVA) was performed to assess age-by-group interaction effects on relative gray matter volumes of each ROI.
2.4.2. Analysis of Diffusivity Measures.
Fractional anisotropy (FA) was chosen as the diffusion measure. FA is a measure of the degree of diffusion directionality, and is the most commonly reported index in diffusion imaging to reflect the microstructure of the brain anatomy (Alexander et al., 2007). Developmental research has shown that maturation of white matter over this age range can be reflected by an increase of FA (Huppi & Dubois, 2006; Qiu, Mori, & Miller, 2015). To examine age-related changes in white matter microstructures of the ROIs between individuals with and without DLD, the ANOVA was carried out to examine age-by-group interaction effects on FA values in the ROIs.
In addition to the ROIs, the corpus callosum fiber tracts (i.e., the genu, the body, and the splenium of the corpus callosum) were chosen as the control fiber tracts in order to ensure that any diffusivity differences observed were not significantly attributed to global microstructural alterations. The corpus callosum forms the largest commissural white matter bundle in the brain, playing a vital role in the integration of information between left and right cerebral hemispheres (Hofer & Frahm, 2006). Previous brain imaging studies did not show significant difference in the corpus callosum between individuals with and without DLD (Herbert et al., 2004; Preis, Steinmetz, Knorr, & Jancke, 2000).
3. Results
3.1. Volumetric Analysis
Table 2 summarizes the absolute and relative volumes of the ROIs in both groups2 (see Figure 3a and 3b for mean relative volumes of the ROIs in each group).
Table 2.
Summary of absolute and relative gray matter volumes of the regions of interest (ROI). Relative volumes were obtained by dividing absolute volumes by intracranial volumes (ICV) and then multiplying by 100.
| ROIs | Group | Absolute Volumes | Relative Volumes | |||
|---|---|---|---|---|---|---|
| Mean | SD | Mean | SD | |||
| Dorsal Pathway | ||||||
| Superior Temporal Gyrus (STG) | R | Comparison | 13242.79 | 1565.52 | 9.59 | .86 |
| DLD | 12098.70 | 1603.45 | 9.69 | .73 | ||
| L | Comparison | 13858.76 | 1621.03 | 10.00 | .90 | |
| DLD | 12346.42 | 1836.968 | 9.81 | .84 | ||
| Transverse Temporal Gyrus (TTG) | R | Comparison | 1010.76 | 158.74 | .72 | .09 |
| DLD | 970.36 | 177.53 | .75 | .09 | ||
| L | Comparison | 1305.24 | 211.24 | .94 | .14 | |
| DLD | 1236.63 | 171.92 | .96 | .10 | ||
| Supramarginal Gyrus (SMG) | R | Comparison | 12122.80 | 1741.97 | 8.66 | .97 |
| DLD | 11212.48 | 1535.05 | 8.47 | 1.00 | ||
| L | Comparison | 12975.97 | 1878.54 | 9.30 | 1.09 | |
| DLD | 11625.90 | 1939.72 | 9.08 | .83 | ||
| Pars Opercularis | R | Comparison | 4622.06 | 763.98 | 3.32 | .45 |
| DLD | 4461.16 | 607.86 | 3.56 | .48 | ||
| L | Comparison | 5673.87 | 794.09 | 4.18 | .55 | |
| DLD | 5244.91 | 894.83 | 4.09 | .45 | ||
| Ventral Pathway | ||||||
| Inferior Temporal Gyrus (ITG) | R | Comparison | 11827.17 | 1767.16 | 8.53 | .93 |
| DLD | 10772.63 | 1752.41 | 8.55 | 1.07 | ||
| L | Comparison | 12174.93 | 1785.98 | 8.76 | 1.01 | |
| DLD | 11012.10 | 1755.04 | 8.82 | 1.19 | ||
| Middle Temporal Gyrus (MTG) | R | Comparison | 14029.86 | 2011.80 | 10.06 | .88 |
| DLD | 13312.50 | 2100.44 | 10.35 | .81 | ||
| L | Comparison | 13015.71 | 1880.45 | 9.39 | .85 | |
| DLD | 11279.06 | 1977.04 | 8.97 | 1.06 | ||
| Pars Orbitalis | R | Comparison | 3097.74 | 416.85 | 2.22 | .31 |
| DLD | 2923.66 | 441.47 | 2.28 | .29 | ||
| L | Comparison | 2526.91 | 351.83 | 1.82 | .22 | |
| DLD | 2294.58 | 349.42 | 1.80 | .25 | ||
| Pars Triangularis | R | Comparison | 4856.68 | 847.58 | 3.53 | .64 |
| DLD | 4517.00 | 745.16 | 3.57 | .53 | ||
| L | Comparison | 4300.93 | 635.44 | 3.02 | .40 | |
| DLD | 3901.80 | 447.10 | 3.12 | .35 | ||
| Temporal Pole | R | Comparison | 2383.74 | 283.67 | 1.70 | .22 |
| DLD | 2320.25 | 337.10 | 1.80 | .29 | ||
| L | Comparison | 2606.58 | 307.33 | 1.87 | .26 | |
| DLD | 2522.34 | 374.40 | 2.01 | .22 | ||
DLD: Developmental language disorder; L: Left; R: Right; SD: Standard deviation.
Figure 3a.

Relative gray matter volumes of the regions of interest in the dorsal pathway. C: the comparison group; DLD: the Developmental Language Disorder group.
Figure 3b.
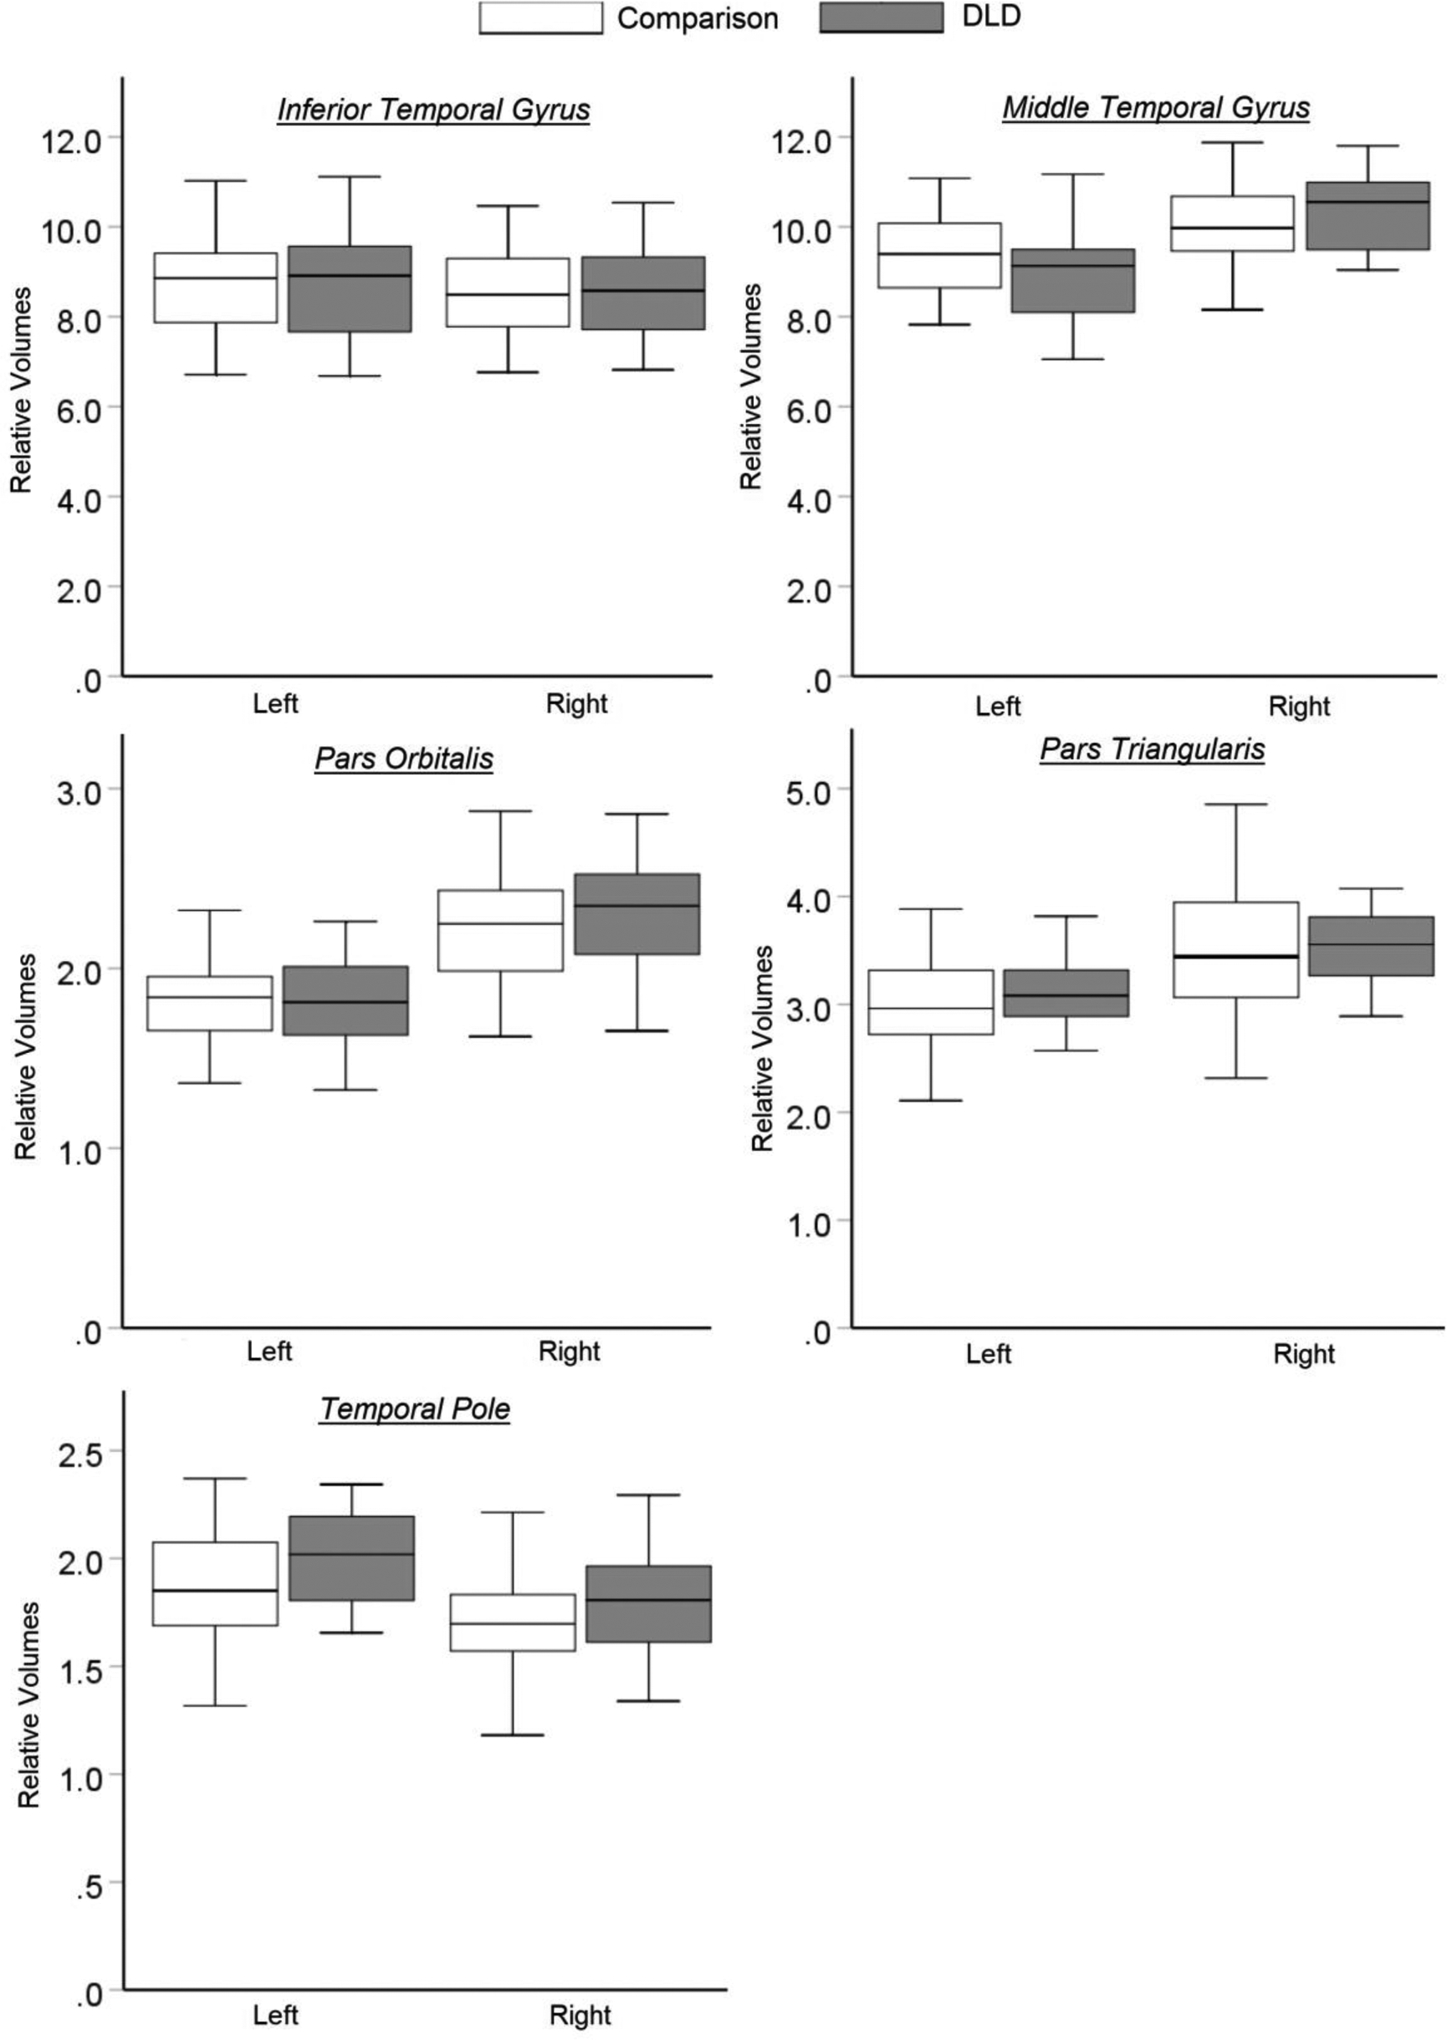
Relative gray matter volumes of the regions of interest in the ventral pathway. C: the comparison group; DLD: the Developmental Language Disorder group.
Table 3 provides the results for Group and Age effects and their interactions for the relative volumes in each ROI. In the upper panel, the ROIs comprising the dorsal pathway are shown. In terms of the Group main effect, the DLD group had significantly larger relative volumes of the left TTG in the dorsal pathway than the comparison group, F(1, 95) = 6.48, p = .01, = .07. None of the other ROIs in the dorsal pathway showed significant Age or Group effects.
Table 3.
Age-by-Group interaction effects on the relative gray matter volumes of the ROIs. Multivariate analyses were carried out, with sex, handedness, cohort, and nonverbal IQ as covariates.
| F | p | ||||
|---|---|---|---|---|---|
| Dorsal Pathway | |||||
| Superior Temporal Gyrus (STG) | R | Age | 2.22 | .14 | .02 |
| Group | .96 | .33 | .01 | ||
| Age × Group | .01 | .94 | < .01 | ||
| L | Age | .01 | .93 | < .01 | |
| Group | .01 | .93 | < .01 | ||
| Age × Group | .02 | .90 | < .01 | ||
| Transverse Temporal Gyrus (TTG) | R | Age | .07 | .79 | < .01 |
| Group | 1.63 | .21 | .02 | ||
| Age × Group | .37 | .54 | < .01 | ||
| L | Age | .56 | .46 | .01 | |
| Group | 6.48 | .01* | .07 | ||
| Age × Group | 3.67 | .06 | .04 | ||
| Supramarginal Gyrus (SMG) | R | Age | 2.11 | .15 | .02 |
| Group | < .01 | .98 | < .01 | ||
| Age × Group | .01 | .92 | < .01 | ||
| L | Age | .03 | .86 | < .01 | |
| Group | < .01 | .97 | < .01 | ||
| Age × Group | .01 | .92 | < .01 | ||
| Pars Opercularis | R | Age | 1.06 | .31 | .01 |
| Group | 1.72 | .19 | .02 | ||
| Age × Group | .40 | .53 | < .01 | ||
| L | Age | .06 | .82 | < .01 | |
| Group | .81 | .37 | .01 | ||
| Age × Group | 3.52 | .06 | .04 | ||
| Ventral Pathway | |||||
| Inferior Temporal Gyrus (ITG) | R | Age | .60 | .44 | .01 |
| Group | 4.88 | .03 | .05 | ||
| Age × Group | .01 | .95 | < .01 | ||
| L | Age | 1.97 | .16 | .02 | |
| Group | 3.02 | .09 | .03 | ||
| Age × Group | .96 | .33 | .01 | ||
| Middle Temporal Gyrus (MTG) | R | Age | 2.06 | .16 | .02 |
| Group | 4.39 | .04 | .05 | ||
| Age × Group | .20 | .66 | < .01 | ||
| L | Age | 6.23 | .01* | .06 | |
| Group | .11 | .75 | < .01 | ||
| Age × Group | .03 | .87 | < .01 | ||
| Pars Orbitalis | R | Age | .30 | .59 | < .01 |
| Group | 7.16 | .01* | .07 | ||
| Age × Group | 4.63 | .03 | .05 | ||
| L | Age | 1.46 | .23 | .02 | |
| Group | .57 | .45 | .01 | ||
| Age × Group | .60 | .44 | .01 | ||
| Pars Triangularis | R | Age | 4.01 | .05 | .04 |
| Group | .69 | .41 | .01 | ||
| Age × Group | 5.87 | .02 | .06 | ||
| L | Age | 6.64 | .01* | .07 | |
| Group | .59 | .44 | .01 | ||
| Age × Group | 1.37 | .24 | .02 | ||
| Temporal Pole | R | Age | .29 | .59 | < .01 |
| Group | 9.17 | < .01* | .09 | ||
| Age × Group | .31 | .58 | < .01 | ||
| L | Age | .04 | .84 | < .01 | |
| Group | 11.11 | < .01* | .11 | ||
| Age × Group | 1.13 | .29 | .01 | ||
An asterisk (*) indicates that the p-value remains significant after false discovery rate (FDR) adjustment. : partial eta-squared; L: Left; R: Right.
The ROIs comprising the ventral pathway showed significantly larger volumes for the DLD of the right pars orbitalis, F(1, 95) = 7.16, p < .01, = .07, of the right temporal pole, F(1, 95) = 9.17, p < .01, = .09, and the left temporal pole, F(1, 95) = 11.11, p < .01, = .11, in the DLD group. Additionally, significant increases in relative volumes were seen across age for the left MTG, F(1, 95) = 6.23, p = .01, and for the left pars triagularis, F(1,95)=6.64, p=.01.
3.2. FA Analysis
Participants whose diffusion images did not pass the rigorous quality control performed by DTIPrep (Liu et al., 2010) were excluded from further analyses (Comparison: n = 12, DLD: n = 2). Table 4 provides the summary statistics for the FA values for the tracts of interest in the two groups.
Table 4.
Summary of fractional anisotropy (FA) values in the fiber tracts of interest as well as in the control tracts.
| Fiber Tracts | Group | Mean | SD | |
|---|---|---|---|---|
| Dorsal Pathway | ||||
| Superior Longitudinal Fasciculus (SLF) | R | Comparison | .31 | .03 |
| DLD | .29 | .02 | ||
| L | Comparison | .30 | .02 | |
| DLD | .29 | .02 | ||
| Ventral Pathway | ||||
| Inferior Longitudinal Fasciculus (ILF) | R | Comparison | .36 | .02 |
| DLD | .35 | .03 | ||
| L | Comparison | .34 | .02 | |
| DLD | .33 | .02 | ||
| Inferior Fronto-occipital Fasciculus (IFOF) | R | Comparison | .37 | .02 |
| DLD | .35 | .02 | ||
| L | Comparison | .37 | .03 | |
| DLD | .36 | .02 | ||
| Uncinate Fasciculus (UF) | R | Comparison | .31 | .03 |
| DLD | .29 | .03 | ||
| L | Comparison | .31 | .04 | |
| DLD | .28 | .03 | ||
| Control Tracts | ||||
| Genu of the corpus callosum | Comparison | .47 | .04 | |
| DLD | .46 | .05 | ||
| Body of the corpus callosum | Comparison | .50 | .05 | |
| DLD | .47 | .05 | ||
| Splenium of the corpus callosum | Comparison | .50 | .04 | |
| DLD | .49 | .05 | ||
DLD: Developmental language disorder; L: Left; R: Right; SD: Standard deviation.
Results of tests for the effects of Group, Age and their interactions of the FA in the tracts comprising the dorsal pathway are shown in Table 5. Significantly reduced FA in the DLD group compared with the comparison group was found in the left SLF, F(1, 86) = 6.78, p = .01, = .07, and in the right SLF, F(1, 86) = 5.96, p = .02, = .07. In addition, there was a significant Age-by-Group interaction effect on the right SLF, F(1, 86) = 10.71, p < .001, = .11. Follow-up tests showed that the DLD group did not show significantly increased FA in the right SLF across age, r = −.25, p = .20, whereas the comparison group did, r = .39, p = .002 (see Figure 4). The pattern of increased FA across age in the comparison group is consistent with previous DTI studies showing an increase in FA with development in healthy children (Barnea-Goraly et al., 2005; Huppi & Dubois, 2006; Kochunov et al., 2012).
Table 5.
Fractional anisotropy (FA) in the association fiber tracts in the dorsal and ventral pathways as well as in the control fiber tracts. Multivariate analyses were carried out, with sex, handedness, cohort, and nonverbal IQ as covariates.
| F | p | ||||
|---|---|---|---|---|---|
| Dorsal Pathway | |||||
| Superior Longitudinal Fasciculus (SLF) | R | Age | .80 | .37 | .01 |
| Group | 5.96 | .02* | .07 | ||
| Age × Group | 10.71 | < .01* | .11 | ||
| L | Age | .37 | .55 | < .01 | |
| Group | 6.78 | .01* | .07 | ||
| Age × Group | 3.28 | .07 | .04 | ||
| Ventral Pathway | |||||
| Inferior Longitudinal Fasciculus (ILF) | R | Age | 3.89 | .05 | .04 |
| Group | 5.81 | .02* | .06 | ||
| Age × Group | 1.67 | .20 | .02 | ||
| L | Age | 2.54 | .11 | .03 | |
| Group | 2.10 | .15 | .02 | ||
| Age × Group | 5.41 | .02* | .06 | ||
| Inferior Fronto-occipital Fasciculus (IFOF) | R | Age | 1.65 | .20 | .02 |
| Group | 9.71 | < .01* | .10 | ||
| Age × Group | 2.23 | .14 | .03 | ||
| L | Age | .69 | .41 | .01 | |
| Group | 5.70 | .02* | .06 | ||
| Age × Group | 4.57 | .04 | .05 | ||
| Uncinate Fasciculus (UF) | R | Age | 1.28 | .26 | .02 |
| Group | 2.73 | .10 | .03 | ||
| Age × Group | 8.52 | < .01* | .09 | ||
| L | Age | .42 | .52 | .01 | |
| Group | 9.05 | < .01* | .10 | ||
| Age × Group | 4.31 | .04 | .05 | ||
| Control Tracts | |||||
| Genu of the corpus callosum | Age | .34 | .56 | < .01 | |
| Group | .03 | .86 | < .01 | ||
| Age × Group | 1.06 | .31 | .01 | ||
| Body of the corpus callosum | Age | .29 | .59 | < .01 | |
| Group | 2.71 | .10 | .03 | ||
| Age × Group | 1.06 | .31 | .01 | ||
| Splenium of the corpus callosum | Age | < .01 | 1.00 | < .01 | |
| Group | .08 | .77 | < .01 | ||
| Age × Group | .22 | .64 | < .01 | ||
An asterisk indicates that the p-value remains significant after false discovery rate (FDR) adjustment. : partial eta-squared; L: Left; R: Right.
Figure 4.
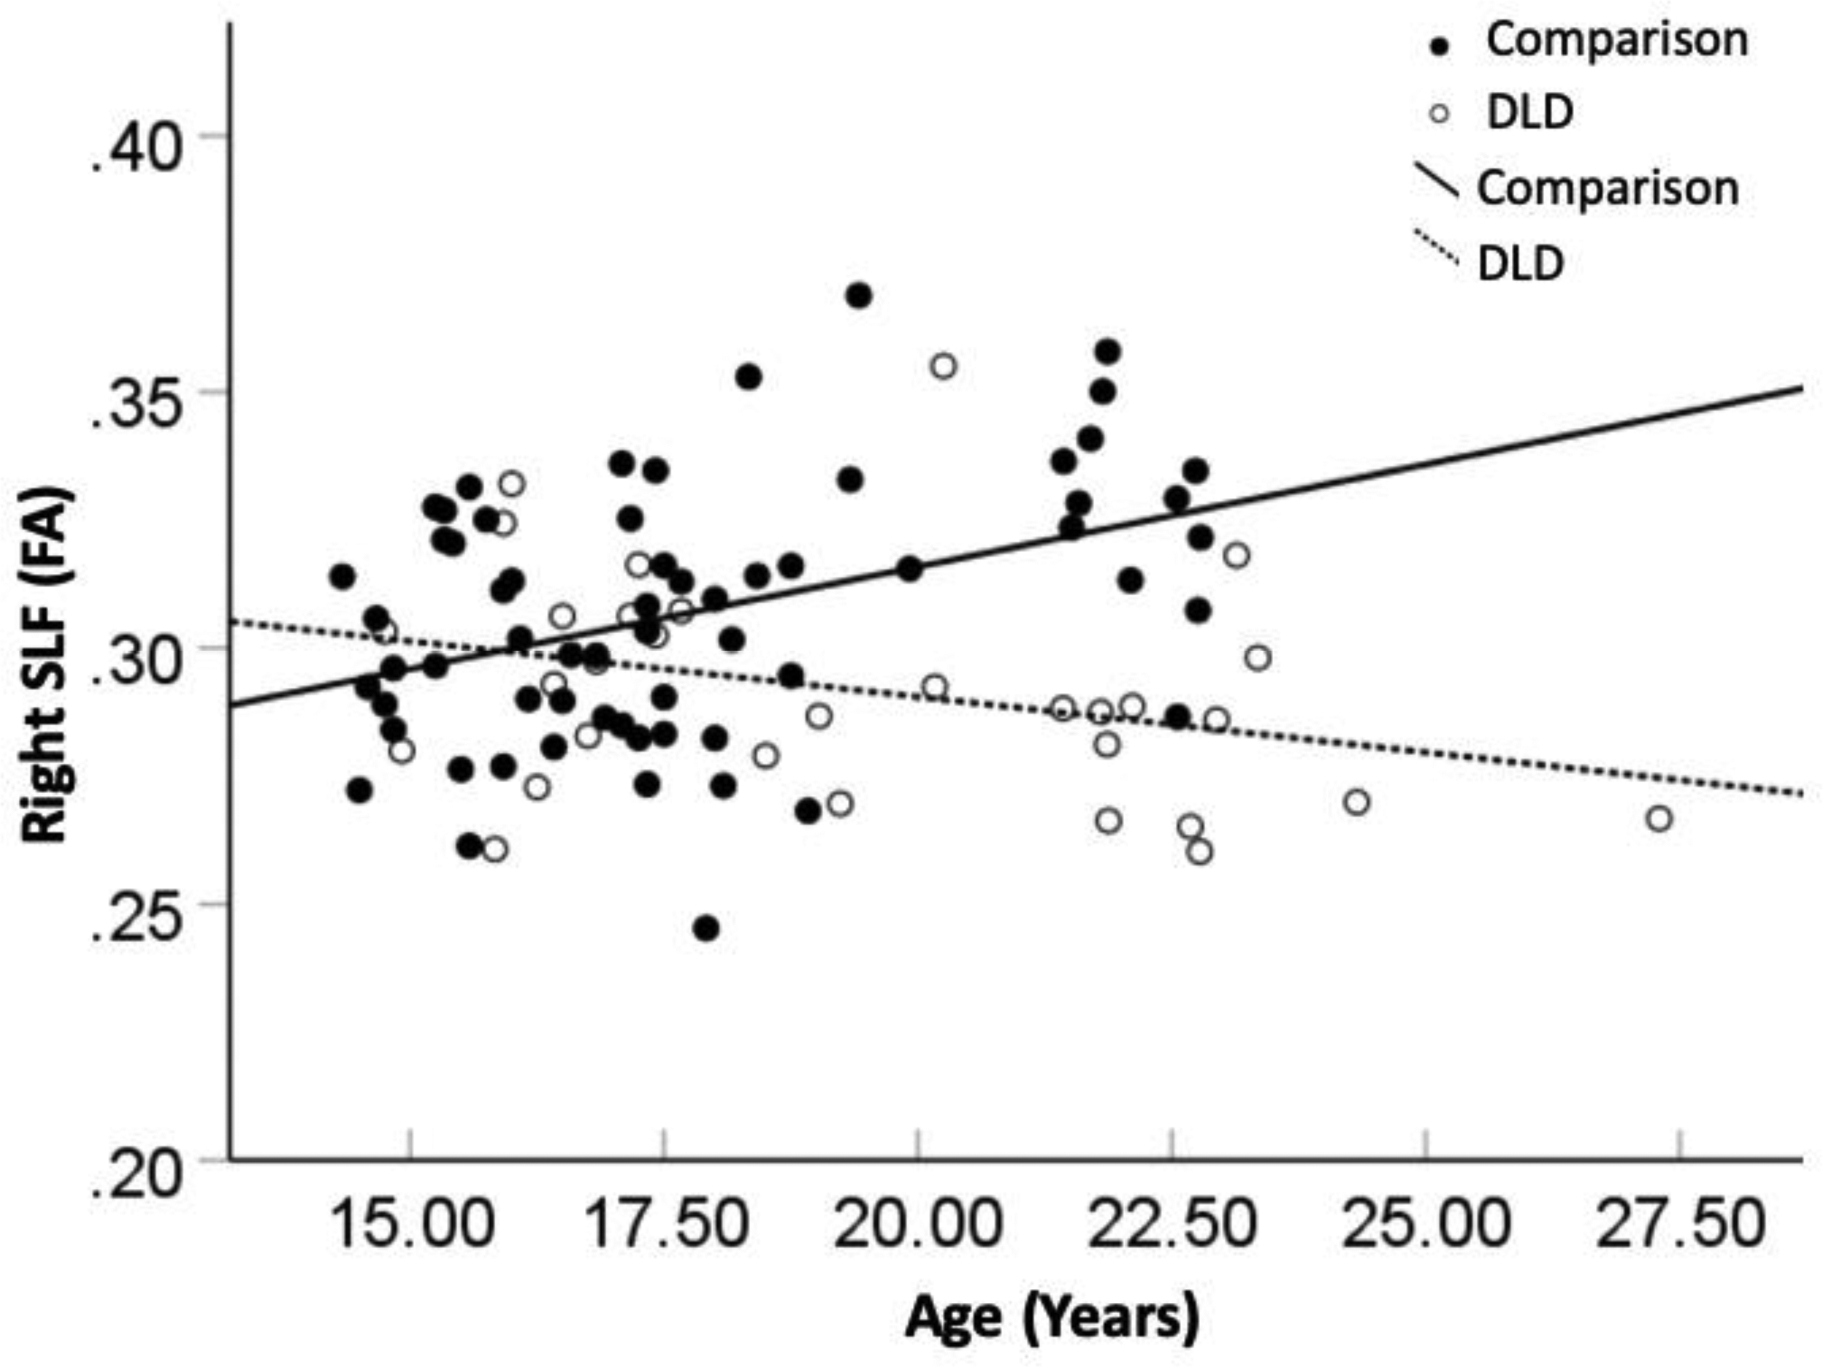
Significant age-by-group interaction effect on fractional anisotropy (FA) measure in the right superior longitudinal fasciculus (SLF) in the dorsal pathway.
Regarding the fiber tracts in the ventral pathway, significantly reduced FA values were found in the DLD group for the left IFOF, F(1, 86)= 5.70, p = .02, = .06, the right IFOF, F(1, 86)= 9.71, p < .01, = .10, and the left UF, F(1, 86) = 9.05, p = .01, = .10, with no significant Age or Age-by-Group interactions. Two tracts within the ventral pathway showed significant Age-by-Group interaction effects, namely the left ILF, F(1, 86) = 5.41, p = .02, = .06, and the right UF, F(1, 86) = 8.52, p = .004, = .09. Follow-up tests showed that the DLD group had no significantly increased FA across age in the left ILF, r = .20, p = .06, or in the right UF, r = .06, p = .56. In contrast, the comparison group showed a significantly increased FA across age in the left ILF, r = .43, p = .001, as well as in the right UF, r = .30, p = .019 (see Figure 5 and 6).
Figure 5.

Significant age-by-group interaction effect on fractional anisotropy (FA) measure in the right uncinate fasciculus (UF) in the ventral pathway.
Figure 6.

Significant age-by-group interaction effect on fractional anisotropy (FA) measure in the left inferior longitudinal fasciculus (ILF) in the ventral pathway.
Descriptive statistics regarding the FA values for the control tracts are also shown in Table 4. No significant Age, Group or Age-by-Group interaction effects were found for any of these control tracts (see Table 5). In other words, significant difference in the ROIs as shown above could not be solely accounted for by global white matter immaturity.
4. Discussion
In the current study, we examined the brain structures as well as the association fiber tracts in the dorsal and ventral language pathways in individuals with and without DLD. We showed age-related structural brain differences in both dorsal and ventral pathways between individuals with and without DLD. The focus of this study was on the structure of the two pathways; however, we did obtain the ICV measure in order to obtain proportional volume difference. This analysis revealed that the groups differed with respect to ICV such that the DLD group on average had relatively smaller ICV than the comparison group. We have reported this in an earlier paper (Lee, Nopoulos, & Tomblin, 2013). Thus, the current findings provide a replication of this in a younger group. We noted in the earlier paper that these ICV differences could be interpreted as reflecting poorer brain maturation during childhood and that differences in ICV have been reported to be associated with several developmental disorders.
4.1. Dorsal Pathway in DLD
No significant Age-by-Group interaction effects were found in the brain structures in the dorsal pathway. In terms of the Group main effect, the DLD group showed significantly larger gray matter volumes of the left TTG than the comparison group. TTG is a cortical marker for the primary auditory cortex, and is the first cortical stop for auditory information travelling from the brainstem nuclei and medial geniculate nucleus of the thalamus (Morosan et al., 2001). Previous studies have shown that rapid auditory processing skills are important for developing speech perception ability, which supports later language development (e.g., Bailey & Snowling, 2002; Benasich, Thomas, Choudhury, & Leppanen, 2002; Cristia, Seidl, Junge, Soderstrom, & Hagoort, 2014). In the DLD literature, the relationship between auditory processing and DLD has been under debate for decades. One prominent theory attributes DLD to low-level auditory perceptual difficulties (see Tallal et al., 1997, for a review), and researchers supporting this theory have found that training rapid auditory processing improved language skills in children with DLD (Merzenich et al., 1996). It is also suggested that auditory processing deficits shown in DLD arise from insensitivity to durational and amplitude envelope cues (Corriveau, Pasquini, & Goswami, 2007), immaturity of auditory processing (Bishop & McArthur, 2005; Kwok, Joanisse, Archibald, & Cardy, 2018), or from differences in task demands (e.g., Coady, Kluender, & Evans, 2005), instead of poor processing of auditory stimuli. In contrast, other researchers did not find evidence for a necessary role of auditory processing in DLD (Bishop, Carlyon, Deeks, & Bishop, 1999; Helzer, Champlin, & Gillam, 1996; Norrelgen, Lacerda, & Forssberg, 2002). Bishop and McArthur (2005) argued that DLD is a heterogeneous group, and thus atypical auditory processing in DLD may occur at the individual differences level.
Our current findings showed a proportionally increased gray matter volume of the left TTG. To our knowledge, this is the first study directly examining the structure of the primary auditory cortex in individuals with DLD. At this point, it is unclear whether this volumetric enlargement is pathological (e.g., atypical synaptic pruning or atypical myelination in surrounding areas during development) or compensatory (e.g. enlargement to compensate for relatively poor auditory processing functionality in early years). Functional MRI or electroencephalography (EEG) recordings would be helpful to examine whether this structural difference associates with poor functional auditory processing outcomes in individuals with DLD.
In addition, we also showed differences in white matter microstructure in bilateral SLF between the DLD and the comparison group, which is consistent with previous findings (Verly et al., 2018; Vydrova et al., 2015; but see Morgan et al., 2018). Moreover, we add new information by showing atypical FA changes across the study age in the right SLF in the DLD group (see Figure 4). The DLD group had a non-significant change in FA across age, whereas the comparison group had a significantly increased FA across age. The SLF in both hemispheres contribute to language processing. Previous studies showed that the right SLF was positively correlated with executive function skills, set shifting in particular, while the left SLF was more correlated with language, specifically the processing of complex syntactic structures (Dick et al., 2014; Friederici & Gierhan, 2013; Urger et al., 2015). Broce et al. (2015) further showed that microstructural properties of both left and right AF/SLF predict receptive and expressive language outcomes in children, suggesting the potential importance of the contribution of the non-language dominant right SLF to language development and learning. The current findings seem consistent with recent studies showing poor executive functioning in individuals with DLD (Henry, Messer, & Nash, 2012; Vissers, Koolen, Hermans, Scheper, & Knoors, 2015).
4.2. Ventral Pathway in DLD
No significant Age-by-Group interaction effects were found in the brain structures in the ventral pathway after correcting for multiple comparisons. In addition, the DLD group showed significantly larger relative volumes of the right pars orbitalis in the IFG, as well as bilateral temporal poles. Both regions are involved in lexical-semantic processing (Saur et al., 2008; Lambon Ralph, Pobric, & Jefferies, 2009); however, at this point, it is unclear what may account for this volumetric increase. Right IFG is connected with the basal ganglia to modulate response inhibition performance (Aron, Robbins, & Poldrack, 2004; Wiecki & Frank, 2013). Given that individuals with DLD had abnormal volumes of the basal ganglia (Lee, Nopoulos, & Tomblin, 2013), one possibility is that abnormality in the basal ganglia disrupts the normal development reduction in synapse number, resulting in atypical pruning and compromising IFG function.
With regard to the FA measure, we showed an Age-by-Group interaction effect on the right UF (see Figure 5) and the left ILF (see Figure 6). That is, individuals with DLD did not show comparable FA increase across age in the right UF and the left ILF when compared with those without DLD. In addition, the DLD group had lower FAs than the comparison group in most of the fiber tracts in the ventral pathway, including the bilateral IFOF, the left UF, and the right ILF.
Taken together, these results indicate that the microstructural development of the ventral pathway is affected in individuals with DLD. Given that the general function of the ventral pathway is to support lexical-semantic aspects of language (Hickok & Poeppel, 2004; Friederici & Gierhan, 2013; Saur et al., 2008), the current findings suggest a potential biological correlate of lexical-semantic deficits in adolescents/young adults with DLD. In contrast to morphosyntax, relatively less attention has been paid to lexical-semantic development in DLD. In the past decade, growing evidence shows that individuals with DLD not only have morphosyntactic deficits, but they also have lexical-semantic weakness (Nation, 2014). Our findings highlight the need for more work on lexical-semantic development across a wide range of age in DLD.
It is important to bear in mind that these white matter tracts of interest are not exclusive to language function. For example, the UF plays a critical role in the formation and retrieval of episodic memory (McDonald et al., 2008), while the ILF involves object recognition and visual memory in addition to lexical-semantic processing (Ortibus et al., 2012; Shinoura et al., 2007). Thus, the next step is to explore the brain-behavior relationships by examining the effect of structural differences on functional outcomes in DLD. The potential results would contribute to our understanding of the role of domain-general cognitive factors in language development and learning.
4.3. DLD: An Emergent Outcome from Interactions between Biology and Environment
In the current study, we showed structural differences in the dorsal and ventral language pathways in individuals with DLD. DLD is a neurodevelopmental disorder, wherein language impairment gradually unfolds over time in the maturation of the brain as it is gradually shaped by genetic as well as environmental factors (Bishop, 2000; Karmiloff-Smith, 1998; Mareschal et al., 2007; Westermann, 2016). Our findings raise the question of the causal relationship between brain structures and language function in DLD. On the one hand, it is possible that structural differences reflect a biological prerequisite for DLD, and thus poor language acquisition and learning may be considered as being dependent on existing structural alterations in the brain. On the other hand, it is also possible that structural differences are simply reflective of an emergent outcome arising from abnormal language development. It is unlikely that we can tease apart the contributions of biological and environmental factors to language development in our adolescent/adult subjects. However, it is not any easier to tease them apart in younger children or infants, because the influence of environmental factors on language development begins before birth (Hepper, 2015; Moon et al., 2013; Partanen et al., 2013). It is likely that a dynamic interaction between neurobiological predispositions and language function continues during development and maturation (Karmiloff-Smith, 1998; Tomblin & Christiansen, 2010).
Due to the complexity of the mechanisms underlying DLD, it is important to use converging methods in the same study to examine DLD at a multi-systems level (e.g., genetic, neural, cognitive, behavioral, environmental) (Tomblin & Christiansen, 2000). Better understanding of the multi-level mechanisms will help us develop different types of interventions addressing the phenotypic heterogeneity in DLD. For example, behavioral genetic studies of DLD could inform us how allelic variations influence a person’s response to language interventions, or brain imaging studies could inform us the behavioral or cognitive strengths/weaknesses of individuals with DLD as well as their compensatory strategies in coping with language difficulty.
5. Conclusion
In the current study, we showed structural differences in the dorsal and ventral language pathways between individuals with and without DLD, and these differences varied between the ages of 14 and 27. These are preliminary data only, and future studies are needed to examine the role of age in the brains of DLD. Language development is supported by distributed neural networks connecting both cortical and subcortical regions throughout the brain (Lieberman, 2002; Mesulam, 1990). While the current study focused on the cortical language-relevant gray matter volumes and white matter fiber tracts in DLD, it would be also important to address how subcortical networks interact with the cortical language pathways to support language development and learning. In addition, it is important to examine what and how environmental factors play a role in atypical language development, given that subtle environmental changes are also possible to compound over time (e.g., low socioeconomic status leading to less variation or poor quality of language input).
Despite significant findings, the study has several limitations. First, in order to obtain a wide age range we recruited two cohorts using different recruitment approaches. Ideally, we would have used a longitudinal design or at least the same recruitment methods. The former would have required considerable time and would likely face considerable attrition since the age range spanned the transition from adolescence to adulthood with attendant changes residence. In the latter case, it is difficult to devise a common recruitment method for adolescents and young adults given different living and life activities. To address the possible cohort effects, we used statistical methods to ensure that groups were comparable between the two cohorts with regard to language status. Moreover, to be conservative, we put Cohort as a covariate in all analyses. In future studies, it would be more ideal to recruit a larger sample using the same recruitment methods. Second, we used FreeSurfer to obtain automatic gray matter segmentation, as well as using JHU white matter tractography atlas to label the main fiber tracts of interest. Thus, we were not able to easily delineate different portions of the STG, or to measure FA in distinct components of the SLF (Friederici, 2009; Kamali et al., 2014; Martino et al., 2013). Tractography will be helpful in identifying the subcomponents of the fiber tracts. Third, this is a cross-sectional study design, with very large age ranges and relatively few participants in each age banding. And there were more female subjects participating in the current study. Thus, caution needs to be taken when interpreting the results pertaining to the differential course of brain development as a function of language status. Longitudinal designs using growth curve analysis will be more appropriate to directly address this issue.
Acknowledgements
We would like to thank the staff in the Child Language Research Center and the MACLab at the University of Iowa for their help with subject recruitment and data collection, as well as Eric Axelson in the Nopoulos Lab for his assistance in image preprocessing and processing. We also want to express our gratitude to our participants and their parents for agreeing to take part in this study.
Compliance with Ethical Standards
This work was supported by the National Institute on Deafness and Other Communication Disorders (NIDCD) awarded to Dr. Tomblin [Grant R21DC013733]. All authors declare that they have no conflict of interest. All procedures performed in the study involving human participants were in accordance with the ethical standards of the institutional and/or national research committee and with the 1964 Helsinki declaration and its later amendments or comparable ethical standards. Informed consent was obtained from all individual participants included in the study.
Footnotes
Publisher's Disclaimer: This Author Accepted Manuscript is a PDF file of a an unedited peer-reviewed manuscript that has been accepted for publication but has not been copyedited or corrected. The official version of record that is published in the journal is kept up to date and so may therefore differ from this version.
The TTG is part of both dorsal and ventral pathways. For the purpose of simplicity, we categorize it as one of the ROIs in the dorsal pathway. It is because the primary function of the TTG is speech processing (e.g., processing spectral properties of sounds), which is a major function of the dorsal pathway.
Absolute volumes were provided in order that the current findings could be compared to those that were not corrected for ICV. Our statistical analyses were limited to the relative values.
References
- Alexander AL, Lee JE, Lazar M, & Field AS (2007). Diffusion tensor imaging of the brain. Neurotherapeutics, 4, 316–329. [DOI] [PMC free article] [PubMed] [Google Scholar]
- Anthony JL, Davis C, Williams JM, & Anthony TI (2014). Preschoolers’ oral language ability: A multilevel examination of dimensionality. Learning and Individual Differences, 35, 56–61. [Google Scholar]
- Aron AR, Robbins TW, & Poldrack RA (2004). Inhibition and the right inferior frontal cortex. Trends in Cognitive Sciences, 8(4), 170–177. [DOI] [PubMed] [Google Scholar]
- Asato MR, Terwilliger R, Woo J, & Luna B (2010). White matter development in adolescence: A DTI study. Cerebral Cortex, 20(9), 2122–2131. [DOI] [PMC free article] [PubMed] [Google Scholar]
- Badcock NA, Bishop DVM, Hardiman MJ, Barry JG, & Watkins KE (2012). Co-localisation of abnormal brain structure and function in specific language impairment. Brain and Language, 120(3), 310–320. [DOI] [PMC free article] [PubMed] [Google Scholar]
- Bailey P, & Snowling M (2002). Auditory processing and the development of language and literacy. British Medical Bulletin, 63(1), 135–146. [DOI] [PubMed] [Google Scholar]
- Bajada CJ, Lambon Ralph MA, & Cloutman LL (2015). Transport for language south of the Sylvian fissure: The routes and history of the main tracts and stations in the ventral language network. Cortex, 69, 141–151. [DOI] [PubMed] [Google Scholar]
- Barnea-Goraly N, Menon V, Eckert M, Tamm L, Bammer R, Karchemskiy A, …Reiss AL (2005). White matter development during childhood and adolescence: A cross-sectional diffusion tensor imaging study. Cerebral Cortex, 15(12), 1848–1854. [DOI] [PubMed] [Google Scholar]
- Benasich AA, Thomas JJ, Choudhury N, & Leppanen PHT (2002). The importance of rapid auditory processing abilities to early language development: Evidence from converging methodologies. Developmental Psychobiology, 40(3), 278–292. [DOI] [PMC free article] [PubMed] [Google Scholar]
- Benjamini Y, & Hochberg Y (1995). Controlling the false discovery rate: A practical and powerful approach to multiple testing. Journal of the Royal Statistical Society, Series B, 57(1), 289–300. [Google Scholar]
- Bishop DVM (2000). How does the brain learn language? Insights from the study of children with and without language impairment. Developmental Medicine & Child Neurology, 42, 133–142. [DOI] [PubMed] [Google Scholar]
- Bishop DVM (2013). Cerebral asymmetry and language development: Cause, correlate or consequence? Science, 340(6138), 1230531. [DOI] [PMC free article] [PubMed] [Google Scholar]
- Bishop DVM, Carlyon RP, Deeks JM, & Bishop SJ (1999). Auditory temporal processing impairment: Neither necessary nor sufficient for causing language impairment in children. Journal of Speech, Language, and Hearing Research, 42(6), 1295–1310. [DOI] [PubMed] [Google Scholar]
- Bishop DVM, & McArthur GM (2005). Individual differences in auditory processing in specific language impairment: A follow-up study using event-related potentials and behavioral thresholds. Cortex, 41(3), 327–341. [DOI] [PMC free article] [PubMed] [Google Scholar]
- Bornstein MH, Hahn CS, Putnick DL, & Suwalsky JTD (2014). Stability of core language skill from early childhood to adolescence: A latent variable approach. Child Development, 85(4), 1346–1356. [DOI] [PMC free article] [PubMed] [Google Scholar]
- Brauer J, Anwander A, & Friederici AD (2011). Neuroanatomical prerequisites for language functions in the maturing brain. Cerebral Cortex, 21, 459–466. [DOI] [PubMed] [Google Scholar]
- Brauer J, Anwander A, Perani D, & Friederici AD (2013). Dorsal and ventral pathways in language development. Brain and Language, 127(2), 289–295. [DOI] [PubMed] [Google Scholar]
- Broce I, Bernal B, Altman N, Tremblay P, & Dick AS (2015). Fiber tracking of the frontal aslant tract and subcomponents of the arcuate fasciculus in 5–8-year-olds: Relation to speech and language function. Brain and Language, 149, 66–76. [DOI] [PubMed] [Google Scholar]
- Catani M, Jones DK, & Ffytche DH (2005). Perisylvian language networks of the human brain. Annual Neurology, 57(1), 8–16. [DOI] [PubMed] [Google Scholar]
- Cheng P, Magnotta VA, Wu D, Nopoulos P, Moser DJ, Paulsen J, et al. (2006). Evaluation of the GTRACT diffusion tensor tractography algorithm: a validation and reliability study. NeuroImage, 31(3), 1075–1085. [DOI] [PubMed] [Google Scholar]
- Clark MM, & Plante E (1998). Morphology of the inferior frontal gyrus in developmentally language-disordered adults. Brain and Language, 61(2), 288–303. [DOI] [PubMed] [Google Scholar]
- Cloutman LL (2013). Interaction between dorsal and ventral processing streams: where, when, and how? Brain and Language, 127(2), 251–263. [DOI] [PubMed] [Google Scholar]
- Coady JA, Kluender KR, & Evans JL (2005). Categorical perception of speech by children with specific language impairments. Journal of Speech, Language, and Hearing Research, 48(4), 944–959. [DOI] [PMC free article] [PubMed] [Google Scholar]
- Cohen M, Campbell R, & Yaghmai F (1989). Neuropathological abnormalities in developmental dysphasia. Annals of Neurology, 25(6), 567–570. [DOI] [PubMed] [Google Scholar]
- Corriveau k., Pasquini E, & Goswami U (2007). Basic auditory processing skills and specific language impairment: A new look at an old hypothesis. Journal of Speech, Language, and Hearing Research, 50, 647–666. [DOI] [PubMed] [Google Scholar]
- Cristia A, Seidl A, Junge C, Soderstrom M, & Hagoort P (2014). Predicting individual variation in language from infant speech perception measures. Child Development, 85(4), 1330–1345. [DOI] [PubMed] [Google Scholar]
- Dale AM, Fischl B, & Sereno MI (1999). Cortical surface-based analysis. I. Segmentation and surface reconstruction. NeuroImage, 9(2), 179–194. [DOI] [PubMed] [Google Scholar]
- De Fossé L, Hodge SM, Makris N, Kennedy DN, Caviness VS Jr., McGrath L, …Harris GJ (2004). Language-association cortex asymmetry in autism and specific language impairment. Annals of Neurology, 56(6), 757–766. [DOI] [PubMed] [Google Scholar]
- De Guibert C, Maumet C, Jannin P, Ferre J-C, Treguier C, Barillot C, …Biraben A (2011). Abnormal functional lateralization and activity of language brain areas in typical specific language impairment. Brain, 134(10), 3044–3058. [DOI] [PMC free article] [PubMed] [Google Scholar]
- De Renzi E, & Faglioni P (1978). Normative data and screening power of a shortened version of the Token Test. Cortex, 14, 41–49. [DOI] [PubMed] [Google Scholar]
- Dick AS, Bernal B, & Tremblay P (2014). The language connectome: New pathways, new concepts. Neuroscientist, 20(5), 453–467. [DOI] [PubMed] [Google Scholar]
- Dollaghan CA (2011). Taxometric analyses of specific language impairment in 6-year-old children. Journal of Speech, Language, and Hearing Research, 54, 1361–1371. [DOI] [PubMed] [Google Scholar]
- Duffau H, Gatignol P, Moritz-Gasser S, & Mandonnet E (2009). Is the left uncinate fasciculus essential for language? Journal of Neurology, 256(3), 382–389. [DOI] [PubMed] [Google Scholar]
- Duffau H, Herbet G, & Moritz-Gasser S (2013). Toward a pluri-component, multimodal, and dynamic organization of the ventral semantic stream in humans: Lessons from stimulation mapping in awake patients. Frontiers in Systems Neuroscience, 7(44), 1–4. [DOI] [PMC free article] [PubMed] [Google Scholar]
- Dunn LM, & Dunn DM (2007). Peabody picture vocabulary test-fourth edition (PPVT-4). MN: Pearson. [Google Scholar]
- Evans J (2001). An emergent account of language impairments in children with SLI: implications for assessment and intervention. Journal of Communication Disorders, 34(1–2), 39–54. [DOI] [PubMed] [Google Scholar]
- Fields RD (2008). White matter in learning, cognition and psychiatric disorders. Trends in Neurosciences, 31(7), 361–370. [DOI] [PMC free article] [PubMed] [Google Scholar]
- Fischl B, Liu A, & Dale AM (2001). Automated manifold surgery: constructing geometrically accurate and topologically correct models of the human cerebral cortex. IEEE Transactions on Medical Image, 20(1), 70–80. [DOI] [PubMed] [Google Scholar]
- Fischl B, Sereno MI, Tootell RBH, & Dale AM (1999). High-resolution inter-subject averaging and a coordinate system for the cortical surface. Human Brain Mapping, 8, 272–284. [DOI] [PMC free article] [PubMed] [Google Scholar]
- Friederici AD (2009). Pathways to language: Fiber tracts in the human brain. Trends in Cognitive Sciences, 13(4), 175–181. [DOI] [PubMed] [Google Scholar]
- Friederici AD, & Gierhan S (2013). The language network. Current Opinion in Neurobiology, 23, 250–254. [DOI] [PubMed] [Google Scholar]
- Gauger LM, Lombardino IJ, & Leonard CM (1997). Brain morphology in children with specific language impairment. Journal of Speech, Language, and Hearing Research, 40, 1272–1284. [DOI] [PubMed] [Google Scholar]
- Glasser MF, & Rilling JK (2008). DTI Tractography of the human brain’s language pathways. Cerebral Cortex, 18(11), 2471–2482. [DOI] [PubMed] [Google Scholar]
- Hammill DD, Brown VL, Larsen SC, Wiederholt JL (2007). Test of adolescent and adult language, fourth edition (TOAL-4). Austin, TX: Pro-Ed. [Google Scholar]
- Harris G, Andreasen NC, Cizadlo T, Bailey JM, Bockholt HJ, Magnotta VA, & Arndt S (1999). Improving tissue classification in MRI: a three-dimensional multispectral discriminant analysis method with automated training class selection. Journal of Computer Assisted Tomography, 23(1), 144–154. [DOI] [PubMed] [Google Scholar]
- Helzer JR, Champlin CA, & Gillam RB (1996). Auditory temporal resolution in specifically language-impaired and age-matched children. Perceptual and Motor Skills, 83(3), 1171–1181. [DOI] [PubMed] [Google Scholar]
- Henry LA, Messer DJ, & Nash G (2012). Executive functioning in children with specific language impairment. Journal of Child Psychology and Psychiatry, 53(1), 37–45. [DOI] [PubMed] [Google Scholar]
- Hepper P (2015). Behavior during the prenatal period: Adaptive for development and survival. Child Development and Perspectives, 9(1), 38–43. [Google Scholar]
- Herbert MR, Ziegler DA, Makris N, Bakardjiev A, Hodgson J, Adrien KT, …Caviness VS Jr. (2003). Larger brain and white matter volumes in children with developmental language disorder. Developmental Science, 6(4), F11–F22. [Google Scholar]
- Herbert MR, Ziegler DA, Makris N, Filipek PA, Kemper TL, Normandin JJ, … Caviness VS (2004). Localization of white matter volume increase in autism and developmental language disorder. Annals of Neurology, 55(4), 530–540. [DOI] [PubMed] [Google Scholar]
- Herbert MR, Ziegler DA, Deutsch CK, O’Brien LM, Kennedy DN, Filipek PA, …Caviness VS (2005). Brain asymmetries in autism and developmental language disorder: a nested whole-brain analysis. Brain, 128, 213–26. [DOI] [PubMed] [Google Scholar]
- Hickok G, & Poeppel D (2004). Dorsal and ventral streams: A framework for understanding aspects of the functional anatomy of language. Cognition, 92(1–2), 67–99. [DOI] [PubMed] [Google Scholar]
- Hofer S, & Frahm J (2006). Topography of the human corpus callosum revisited--comprehensive fiber tractography using diffusion tensor magnetic resonance imaging. NeuroImage, 32(3), 989–994. [DOI] [PubMed] [Google Scholar]
- Hua K, Zhang J, Wakana S, Jiang H, Li X, Reich DS,…Mori S (2008). Tract probability maps in stereotaxic spaces: analyses of white matter anatomy and tract-specific quantification. NeuroImage, 39(1), 336–47. [DOI] [PMC free article] [PubMed] [Google Scholar]
- Hugdahl K, Gundersen H, Brekke C, Thomsen T, Rimol LM, Ersland L, & Niemi J (2004). FMRI brain activation in a Finnish family with specific language impairment compared with a normal control group. Journal of Speech, Language, and Hearing Research, 47, 162–172. [DOI] [PubMed] [Google Scholar]
- Huppi PS, & Dubois J (2006). Diffusion tensor imaging of brain development. Seminars in Fetal and Neonatal Medicine, 11(6), 489–497. [DOI] [PubMed] [Google Scholar]
- Jancke L, Siegenthaler T, Preis S, & Steinmetz H (2007). Decreased white-matter density in a left-sided fronto-temporal network in children with developmental language disorder: evidence for anatomical anomalies in a motor-language network. Brain and Language, 102, 91–98. [DOI] [PubMed] [Google Scholar]
- Jernigan TL, Hesselink JR, Sowell E, & Tallal PA (1991). Cerebral structure on magnetic resonance imaging in language- and learning-impaired children. Archives of Neurology, 48, 539–545. [DOI] [PubMed] [Google Scholar]
- Kamali A, Flanders AE, Brody J, Hunter JV, & Hasan KM (2014). Tracing superior longitudinal fasciculus connectivity in the human brain using high resolution diffusion tensor tractography. Brain Structure and Function, 219(1), 269–281. [DOI] [PMC free article] [PubMed] [Google Scholar]
- Karmiloff-Smith A (1998). Development itself is the key to understanding developmental disorders. Trends in Cognitive Sciences, 2(10), 389–398. [DOI] [PubMed] [Google Scholar]
- Kochunov P, Williamson DE, Lancaster J, Fox P, Cornell J, Blangero J, & Glahn DC (2012). Fractional anisotropy of water diffusion in cerebral white matter across the lifespan. Neurobiology of Aging, 33(1), 9–20. [DOI] [PMC free article] [PubMed] [Google Scholar]
- Kurth F, Luders E, Pigdon L, Conti-Ramsden G, Reilly S, & Morgan AT (2018). Altered gray matter volumes in language- associated regions in children with developmental language disorder and speech sound disorder. Developmental Psychobiology, 60(7), 814–824. [DOI] [PubMed] [Google Scholar]
- Kwok EYL, Joanisse MF, Archibald LMD, & Cardy JO (2018). Immature auditory evoked potentials in children with moderate-severe developmental language disorder. Journal of Speech, Language, and Hearing Research, 61, 1718–1730. [DOI] [PubMed] [Google Scholar]
- Krishnan S, Watkins KE, & Bishop DVM (2016). Neurobiological basis of language learning difficulties. Trends in Cognitive Sciences, 20(9), 701–714. [DOI] [PMC free article] [PubMed] [Google Scholar]
- Lambon Ralph MA, Pobric G, & Jefferies E (2009). Conceptual knowledge is underpinned by the temporal pole bilaterally: Convergent evidence from rTMS. Cerebral Cortex, 19(4), 832–838. [DOI] [PubMed] [Google Scholar]
- Language and Reading Research Consortium. (2015). The dimensionality of language asbility in young children. Child Development, 86(6), 1948–1965. [DOI] [PubMed] [Google Scholar]
- Lebel C, Gee M, Camicioli R, Wieler M, Martin W, Beaulieu C (2012). Diffusion tensor imaging of white matter tract evolution over the lifespan. NeuroImage, 60(1), 340–352. [DOI] [PubMed] [Google Scholar]
- Lee JC, Nopoulos PC, & Tomblin JB (2013). Abnormal subcortical components of the corticostriatal system in young adults with DLI: A combined structural MRI and DTI study. Neuropsychologia, 51(11), 2154–2161. [DOI] [PMC free article] [PubMed] [Google Scholar]
- Liégeois FJ, Turner SJ, Mayes A, Bonthrone AF, Boys A, Smith L, …Morgan AT (2019). Dorsal language stream anomalies in an inherited speech disorder. Brain, 142(4), 966–977. [DOI] [PubMed] [Google Scholar]
- Leonard CM, Lombardino LJ, Walsh K, Eckert MA, Mockler JL, Rowe LA, …de Bose CB (2002). Anatomical risk factors that distinguish dyslexia from SLI predict reading skill in normal children. Journal of Communication Disorders, 35, 501–531. [DOI] [PubMed] [Google Scholar]
- Leonard LB (1998). Children with specific language impairment. Cambridge, MA: MIT Press. [Google Scholar]
- Leonard LB (2014). Children with specific language impairment and their contribution to the study of language development. Journal of Child Language, 41(S1), 38–47. [DOI] [PMC free article] [PubMed] [Google Scholar]
- Leroy F, Glasel H, Dubois J, Hertz-Pannier L, Thirlon B, Mangin J, & Dehaene-Lambetz G (2011). Early maturation of the linguistic dorsal pathway in human infants. Journal of Neuroscience, 31(4), 1500–1506. [DOI] [PMC free article] [PubMed] [Google Scholar]
- Lieberman P (2002). On the nature and evolution of the neural bases of human language. Yearbook of Physical Anthropology, 45, 36–62. [DOI] [PubMed] [Google Scholar]
- Liu Z, Wang Y, Gerig G, Gouttard S, Tao R, Fletcher T, & Styner M (2010). Quality control of diffusion weighted images. Proceedings of SPIE, 11, 7628. [DOI] [PMC free article] [PubMed] [Google Scholar]
- Magnotta VA, Harris G, Andreasen NC, O′Leary DS, Yuh WT, & Heckel D (2002). Structural MR image processing using the BRAINS2 toolbox. Computerized Medical Imaging and Graphics, 26(4), 251–264. [DOI] [PubMed] [Google Scholar]
- Magnotta VA, Heckel D, Andreasen NC, Cizadlo T, Corson PW, Ehrhardt JC, et al. (1999). Measurement of brain structures with artificial neural networks: two- and three-dimensional applications. Radiology, 211(3), 781–790. [DOI] [PubMed] [Google Scholar]
- Mareschal D, Johnson MH, Sirios S, Spratling M, Thomas MSC, & Westermann G (2007). Neuroconstructivism. Vol. I. How the brain constructs cognition. Oxford, England: Oxford University Press. [Google Scholar]
- Markanday S, Brennan SL, Gould H, & Pasco JA (2013). Sex-differences in reasons for non-participation at recruitment: Geelong Osteoporosis Study. BMC Research Notes, 6(104), 1–7. [DOI] [PMC free article] [PubMed] [Google Scholar]
- Martino J, De Witt Hamer PC, Berger MS, Lawton MT, Arnold CM, de Lucas EM, & Duffau H (2013). Analysis of the subcomponents and cortical terminations of the perisylvian superior longitudinal fasciculus: A fiber dissection and DTI tractography study. Brain Structure and Function, 218(1), 105–121. [DOI] [PubMed] [Google Scholar]
- McDonald CR, Ahmadi ME, Hagler DJ, Tecoma ES, Iragui VJ, Gharapetian L, …Halgren E (2008). Diffusion tensor imaging correlates of memory and language impairments in temporal lobe epilepsy. Neurology, 71, 1869–1876. [DOI] [PMC free article] [PubMed] [Google Scholar]
- McGregor K, Licandro U, Arenas R, Eden N, Stiles D, Bean A, et al. (2013). Why words are hard for adults with developmental language impairments. Journal of Speech, Language, and Hearing Research, 56(6), 1845–1856. [DOI] [PMC free article] [PubMed] [Google Scholar]
- Merzenich MM, Jenkins WM, Johnston P, Schreiner C, Miller SL, & Tallal P (1996). Temporal processing deficits of language-learning impaired children ameliorated by training. Science, 271(5245), 77–81. [DOI] [PubMed] [Google Scholar]
- Mesulam M (1990). Large-scale neurocognitive networks and distributed processing for attention, language, and memory. Annals of Neurology, 28(5), 597–613. [DOI] [PubMed] [Google Scholar]
- Moon C, Lagercrantz H, & Huhl PK (2013). Language experienced in utero affects vowel perception after birth: a two-country study. Acta Paediatrica, 102(2), 156–160. [DOI] [PMC free article] [PubMed] [Google Scholar]
- Morgan AT, Su M, Reilly S, Conti-Ramsden G, Connelly A, & Liégeois FJ (2018). A brain marker for developmental speech disorders. The Journal of Pediatrics, 198, 234–239. [DOI] [PubMed] [Google Scholar]
- Morice R, & McNicol D (1985). The comprehension and production of complex syntax in schizophrenia. Cortex, 21, 567–580. [DOI] [PubMed] [Google Scholar]
- Morosan P, Rademacher J, Schleicher A, Amunts K, Schormann T, & Zilles K (2001). Human primary auditory cortex: Cytoarchitectonic subdivisions and mapping into a spatial reference system. NeuroImage, 13(4), 685–701. [DOI] [PubMed] [Google Scholar]
- Nation K (2014). Lexical learning and lexical processing in children with developmental language impairments. Philosophical Transactions of the Royal Society B, 369, 20120387. [DOI] [PMC free article] [PubMed] [Google Scholar]
- Norbury CF, Gooch D, Wray C, Baird G, Charmand T, Simonoff E, … & Andrew P (2016). The impact of NVIQ on prevalence and clinical presentation of language disorder: Evidence from a population study. Journal of Child Psychology and Psychiatry, 11, 1247–1257. [DOI] [PMC free article] [PubMed] [Google Scholar]
- Norbury CF, Tomblin JB, & Bishop DV (Eds.). (2008). Understanding developmental language disorders. Hove and New York: Psychology Press. [Google Scholar]
- Norrelgen F, Lacerda F, & Forssberg H (2002). Temporal resolution of auditory perception and verbal working memory in 15 children with language impairment. Journal of Learning Disabilities, 35(6), 539–545. [DOI] [PubMed] [Google Scholar]
- Oguz I, Zhang H, Rumple A, & Sonka M (2014). RATS: Rapid automatic tissue segmentation in rodent brain MRI. Journal of Neuroscience Methods, 221, 175–182. [DOI] [PMC free article] [PubMed] [Google Scholar]
- Ortibus E, Verhoeven J, Sunaert S, Casteels I, de Cock P, & Lagae L (2012). Integrity of the inferior longitudinal fasciculus and impaired object recognition in children: a diffusion tensor imaging study. Developmental Medicine & Child Neurology, 54(1), 38–43. [DOI] [PubMed] [Google Scholar]
- Partanen E, Kujala T, Naatanen R, Liitola A, Sambeth A, & Huotilainen M (2013). Learning-induced neural plasticity of speech processing before birth. PNAS, 110(37), 15145–15150. [DOI] [PMC free article] [PubMed] [Google Scholar]
- Perani D, Saccuman MC, Scifo P, Anwander A, Spada D, Baldoli C, …Friederici AD (2011). Neural language networks at birth. PNAS, 108(38), 16056–16061. [DOI] [PMC free article] [PubMed] [Google Scholar]
- Plante E, Swisher L, Vance R, & Rapcsak S (1991). MRI findings in boys with specific language impairment. Brain and Language, 41, 52–66. [DOI] [PubMed] [Google Scholar]
- Poll GH (2011). Increasing the odds: applying emergentist theory in language intervention. Language, Speech, and Hearing Services in Schools, 42(4), 580–591. doi: 10.1044/0161-1461(2011/10-0041). [DOI] [PMC free article] [PubMed] [Google Scholar]
- Preis S, Steinmetz H, Knorr U, & Jancke L (2000). Corpus callosum size in children with developmental language disorder. Brain Research. Cognitive Brain Research, 10(1–2), 37–44. [DOI] [PubMed] [Google Scholar]
- Qiu A, Mori S, & Miller MI (2015). Diffusion tensor imaging for understanding brain development in early life. Annual Review of Psychology, 66, 853–576. [DOI] [PMC free article] [PubMed] [Google Scholar]
- Qiu D, Tan L, Zhou K, & Khong P (2008). Diffusion tensor imaging of normal white matter maturation from late childhood to young adulthood: Voxel-wise evaluation of mean diffusivity, fractional anisotropy, radial and axial diffusivities, and correlation with reading development. NeuroImage, 41(2), 223–232. [DOI] [PubMed] [Google Scholar]
- Roberts TPL, Heiken K, Zarnow D, Dell J, Nagae L, Blaskey L, …Edgar JC (2014). Left hemisphere diffusivity of the arcuate fasciculus: Influences of autism spectrum disorder and language impairment. American Journal of Neuroradiology, 35(3), 587–592. [DOI] [PMC free article] [PubMed] [Google Scholar]
- Rolheiser T, Stamatakis EA, & Tyler LK (2011). Dynamic processing in the human language system: Synergy between the arcuate fascicle and extreme capsule. The Journal of Neuroscience, 31(47), 16949–16957. [DOI] [PMC free article] [PubMed] [Google Scholar]
- Saur D, Kreher BW, Schnell S, Kummerer D, Kellmeyer P, Vry M, et al. (2008). Ventral and dorsal pathways for language. PNAS, 105(46), 18035–18040. [DOI] [PMC free article] [PubMed] [Google Scholar]
- Semel EM, Wiig EH, & Secord W (2003). Clinical evaluation of language fundamentals, fourth edition (CELF-4). San Antonio, TX: The Psychological Corporation. [Google Scholar]
- Shinoura N, Suzuki Y, Tsukada M, Katsuki S, Yamada R, Tabei Y, et al. (2007). Impairment of inferior longitudinal fasciculus plays a role in visual memory disturbance. Neurocase, 13(2), 127–139. [DOI] [PubMed] [Google Scholar]
- Simmonds D, Hallquist MN, Asato M, & Luna B (2014). Developmental stages and sex differences of white matter and behavioral development through adolescence: A longitudinal diffusion tensor imaging (DTI) Study. NeuroImage, 92, 356–368. [DOI] [PMC free article] [PubMed] [Google Scholar]
- Soriano-Mas C, Pujol J, Ortiz H, Deus J, Lopez-Sala A, & Sans A (2009). Age-related brain structural alterations in children with specific language impairment. Human Brain Mapping, 30(5), 1626–1636. [DOI] [PMC free article] [PubMed] [Google Scholar]
- Tallal P, Miller SL, Jenkins WM, & Merzenich MM (1997). The role of temporal processing in developmental language-based learning disorders: Research and clinical implications In Blachman BA (ed.), Foundations of reading acquisition and dyslexia: Implications for early intervention (pp.49–66). Mahwah, N.J.: Lawrence Erlbaum. [Google Scholar]
- Thomas M, & Karmiloff-Smith A (2002). Are developmental disorders like cases of adult brain damage? Implications from connectionist modelling. Behavioral and Brain Sciences, 25(6), 727–750. [DOI] [PubMed] [Google Scholar]
- Tomblin JB (2008). Validating diagnostic standards for specific language impairment using adolescent outcomes, in Norbury CF, Tomblin JB, & Bishop DV (Eds.), Understanding developmental language disorders (pp.93–114). Hove and New York: Psychology Press. [Google Scholar]
- Tomblin JB , & Christiansen MH (2010). Explaining developmental communication disorders In Paul R, & Flipsen P Jr . (Eds.), Speech sound disorders in children: In honor of Lawrence D. Shriberg (pp. 35–49). San Diego, CA: Plural Publishing. [Google Scholar]
- Tomblin JB, Records NL, Buckwalter P, Zhang X, Smith E, & O’Brien M (1997). Prevalence of specific language impairment in kindergarten children. Journal of Speech and Hearing Research, 40(6), 1245–1260. [DOI] [PMC free article] [PubMed] [Google Scholar]
- Tomblin JB, Records NL, & Zhang X (1996). A system for the diagnosis of specific language impairment in kindergarten children. Journal of Speech & Hearing Research, 39, 1284–1294. [DOI] [PubMed] [Google Scholar]
- Tomblin JB, & Zhang X (2006). The dimensionality of language ability in school-age children. Journal of Speech, Language, and Hearing Research, 49(6), 1193–1208. [DOI] [PubMed] [Google Scholar]
- Tremblay P, & Dick A (2016). Broca and Wernicke are dead, or moving past the classic model of language neurobiology. Brain and Language, 162, 60–71. [DOI] [PubMed] [Google Scholar]
- Urger SE, de Bellis MD, Hooper SR, Woolley DP, Chen SD, & Provenzale J (2015). The superior longitudinal fasciculus in typically developing children and adolescents. Journal of Child Neurology, 30(1), 9–20. [DOI] [PMC free article] [PubMed] [Google Scholar]
- Verhoeven JS, Rommel N, Prodi E, Leemans A, Zink I, Vandewalle E, …Sunaert S (2012). Is there a common neuroanatomical substrate of language deficit between autism spectrum disorder and specific language impairment? Cerebral Cortex, 22(10), 2263–2271. [DOI] [PubMed] [Google Scholar]
- Verly M, Gerrits R, Sleurs C, Lagae L, Sunaert S, Zink I, & Rommel N (2018). The mis-wired language network in children with developmental language disorder: insights from DTI tractography. Brain Imaging and Behavior. 10.1007/s11682-018-9903-3 [DOI] [PubMed] [Google Scholar]
- Vissers C, Koolen S, Hermans D, Scheper A, & Knoors H (2015). Executive functioning in preschoolers with specific language impairment. Frontiers in Psychology, 20(6), 1574. [DOI] [PMC free article] [PubMed] [Google Scholar]
- Vydrova R, Komarek V, Sanda J, Sterbova K, Jahodova A, Maulisova A, et al. (2015). Structural alterations of the language connectome in children with specific language impairment. Brain and Language,151, 35–41. [DOI] [PubMed] [Google Scholar]
- Wakana S, Caprihan A, Panzenboeck MM, Fallon JH, Perry M, Gollub RL,…Mori S (2007). Reproducibility of quantitative tractography methods applied to cerebral white matter. NeuroImage, 36(3), 630–644. [DOI] [PMC free article] [PubMed] [Google Scholar]
- Wechsler D (1999). Wechsler abbreviated scale of intelligence (WASI). San Antonio, TX: The Psychological Corporation. [Google Scholar]
- Westermann G (2016). Experience-dependent brain development as a key to understanding the language system. Topics in Cognitive Science, 8(2), 446–458. [DOI] [PubMed] [Google Scholar]
- Wiecki TV, & Frank MJ (2013). A computational model of inhibitory control in frontal cortex and basal ganglia. Psychological Review, 120(2), 329–355. [DOI] [PubMed] [Google Scholar]
- Williams K (1997). Expressive vocabulary test, second edition (EVT-2). Circle Pines, MN: American Guidance Service. [Google Scholar]
- Wilson SM, Galantucci S, Tartaglia MCRK, Patterson DK, Henry ML, …Gorno-Tempini ML (2011). Syntactic processing depends on dorsal language tracts. Neuron, 72(2), 397–403. [DOI] [PMC free article] [PubMed] [Google Scholar]
- Wong FCK, Chandrasekaran B, Garibaldi K, & Wong PCM (2011). White matter anisotropy in the ventral language pathway predicts sound-to-word learning success. Journal of Neuroscience, 31(24), 8780–8785. [DOI] [PMC free article] [PubMed] [Google Scholar]