

Abstract
Purpose:
To characterize the rate of change of ganglion cell complex(GCC) thickness and macula vessel density in healthy, pre-perimetric glaucoma and primary open angle glaucoma(POAG) eyes.
Design:
Prospective, longitudinal study.
Participants:
139 eyes(23 healthy eyes, 36 pre-perimetric glaucoma eyes, and 80 POAG eyes) of 94 patients who had at least 3 visits were included from the Diagnostic Innovations in Glaucoma Study. The mean follow-up was 2.0 years for healthy eyes, 2.6 years for pre-perimetric glaucoma eyes, and 2.6 years for POAG eyes.
Methods:
Optical coherence tomography angiography(OCT-A)-based vessel density and OCT-based structural thickness of the same 3×3 mm2 GCC scan slab were evaluated at each visit. The dynamic range-based normalized rates of vessel density and thickness change were calculated and compared within each diagnostic group. The association between the rates of thickness and vessel density change and potential factors, including severity of disease and intraocular pressure(IOP), were evaluated.
Main Outcome Measures:
The rates of GCC thinning and macula vessel density loss.
Results:
Significant rates of both whole image GCC thinning and macula vessel density decrease were detectable in all diagnostic groups(all P<0.05). In healthy eyes and pre-perimetric glaucoma eyes, the normalized rates of GCC thinning and macula vessel density decrease were comparable(all P>0.1). In contrast, the normalized rate(mean,95% CI) of macula vessel density decrease in the POAG eyes(−7.12(−8.36,−5.88)%/year) was significantly faster than GCC thinning(−2.13(−3.35,−0.90)%/year,P<0.001). In the POAG group, more than two-thirds of the eyes showed faster macula vessel density decrease than GCC thinning; faster macula vessel density decrease rate was significantly associated with worse glaucoma severity(P=0.037). The association between GCC thinning rate and glaucoma severity was not significant(P=0.586). IOP during follow-up significantly affected the rate of GCC thinning in all groups(all P<0.05), but had no association with the rate of macula vessel density decrease.
Conclusions:
Both GCC thinning and macula vessel density decrease were detectable overtime in all 3 diagnostic groups. In POAG eyes, macula vessel density decrease was faster than GCC thinning and associated with severity of disease. Macula vessel density is useful for evaluating glaucoma progression, particularly in more advanced disease.
Precis
During 2.6 years follow-up, OCT-A macula superficial vessel density loss was faster than OCT ganglion cell complex thinning, and associated with glaucoma severity in POAG eyes.
The vascular system and ocular blood flow may have an important role in the pathophysiology of primary open angle glaucoma (POAG).1 The “vascular” theory suggests that impaired regulation of ocular blood flow results in periods of relative ischemia that damage neurons, resulting in circumpapillary retinal nerve fiber layer (cpRNFL) and ganglion cell layer thinning. Indeed, the vast majority of published studies dealing with blood flow reported reduced ocular perfusion in glaucoma patients compared with normal subjects, but it is unclear whether vascular impairment is a primary or secondary event with respect to glaucomatous damage to the optic nerve. Optical coherence tomography angiography (OCT-A) is a non-invasive imaging technique that provides simultaneous in vivo imaging of the morphology as well as the vasculature in the eye. Studies using OCT-A have shown microvascular dropout, measured as a decrease of vessel density within the optic nerve head (ONH), the peripapillary retina and the macula in POAG eyes.1,2 Moreover, OCT-A measurements show high repeatability.3–6 For glaucoma eyes, coefficients of variation have been reported between 2.3% and 4.1% with ONH scans and between 3.2% and 7.9% with macular scans.3 Although there have been only a few relevant studies, it is reasonable that longitudinal OCT-A investigation with these repeatable measures can enhance our ability to detect glaucoma progression. However, the reports have been conflicting. With only 24 POAG eyes, Hollo reported significant cpRNFL thinning in 30% of the subjects,7 while 17% of subjects had progressive peripapillary vessel density decrease after removing large vessels.8 Shoji et al reported that there was significant macula vessel density decrease but no structural thinning in 32 POAG eyes with a mean follow-up of 13 months.9
The current study aimed to characterize the progressive change of ganglion cell complex (GCC) thickness and macula vessel density in healthy, pre-perimetric glaucoma and POAG eyes.
Methods
Participants
Healthy subjects, pre-perimetric glaucoma patients, and POAG patients were recruited from the longitudinal Diagnostic Innovations in Glaucoma Study (DIGS).10 Written informed consent was obtained from all participants. The Institutional Review Boards of the University of California San Diego, approved the protocol, and the methodology adheres to the tenets of the Declaration of Helsinki for research involving human subjects and to the Health Insurance Portability and Accountability Act.
Inclusion criteria for DIGS were open angles with gonioscopy, a best-corrected visual acuity of 20/40 or better, a spherical refraction within ±5.0 diopters (D), and cylinder correction within ±3.0 D. Subjects were excluded if they had a history of intraocular surgery (except for uncomplicated glaucoma and cataract surgery). The follow-up of eyes that had uncomplicated glaucoma and cataract surgery would be continued at least 3 months postoperatively. Subjects with secondary causes of elevated intraocular pressure (IOP), other intraocular eye disease, or other diseases affecting visual field (VF) or who were using medications known to affect VF sensitivity also were excluded. Other information such as race, age, systemic disease history, non-ocular medication, blood pressure, and central corneal thickness (CCT) also was collected.
Healthy subjects had (1) IOP < 21 mmHg with no history of elevated IOP; (2) normal appearing optic disc, intact neuroretinal rim and RNFL; and (3) a minimum of two reliable normal VFs, defined as a pattern standard deviation (PSD) within 95% confidence limits and a glaucoma hemifield test (GHT) result within normal limits.1 Pre-perimetric glaucoma was defined as eyes having an optic discs appearance that is suspicious of glaucoma but without evidence of repeatable glaucomatous VF damage. A suspicious appearing optic disc was defined as aw rim narrowing or notching, or a localized or diffuse RNFL defect suggestive of glaucoma with stereophotographs.10 Glaucomatous VF damage was defined as a GHT outside normal limits and a PSD outside 95% normal limits, which were confirmed on at least 2 consecutive, reliable (fixation losses and false-negatives≤ 33% and false-positives≤15%) tests. POAG eyes had reliable and repeatable glaucomatous VF damage.11,12
The severity of glaucoma was classified based on the severity of VF damage at the first visit: mild glaucoma was defined as mean deviation (MD) better than −6 decibels (dB), moderate glaucoma was defined as a MD between −6 to −12dB, and advanced glaucoma was defined as a MD lower than −12 dB.13–15
Follow-up
Participants were evaluated at 6 month intervals. At the baseline visit and at each annual follow-up visit, subjects underwent a complete ophthalmologic examination including slit-lamp biomicroscopy, IOP measurement, dilated stereoscopic fundus examination, and stereophotography of the ONH. VF testing by standard automated perimetry (SAP, Humphrey Field Analyzer; 24-2 Swedish interactive threshold algorithm; Carl Zeiss Meditec, Jena, Germany), OCT-A imaging and Spectral-Domain optical coherence tomography (SD-OCT) imaging were completed at baseline and every visit during follow-up. All included eyes had at least 3 visits with OCT-A and OCT imaging examinations that qualified for inclusion.
Optical Coherence Tomography Angiography and Spectral-Domain Optical Coherence Tomography
All subjects underwent OCT-A and SD-OCT imaging using the AngioVue imaging system (Optovue, Inc., Fremont, CA, USA). This system is an angiographic platform implemented on an existing commercially available SD-OCT platform which provides both thickness and vascular measurements. With the simultaneously acquired OCT and OCT-A volume of the AngioVue scan, and automatic segmentation by the AngioVue software (version 2017.1.0.151), thickness and vascular analyses can be derived from the same with exact registration of the analyzed regions.
Macula 3 x 3 mm2 scans centered on the fovea were acquired with the AngioVue OCT-A system. OCT-A based vessel density and OCT based thickness measures were calculated from the same scan slab, as follows. The split-spectrum amplitude-decorrelation angiography method was used to capture the dynamic motion of the red blood cells and provide a high-resolution 3D visualization of perfused retinal vasculature. Vessel density was calculated as the percent area occupied by flowing blood vessels in the selected region. The retinal layers of each scan were automatically segmented by the AngioVue software in order to visualize the superficial retinal capillary plexuses in a slab from the internal limiting membrane (ILM) to the inner plexiform layer (IPL) −10 μm. For this study, whole en-face image vessel density (wiVD) was derived from the entire 3x3 mm2 scan and perifoveal vessel density (pfVD) was measured in an annular region centered on the fovea with an inner diameter of 1 mm and outer diameter of 3 mm. The macula cube scanning protocol measured the GCC thickness of the same scan slab as the OCT-A scan. GCC thickness analysis regions of whole image (wiGCC) and perifoveal (pfGCC) were the same as that in the OCT-A vessel density analysis.
Only good-quality images were included. OCT-A and SD-OCT images quality review was completed according to the Imaging Data Evaluation and Analysis (IDEA) Reading Center standard protocol on all scans processed with standard AngioVue software (version 2017.1.0.151)16. Poor quality images were excluded; these were defined as images with (1) low scan quality as quality index (QI) less than 4, (2) poor clarity, (3) residual motion artifacts visible as irregular vessel pattern or disc boundary on the enface angiogram, (4) image cropping or local weak signal due to vitreous opacity, or (5) segmentation errors that could not be corrected.
Statistical Analysis
Continuous and categorical data are presented as mean (95% confidence interval, CI) and count (%). The statistical significance of differences in patient characteristics across diagnosis is determined by ANOVA for continuous variables (with two-sample t-tests used for pairwise comparisons) and Fisher’s exact test for categorical variables. Eye characteristics are compared using linear mixed effects models, with random intercepts to account for within-subject variability. GCC thickness and macula vessel density trajectories were estimated using linear mixed effects models, with random eye-within-patient intercepts and independent random slopes-within-eye. These models include fixed effects for baseline age, QI, diagnosis group, time, and a diagnosis group and time interaction.
A forward-selection procedure was introduced for the inclusion of additional fixed covariates (mean IOP, CCT, axial length, race, as well as their interactions with time), though none were found to significantly improve the fit of the model or impact the estimates of GCC thinning and macula vessel density decrease. Despite the fact that GCC thickness and macula vessel density were measured simultaneously from the identical scan slab, the measurements differ in unit and range. In order to perform intra-group comparisons of GCC thickness and macula vessel density change rates, dynamic-range based normalized coefficients were estimated, as previously described.15 In brief, the dynamic range of certain measurement was estimated by calculating the top and bottom 3% of eyes. Percent of dynamic range change = [(visit value - floor value)/dynamic range] ×100/year. The unit of the normalized coefficients is %/year meaning annual percent change of the dynamic range. Comparisons of normalized slopes were conducted by fitting diagnosis stratified linear mixed effects models for both normalized thickness and vessel density. A fixed indicator effect was included for outcome, and then tested its interaction with time. Diagnosis stratified mixed models were also fit to investigate the interaction of time and baseline age, race, gender, mean IOP, MD, and scan quality on GCC thinning and macula vessel density decrease. Linear regression models were used to evaluate the association between change rates and glaucoma severity. Results were reported as R2 value.
Statistical analyses were performed using statistical software R 3.4.0 (R Foundation for Statistical Computing, Vienna, Austria) and Stata 14.2 (StataCorp LLC, College Station, TX). P values less than 0.05 were considered statistically significant.
Results
After initial review, 139 eyes of 94 individuals with good-quality images were included, consisting of 14 healthy subjects (23 eyes), 19 pre-perimetric glaucoma subjects (36 eyes) and 61 POAG subject (80 eyes). Moreover, ~ 35% of the macula scans were excluded due to poor quality. The segmentation had been manually corrected in ~5% of the included scans. Six eyes were subsequently excluded during consensus checking because of poor-quality OCT-A images (3) and development of retinopathy including geographic atrophy and epiretinal membrane (3). The mean follow-up time and number of visits were 2.0 years and 3.4 visits for healthy eyes, 2.6 years and 3.8 visits for pre-perimetric glaucoma eyes, and 2.6 years and 3.8 visits for POAG eyes, respectively. Table 1 summarized the baseline characteristics of the study subjects. At baseline, there was no significant difference among the groups in terms of gender, race, and self-reported history of diabetes or system hypertension. The groups differed by age, axial length, CCT, mean IOP during follow-up, baseline VF MD, baseline VF PSD, baseline cpRNFL thickness, baseline GCC thickness and macula vessel density. The healthy group was youngest (P<0.001) and had the shortest axial length (P=0.047). The pre-perimetric glaucoma group had the thinnest CCT (P=0.038) and highest mean IOP (P=0.045). Baseline VF MD, VF PSD, cpRNFL thickness, and GCC thickness/macula vessel density showed progressive worsening from healthy to pre-perimetric glaucoma to POAG. According to baseline VF MD in the POAG group, there were 61 (76.2%) eyes with mild glaucoma, 14 (17.5%) eyes with moderate glaucoma, and 5 (6.2%) eyes with advanced glaucoma. At the last visit, the VF MD and VF PSD for the three diagnostic groups were 0.45 (95% CI, −0.14, 1.04) dB and 1.60 (1.36, 1.84) dB in healthy, −0.76 (−1.36, −0.17) dB and 1.89 (1.71, 2.08) dB in pre-perimetric glaucoma, and −4.56 (−5.68, −3.47) dB and 5.28 (4.40, 6.15) dB in glaucoma.
Table 1.
Demographics and Ocular Characteristics of Study Population
| Healthy (N=14, Eye=23) | Pre-perimetric Glaucoma (N=19, Eye=36) | Glaucoma (N=61, Eye=80) | P value | |
|---|---|---|---|---|
| Sex (Male / Female) | 4 / 10 | 8 / 11 | 33/ 28 | 0.205 |
| Race | ||||
| African American | 7 (50.0%) | 2 (10.5%) | 15 (24.6%) | 0.0551 |
| Caucasian | 4 (28.6%) | 15 (78.9%) | 35 (57.4%) | |
| Other | 3 (21.4%) | 2 (10.5%) | 11 (18.0%) | |
| Self-reported history of Diabetes | 0 (0.0%) | 1 (5.3%) | 7 (11.5%) | 0.562 |
| Self-reported history of Hypertension | 7 (50.0%) | 10 (52.6%) | 33 (54.1%) | 1.000 |
| Systolic Blood Pressure (mmHg) | 118.6 (112.0, 125.3) | 128.5 (117.4, 139.5) | 127.0 (122.6, 131.4) | 0.0362 |
| Diastolic Blood Pressure (mmHg) | 78.6 (72.7, 84.5) | 82.9 (77.5, 88.3) | 79.9 (76.4, 83.4) | 0.690 |
| Mean Arterial Pressure (mmHg) | 91.9 (86.3, 97.6) | 98.1 (91.2, 105.0) | 95.6 (92.2, 99.0) | 0.250 |
| Baseline Age | 52.2 (46.4, 57.9) | 68.2 (65.8, 70.6) | 67.9 (65.5, 70.3) | <0.0011, 2 |
| Axial Length (mm) | 23.7 (23.1, 24.4) | 24.4 (24.1, 24.7) | 24.5 (24.2, 24.8) | 0.0472 |
| Central Corneal Thickness (μm) | 546.5 (526.5, 566.6) | 539.9 (530.6, 549.3) | 547.5 (538.9, 556.2) | 0.0383 |
| Mean IOP during follow-up (mmHg) | 13.8 (12.0, 15.6) | 16.3 (15.2, 17.4) | 15.3 (14.4, 16.1) | 0.0451 |
| Baseline Mean Deviation (dB) | 0.18 (−1.40, 1.76) | −0.81 (−1.96, 0.35) | −4.19 (−4.99, −3.39) | <0.0012, 3 |
| Glaucoma Severity | ||||
| Mild | 61 (76.2%) | |||
| Moderate | 14 (17.5%) | |||
| Advanced | 5 (6.2%) | |||
| Baseline PSD (dB) | 1.68 (0.27, 3.10) | 2.06 (1.04, 3.08) | 5.40 (4.69, 6.11) | <0.0012, 3 |
| Baseline cpRNFL thickness (μm) | 99.1 (91.7, 106.5) | 83.3 (78.4, 88.1) | 74.9 (71.4, 78.5) | <0.0011, 2, 3 |
| Baseline Vessel Density (%) | ||||
| Whole Image | 48.4 (46.4, 50.5) | 45.4 (44.0, 46.8) | 43.8 (42.8, 44.8) | <0.0011, 2 |
| Perifoveal | 51.0 (48.9, 53.1) | 48.0 (46.5, 49.5) | 46.5 (45.5, 47.6) | 0.0011, 2 |
| Baseline GCC Thickness (μm) | ||||
| Whole Image | 104.4 (98.7, 110.0) | 95.9 (92.1, 99.6) | 88.8 (86.1, 91.6) | <0.0011, 2, 3 |
| Perifoveal | 109.4 (103.3, 115.4) | 101.2 (97.1, 105.3) | 93.3 (90.3, 96.2) | <0.0011, 2, 3 |
IOP = intraocular pressure; PSD = pattern standard deviation; cpRNFL = circumpapillary retinal nerve fiber layer; GCC = ganglion cell complex.
Continuous data are shown as mean (95% confidence interval). Values with statistical significance are shown in bold.
Healthy vs. Pre-perimetric Glaucoma Significant;
Healthy vs. Glaucoma Significant;
Pre-perimetric Glaucoma vs. Glaucoma Significant.
Age and QI adjusted rates of GCC thickness and macula vessel density change are presented in Table 2. In all three diagnostic groups, age and QI adjusted change rates of both GCC thickness and macula vessel density were significantly different from zero (all P<0.05). GCC thinning rates showed significant difference between healthy group (wiGCC −0.70μm/year) and POAG group (wiGCC −1.18μm/year) (P= 0.045). However, the rate was not significantly different between healthy and pre-perimetric glaucoma nor between pre-perimetric glaucoma and POAG (all P≥ 0.1). In contrast, macula vessel density decrease rate of POAG group (wiVD −1.35%/year) was significantly faster than both pre-perimetric glaucoma group (wiVD −0.93%/year, P= 0.043) and healthy group (wiVD −0.76%/year, P= 0.042). Figure 1 shows the trajectories of GCC thinning and macula vessel density decrease through the three diagnostic groups.
Table 2.
Age and Scan Quality Adjusted Change Rates of Ganglion Cell Complex Thickness and Vessel Density in Healthy, Pre-perimetric Glaucoma and Primary Open Angle Glaucoma Eyes
| A. Healthy | B. Pre-perimetric Glaucoma | C. POAG | Pairwise Comparisons P Value# | |||
|---|---|---|---|---|---|---|
| Estimate (95% CI); P value* | Estimate (95% CI); P value* | Estimate (95% CI); P value* | A vs. B | B vs. C | A vs. C | |
| Ganglion Cell Complex Thickness Change Rate (μm / year) | ||||||
| Whole Image | −0.70 (−1.13, −0.27); 0.002 | −1.08 (−1.37, −0.79); <0.001 | −1.18 (−1.38, −0.99); <0.001 | 0.150 | 0.562 | 0.045 |
| Perifoveal | −0.65 (−1.07, −0.23); 0.003 | −1.08 (−1.37, −0.79); <0.001 | −1.11 (−1.31, −0.92); <0.001 | 0.100 | 0.848 | 0.051 |
| Vessel Density Change Rate (% / year) | ||||||
| Whole Image | −0.76 (−1.28, −0.25); 0.004 | −0.93 (−1.26, −0.59); <0.001 | −1.35 (−1.58, −1.11); <0.001 | 0.597 | 0.043 | 0.042 |
| Perifoveal | −0.66 (−1.22, −0.11); 0.021 | −0.75 (−1.12, −0.39); <0.001 | −1.19 (−1.44, −0.93); <0.001 | 0.791 | 0.056 | 0.095 |
POAG = primary open angle glaucoma; CI = confidence interval.
P value represents whether the mean rate of change is significantly different from zero;
P value represents whether the mean rate of change is significantly different between groups. Values with statistical significance are shown in bold.
Figure 1.
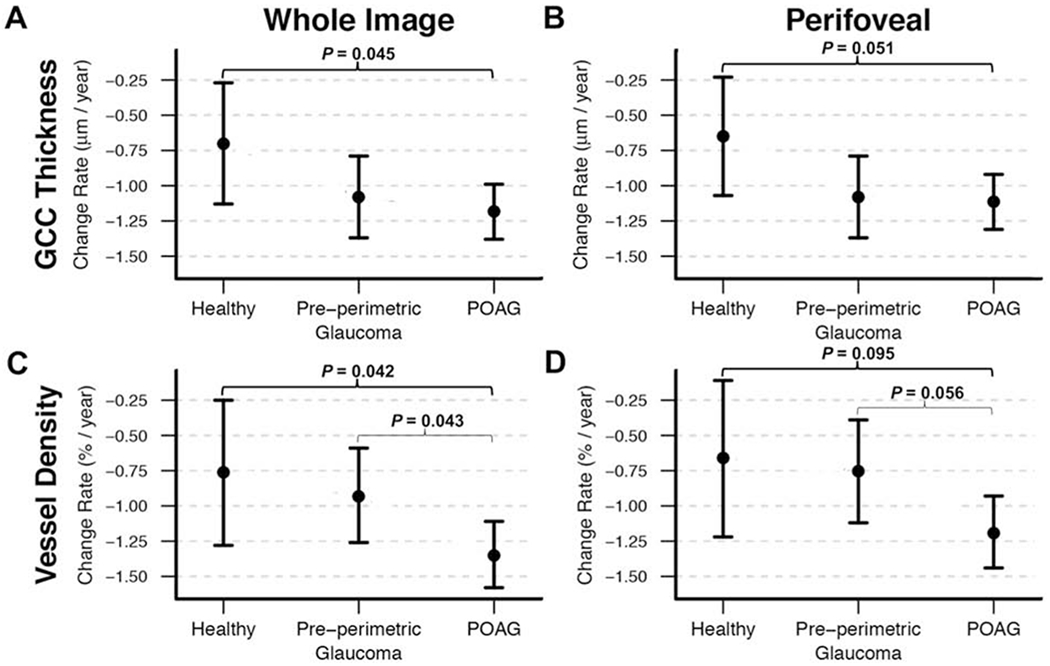
Age and scan quality adjusted change rates (mean is presented as dot, and 95% confidence intervals are presented as short line) of (A, B) ganglion cell complex thickness (GCC) and (C, D) vessel density in healthy, pre-perimetric glaucoma and primary open angle glaucoma (POAG) eyes. POAG eyes showed faster rates of both GCC thinning and vessel density loss comparing with healthy eyes, while only faster rate of vessel density loss comparing with pre-perimetric glaucoma eyes.
In order to directly compare GCC thinning rate with macula vessel density decrease rate, dynamic range based normalized coefficients were calculated. The dynamic ranges of wiVD, pfVD, wiGCC, and pfGCC were 18.6%, 19.3%, 49.8μm, and 54μm. The results of intra-group comparison of normalized age and QI adjusted change rates of GCC thickness and macula vessel density are presented in Tables 3. In the healthy group and pre-perimetric glaucoma group, there was no significant difference. However, in the POAG group, normalized macula vessel density decrease rates (wiVD, −7.12 %/year; pfVD, −5.99 %/year) were faster than normalized GCC thinning rates (wiGCC, −2.13 %/year; pfGCC, −1.87 %/year) (all P< 0.001). For the whole image and perifoveal region in the POAG group, 58 out of 80 (72.5%) eyes and 56 out of 80 (70%) eyes, respectively, showed faster macula vessel density decrease rate than GCC thinning rate. In general, the eyes with faster macula vessel density decrease had worse baseline MD (whole image, −4.48 (95%CI −5.67 to −3.28) vs. −3.52 (−5.08 to −1.95; perifoveal, −4.72 (−5.93 to −3.50) vs. −3.04 (−4.50 to −1.58)). All advanced glaucoma eyes (MD<−12 dB) had faster macula vessel density decrease comparing to GCC thinning. Figure 2 illustrates the wide distribution of the normalized rates of GCC thinning and macula vessel density decrease in whole image and perifoveal region in POAG group.
Table 3.
Normalized Age and Scan Quality Adjusted Rates of Change in Ganglion Cell Complex Thickness and Vessel Density in Healthy, Pre-perimetric Glaucoma, and Primary Open Angle Glaucoma Eyes
| Healthy | Pre-Perimetric Glaucoma | POAG | |
|---|---|---|---|
| Estimate (95% CI) | Estimate (95% CI) | Estimate (95% CI) | |
| Normalized Change Rates of Whole Image (%/year) | |||
| Vessel Density | −2.50 (−4.17,−0.84) | −3.85 (−6.04, −1.66) | −7.12 (−8.36, −5.88) |
| GCC Thickness | −1.53 (−3.10, 0.04) | −2.29 (−4.33, −0.25) | −2.13 (−3.35, −0.90) |
| P Value | 0.384 | 0.303 | <0.001 |
| Normalized Change Rates of Perifoveal (%/year) | |||
| Vessel Density | −1.62 (−3.38, 0.13) | −2.88 (−5.16, −0.60) | −5.99 (−7.23, −4.75) |
| GCC Thickness | −1.34 (−3.00, 0.32) | −2.08 (−4.21, 0.05) | −1.87 (−3.09, −0.65) |
| P Value | 0.811 | 0.612 | <0.001 |
POAG = primary open angle glaucoma; CI = confidence interval; GCC = ganglion cell complex.
Normalized rates are shown in %/year, annual percent change of dynamic range. Values with statistical significance are shown in bold.
Figure 2.
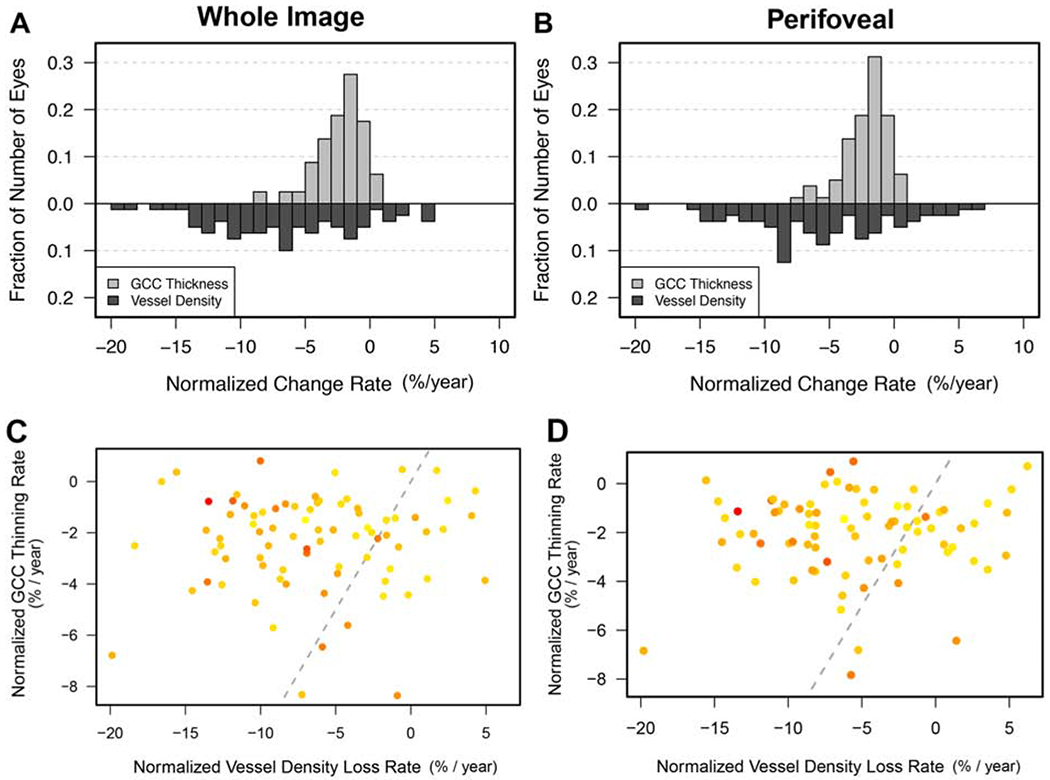
Bar graphs showing the distributions of the normalized change rates (%/year) of (A) whole image and (B) perifoveal ganglion cell complex (GCC) thickness and vessel density in primary open angle glaucoma (POAG) eyes. By average, normalized vessel density loss rates of whole image and perifoveal region were faster than corresponding normalized GCC thinning rates. Scatterplots showing most individual POAG eyes (dots in the left part of the rectangle) had faster (C) whole image and (D) perifoveal vessel density loss than GCC thinning. The gray line is a 1:1 line to separate where normalized slops would be equal. Dots in the left part show eyes had faster vessel density loss comparing with GCC thinning; while dots in the right part represent eyes with faster GCC thinning. The darker (redder) a dot is, the lower baseline visual field mean deviation this eye has. The unit of the normalized coefficients is %/year meaning annual percent change of the dynamic range.
Table 4 summarizes the effect of putative predictive factors on whole image GCC thinning and macula vessel density decrease overtime in the 3 diagnostic groups. GCC thickness and macula vessel density change rates could be affected by different factors. In POAG group, each higher 1dB baseline MD was associated with a 0.06%/year slower macula vessel density decrease (P= 0.037). In addition, better scan quality was associated with lower macula vessel density decrease rate (P= 0.017). The mean IOP significantly affected GCC thinning rate in all diagnostic groups (all P< 0.05); that is, each 1mmHg higher mean IOP was associated with 0.08-0.16 μm/year faster GCC thinning, but mean IOP was not associated with macula vessel density decrease rate. Analysis of perifoveal GCC thinning and macula vessel density decrease showed similar results.
Table 4.
Results of Univariable Models Assessing the Effect of Each Putative Predictive Factor on Change of Whole Image Ganglion Cell Complex Thickness and Vessel Density Over Time
| Healthy | Pre-perimetric Glaucoma | POAG | ||||
|---|---|---|---|---|---|---|
| GCC Thickness | Estimate (95% CI) | P Value | Estimate (95% CI) | P Value | Estimate (95% CI) | P Value |
| Baseline Age, per year older | −0.01 (−0.04, 0.01) | 0.318 | 0.02 (−0.01,0.05) | 0.257 | 0.01 (−0.01,0.02) | 0.478 |
| Race: Caucasian | −0.06 (−0.63, 0.50) | 0.829 | −0.29 (−1.12, 0.53) | 0.491 | 0.07 (−0.32, 0.46) | 0.718 |
| Gender: Male | −0.36 (−0.91,0.20) | 0.226 | 0.49 (−0.20, 1.18) | 0.172 | −0.14 (−0.52, 0.25) | 0.496 |
| Mean IOP, per 1mmHg higher | −0.10 (−0.20,−0.01) | 0.043 | −0.16 (−0.22,−0.09) | <0.001 | −0.08 (−0.15, −0.02) | 0.018 |
| MD, per 1dB better | −0.11 (−0.34,0.12) | 0.356 | 0.07 (−0.11,0.26) | 0.453 | 0.01 (−0.03, 0.06) | 0.586 |
| Overall QI, per 1 unit higher | 0.04 (−0.26, 0.35) | 0.778 | −0.03 (−0.23, 0.17) | 0.765 | −0.12 (−0.27,0.03) | 0.105 |
| Vessel Density | Estimate (95% CI) | P Value | Estimate (95% CI) | P Value | Estimate (95% CI) | P Value |
| Baseline Age, per year older | −0.00 (−0.03, 0.03) | 0.807 | −0.01 (−0.04, 0.02) | 0.662 | −0.01 (−0.03,0.01) | 0.416 |
| Race: Caucasian | −0.23 (−0.91,0.46) | 0.518 | 0.08 (−0.76, 0.93) | 0.846 | −0.32 (−0.82, 0.18) | 0.213 |
| Gender: Male | −0.09 (−0.81,0.62) | 0.800 | −0.03 (−0.80, 0.73) | 0.931 | −0.41 (−0.90, 0.09) | 0.110 |
| Mean IOP, per 1mmHg higher | 0.06 (−0.08, 0.20) | 0.375 | −0.05 (−0.14, 0.04) | 0.283 | 0.05 (−0.04, 0.14) | 0.285 |
| MD, per 1dB better | 0.16 (−0.14, 0.47) | 0.289 | 0.15 (−0.03, 0.34) | 0.116 | 0.06 (0.00,0.12) | 0.037 |
| Overall QI, per 1 unit higher | 0.05 (−0.37, 0.47) | 0.812 | 0.12 (−0.21,0.45) | 0.472 | 0.26 (0.05, 0.47) | 0.017 |
POAG = primary open angle glaucoma; GCC = ganglion cell complex; CI = confidence interval; IOP = intraocular pressure; MD = mean deviation; dB = decibels; QI = quality index.
Values with statistical significance are shown in bold.
Figure 3 illustrates the association between GCC thinning rates or macula vessel density decrease rates and glaucoma severity (VF MD). There was a positive association between macula vessel density decrease rate and baseline VF MD (whole image, P=0.074, perifoveal, P=0.014), but the GCC thinning rate was not associated with baseline glaucoma severity.
Figure 3.
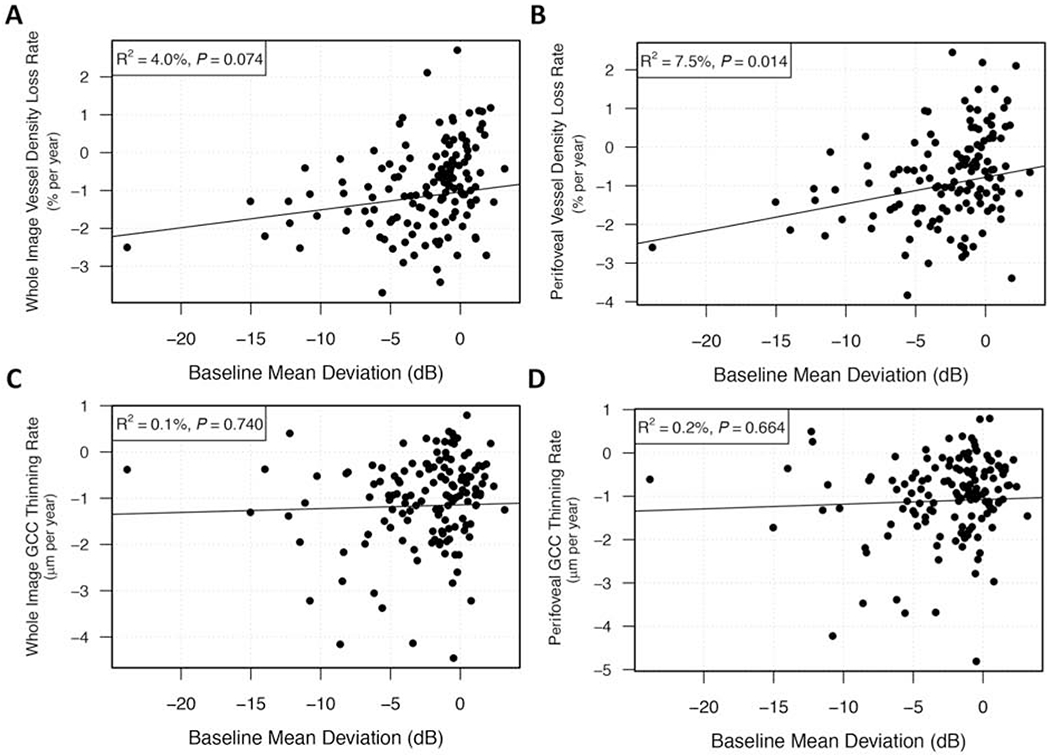
Scatterplots illustrating the linear association between change rates of (A, B) vessel density or (C, D) ganglion cell complex (GCC) thickness and baseline glaucoma severity in primary open angle glaucoma eyes. Vessel density loss rates were associated with baseline visual field mean deviation (MD), that is, the worse the baseline MD was the faster the vessel density lost, while GCC thinning rates showed no such association.
Figure 4 shows the measurements and trend analysis of a representative POAG patient with VF MD worsening in both eyes that shows continuous loss of macula vessel density, but relative stable GCC thickness during a 2.4 years follow-up.
Figure 4.
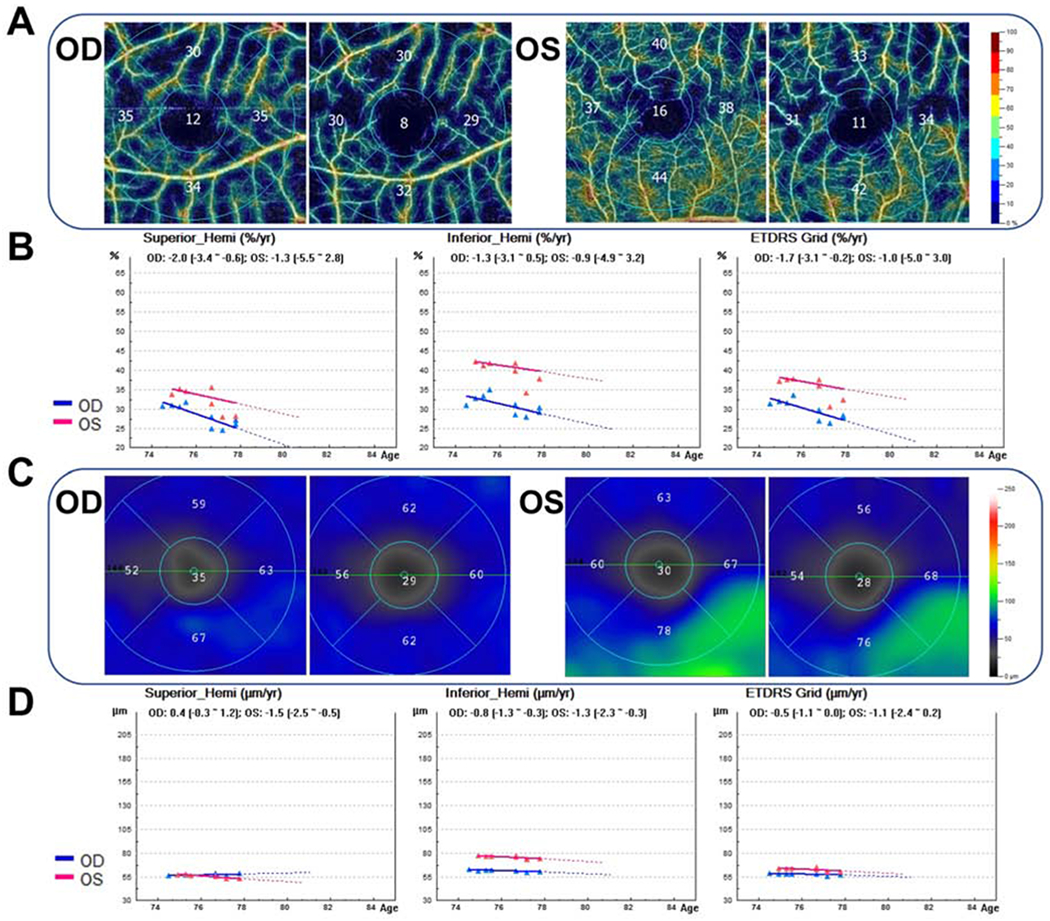
Case example of a 75-year old male with primary open angle glaucoma who was followed from January 2015 to May 2018. The baseline visual field mean deviation (MD) was −25.48 dB (right eye) and −13.10 dB (left eye), and the MD by the end of follow-up was −29.62 dB (right eye) and −14.47 dB (left eye). (A) OCT-A 3×3 mm2 macula superficial vessel density color-coded maps showing higher vessel density at the first visit (left) than the last visit (right); (B) OCT-A measurements trend analyses including regions of superior hemifield (Superior_Hemi), inferior hemifield (Infeirior_Hemi), and early treatment diabetic retinopathy study (ETDRS) grid all show trends of decreasing vessel density in both eyes; (C) ganglion cell complex (GCC) thickness maps showing similar GCC thickness at the first visit (left) with the last visit (right); (D) GCC thickness measurements trend analyses showing stable trends in all Superior_Hemi, Infeirior_Hemi, and ETDRS grid regions of both eyes. OD = right eye; OS = left eye.
Discussion
With a mean follow-up time of 2.0-2.6 years, both GCC thinning and macula vessel density decrease over time were detectable in healthy, pre-perimetric glaucoma, and POAG eyes. Macula vessel density decrease rates of POAG eyes were significantly faster than that of pre-perimetric glaucoma eyes and healthy eyes. Moreover, more than two thirds of the POAG eyes had faster macula vessel density decrease than GCC thinning. In POAG eyes, macula vessel density decrease rate was significantly associated with baseline glaucoma severity.
Although there have been many studies evaluating macula thickness change in glaucoma, only a few have focused on the macula microvasculature; most of these reported lower macula vessel density in glaucoma eyes.4,16–24 However, information is scarce regarding the change of macular microvasculature in healthy and glaucoma eyes overtime, and only 1 such longitudinal cohort study has been reported to date.9 In agreement with the previous study,9 the current study demonstrated progressive macula vessel density loss by OCT-A examination in POAG eyes. However, GCC thinning was not detectable in POAG eyes in the prior study. Moreover, neither GCC thinning nor macula vessel density decrease over time was significant in healthy and pre-perimetric glaucoma eyes. A possible reason for these earlier results might be related to the shorter follow-up time of the prior study (a mean of 13 months, with a minimum of 2 OCT-A visits).25 Inclusion of eyes with only 2 visits may increase the probability and degree of slope being affected by variability. Regardless, further studies are needed to elucidate the optimal minimum visits for monitoring progressive changes by OCT-A.
A previous study reported comparable damage of GCC thickness and macula vessel density in pre-perimetric glaucoma eyes, but greater damage of GCC thickness than macula vessel density in early glaucoma.16 In the current study, there was a trend of earlier GCC thinning compared to macula vessel density loss in pre-perimetric glaucoma eyes. Moreover, in POAG eyes, for each 1dB higher baseline MD, macula vessel density decrease rate was 0.05%/year slower, while GCC thinning rate was not correlated with MD. This is in agreement with previous reports that there was stronger correlation of OCT-A measurements with VF than OCT measurements.11,17,26,27 Considering these two aspects, our results support that GCC damage could be greater in early glaucoma, although macula vessel density decrease was faster overall than GCC thinning. These results support the previous hypothesis that the rates of GCC thinning and macula vessel density decrease differ across different stages of the glaucoma continuum.16 By evaluating change rates in POAG eyes with different glaucoma severity, the slowest rate of GCC thinning was observed in advanced glaucoma eyes. In contrast, the slowest rate of macula vessel density decrease was observed in mild glaucoma eyes (results not shown). However, considering the relatively small sample size of moderate glaucoma eyes (14 eyes) and advanced glaucoma eyes (5 eyes) in the current study, additional study is needed. On the other hand, most POAG eyes, particularly advanced cases, showed faster macula vessel density decrease than GCC thinning; and, in contrast to GCC thinning rate, there was significant correlation between macula vessel density decrease rate and glaucoma severity, indicating OCT-A could be a promising tool for monitoring glaucoma progression, particularly for patients with advanced disease. This is consistent with a previous study28 showing OCT-A measurement does not have a detectable floor in the glaucoma continuum, while GCC thickness reached the estimated floor at late stage.
It has been hypothesized that glaucomatous damage is a consequence of insufficient blood supply due to either increased IOP or other risk factors reducing ocular blood flow.29 However, emerging evidence has challenged the effect of IOP on vessel density loss in POAG. Increased IOP was found unrelated with reduction of circumpapillary vascular density30; and pretreatment IOP did not affect the diagnostic ability of peripapillary and macula vessel density.31 Consistent with a prior longitudinal study,9 IOP was not correlated with macula vessel density decrease rates in the current study, while GCC thinning rates showed significant association with IOP in each of the three diagnostic groups. This supports that the macula vessel density change in POAG may be less IOP-independent,31 and OCT-A measurements might be useful for evaluating glaucoma progression caused by factors other than high IOP.
Although it has been reported that some topical ocular hypotensive medications may affect retinal vascular autoregulation and ocular blood flow,32,33 the current study showed no correlation between use of the eye drops with macula vessel density measurements.34 Nevertheless, since the healthy group was free of topical glaucoma medications, one cannot entirely exclude the possibility that the ocular hypotensive drops could somehow affect the study results. It also should be noted that 3×3 mm2 scans were used in the current study. A larger 6×6 mm2 scan is now available, however longitudinal data are not yet available. It has been reported that 6×6 mm2 macula scans show higher diagnostic accuracy compared to 3×3 mm2 scans for differentiating between healthy and glaucoma eyes,4 and, it is possible that the larger field has more information about the posterior pole vascular changes and will better show the changes in different regions comparing to the 3×3 mm2 scan.35,36 Although the rates of GCC thinning and macula vessel density decrease of different stages of disease severity could not be determined due to the limited sample size of moderate (14) and advanced (5) glaucoma eyes , there was a significant association between VF MD and macula vessel density decrease rate. The groups were not matched based on any character or parameter. Several potential confounding factors that might affect rates of GCC thinning or macula vessel density decrease have been taken into account. Age and scan quality were adjusted in comparisons among the groups. Other potential confounders including axial length and CCT were evaluated, and none of them was found significantly impact GCC thinning and macula vessel density decrease. However, we cannot exclude the potential contribution of differences in characteristics among the three diagnostic groups to the current results.
In conclusion, both GCC thinning and macula vessel density loss were detectable in healthy, pre-perimetric glaucoma, and POAG eyes overtime. Most POAG eyes had faster macula vessel density decrease than GCC thinning, and macula vessel density decrease rate was associated with glaucoma severity. These results suggest that OCT-A is useful for evaluating glaucoma progression, particularly in POAG patients with severe disease.
Acknowledgments
Financial Support:
National Institutes of Health/National Eye Institute Grants EY029058, EY11008, EY027510, and EY026574, Core Grant P30EY022589, an unrestricted grant from Research to Prevent Blindness (New York, NY), and participant retention incentive grants in the form of glaucoma medication at no cost from Novartis/Alcon Laboratories Inc, Allergan, Akorn, and Pfizer Inc.
Commercial Disclosures:
1. Huiyuan Hou: none
2. Sasan Moghimi: none
3. James A. Proudfoot: none
4. Elham Ghahari: none
5. Rafaella C. Penteado: none
6. Christopher Bowd: none
7. Diya Yang: none
8. Robert N. Weinreb: Financial support- National Eye Institute, Carl Zeiss Meditec, Centervue, Heidelberg Engineering, Konan, Optovue, Bausch & Lomb; Consultant-Aerie Pharmaceuticals, Allergan, Eyenovia, Unity Biosciences; Patent- Toromedes, Carl Zeiss Meditec
Footnotes
Publisher's Disclaimer: This is a PDF file of an unedited manuscript that has been accepted for publication. As a service to our customers we are providing this early version of the manuscript. The manuscript will undergo copyediting, typesetting, and review of the resulting proof before it is published in its final form. Please note that during the production process errors may be discovered which could affect the content, and all legal disclaimers that apply to the journal pertain.
Meeting Presentation: Presented in part at the annual meeting of the Association for Research in Vision and Ophthalmology, 2019
References
- 1.Yarmohammadi A, Zangwill LM, Diniz-Filho A, et al. Optical Coherence Tomography Angiography Vessel Density in Healthy, Glaucoma Suspect, and Glaucoma Eyes. Invest Ophthalmol Vis Sci 2016;57(9):OCT451–9. [DOI] [PMC free article] [PubMed] [Google Scholar]
- 2.Yarmohammadi A, Zangwill LM, Diniz-Filho A, et al. Peripapillary and Macular Vessel Density in Patients with Glaucoma and Single-Hemifield Visual Field Defect. Ophthalmology 2017; 124(5):709–19. [DOI] [PMC free article] [PubMed] [Google Scholar]
- 3.Manalastas PIC, Zangwill LM, Saunders LJ, et al. Reproducibility of Optical Coherence Tomography Angiography Macular and Optic Nerve Head Vascular Density in Glaucoma and Healthy Eyes. J Glaucoma 2017;26(10):851–9. [DOI] [PMC free article] [PubMed] [Google Scholar]
- 4.Takusagawa HL, Liu L, Ma KN, et al. Projection-Resolved Optical Coherence Tomography Angiography of Macular Retinal Circulation in Glaucoma. Ophthalmology 2017;124(11):1589–99. [DOI] [PMC free article] [PubMed] [Google Scholar]
- 5.Lei J, Pei C, Wen C, Abdelfattah NS. Repeatability and Reproducibility of Quantification of Superficial Peri-papillary Capillaries by four Different Optical Coherence Tomography Angiography Devices. Sci Rep 2018;8(1):17866. [DOI] [PMC free article] [PubMed] [Google Scholar]
- 6.Venugopal JP, Rao HL, Weinreb RN, et al. Repeatability of vessel density measurements of optical coherence tomography angiography in normal and glaucoma eyes. Br J Ophthalmol 2018;102(3):352–7. [DOI] [PubMed] [Google Scholar]
- 7.Hollo G Comparison of Peripapillary OCT Angiography Vessel Density and Retinal Nerve Fiber Layer Thickness Measurements for Their Ability to Detect Progression in Glaucoma. J Glaucoma 2018;27(3):302–5. [DOI] [PubMed] [Google Scholar]
- 8.Hollo G Influence of Removing the Large Retinal Vessels-related Effect on Peripapillary Vessel Density Progression Analysis in Glaucoma. J Glaucoma 2018;27(8):e137–e9. [DOI] [PubMed] [Google Scholar]
- 9.Shoji T, Zangwill LM, Akagi T, et al. Progressive Macula Vessel Density Loss in Primary Open-Angle Glaucoma: A Longitudinal Study. Am J Ophthalmol 2017;182:107–17. [DOI] [PMC free article] [PubMed] [Google Scholar]
- 10.Sample PA, Girkin CA, Zangwill LM, et al. The African Descent and Glaucoma Evaluation Study (ADAGES): design and baseline data. Arch Ophthalmol 2009; 127(9):1136–45. [DOI] [PMC free article] [PubMed] [Google Scholar]
- 11.Yarmohammadi A, Zangwill LM, Diniz-Filho A, et al. Relationship between Optical Coherence Tomography Angiography Vessel Density and Severity of Visual Field Loss in Glaucoma. Ophthalmology 2016;123(12):2498–508. [DOI] [PMC free article] [PubMed] [Google Scholar]
- 12.Yarmohammadi A, Zangwill LM, Manalastas PIC, et al. Peripapillary and Macular Vessel Density in Patients with Primary Open-Angle Glaucoma and Unilateral Visual Field Loss. Ophthalmology 2017;125(4):578–87. [DOI] [PMC free article] [PubMed] [Google Scholar]
- 13.Hodapp E, Parish IIRK, Anderson DR. Clinical Decisions in Glaucoma. St Louis, MO: Mosby; 1993:52–61. [Google Scholar]
- 14.Suh MH, Zangwill LM, Manalastas PI, et al. Optical Coherence Tomography Angiography Vessel Density in Glaucomatous Eyes with Focal Lamina Cribrosa Defects. Ophthalmology 2016; 123(11):2309–17. [DOI] [PMC free article] [PubMed] [Google Scholar]
- 15.Hammel N, Belghith A, Weinreb RN, et al. Comparing the Rates of Retinal Nerve Fiber Layer and Ganglion Cell-Inner Plexiform Layer Loss in Healthy Eyes and in Glaucoma Eyes. Am J Ophthalmol 2017;178:38–50. [DOI] [PubMed] [Google Scholar]
- 16.Hou H, Moghimi S, Zangwill LM, et al. Macula Vessel Density and Thickness in Early Primary Open-Angle Glaucoma. Am J Ophthalmol 2019;199:120–32. [DOI] [PMC free article] [PubMed] [Google Scholar]
- 17.Chen HS, Liu CH, Wu WC, et al. Optical Coherence Tomography Angiography of the Superficial Microvasculature in the Macular and Peripapillary Areas in Glaucomatous and Healthy Eyes. Invest Ophthalmol Vis Sci 2017;58(9):3637–45. [DOI] [PubMed] [Google Scholar]
- 18.Choi J, Kwon J, Shin JW, et al. Quantitative optical coherence tomography angiography of macular vascular structure and foveal avascular zone in glaucoma. PLoS One 2017;12(9):e0184948. [DOI] [PMC free article] [PubMed] [Google Scholar]
- 19.Kurysheva NI, Maslova EV, Trubilina AV, et al. Macular blood flow in glaucoma. Vestn Oftalmol 2017;133(2):29–38. [DOI] [PubMed] [Google Scholar]
- 20.Rao HL, Pradhan ZS, Weinreb RN, et al. A comparison of the diagnostic ability of vessel density and structural measurements of optical coherence tomography in primary open angle glaucoma. PLoS One 2017;12(3):e0173930. [DOI] [PMC free article] [PubMed] [Google Scholar]
- 21.Alnawaiseh M, Lahme L, Muller V, et al. Correlation of flow density, as measured using optical coherence tomography angiography, with structural and functional parameters in glaucoma patients. Graefes Arch Clin Exp Ophthalmol 2018;256(3):589–97. [DOI] [PubMed] [Google Scholar]
- 22.Xu H, Yu J, Kong X, et al. Macular microvasculature alterations in patients with primary open-angle glaucoma: A cross-sectional study. Medicine (Baltimore) 2016;95(33):e4341. [DOI] [PMC free article] [PubMed] [Google Scholar]
- 23.Triolo G, Rabiolo A, Shemonski ND, et al. Optical Coherence Tomography Angiography Macular and Peripapillary Vessel Perfusion Density in Healthy Subjects, Glaucoma Suspects, and Glaucoma Patients. Invest Ophthalmol Vis Sci 2017;58(13):5713–22. [DOI] [PubMed] [Google Scholar]
- 24.Penteado RC, Zangwill LM, Daga FB, et al. Optical Coherence Tomography Angiography Macular Vascular Density Measurements and the Central 10-2 Visual Field in Glaucoma. J Glaucoma 2018;27(6):481–9. [DOI] [PMC free article] [PubMed] [Google Scholar]
- 25.Van Melkebeke L, Barbosa-Breda J, Huygens M, Stalmans I. Optical Coherence Tomography Angiography in Glaucoma: A Review. Ophthalmic Res 2018;60(3):139–51. [DOI] [PubMed] [Google Scholar]
- 26.Shin JW, Lee J, Kwon J, et al. Regional vascular density-visual field sensitivity relationship in glaucoma according to disease severity. Br J Ophthalmol 2017;101 (12):1666–72. [DOI] [PubMed] [Google Scholar]
- 27.Jia Y, Wei E, Wang X, et al. Optical coherence tomography angiography of optic disc perfusion in glaucoma. Ophthalmology 2014;121 (7):1322–32. [DOI] [PMC free article] [PubMed] [Google Scholar]
- 28.Moghimi S, Bowd C, Zangwill LM, et al. Measurement Floors and Dynamic Ranges of OCT and OCT Angiography in Glaucoma. Ophthalmology 2019. [DOI] [PMC free article] [PubMed] [Google Scholar]
- 29.Flammer J, Orgul S, Costa VP, et al. The impact of ocular blood flow in glaucoma. Prog Retin Eye Res 2002;21(4):359–93. [DOI] [PubMed] [Google Scholar]
- 30.Jo YH, Sung KR, Yun SC. The Relationship Between Peripapillary Vascular Density and Visual Field Sensitivity in Primary Open-Angle and Angle-Closure Glaucoma. Invest Ophthalmol Vis Sci 2018;59(15):5862–7. [DOI] [PubMed] [Google Scholar]
- 31.Rao HL, Pradhan ZS, Weinreb RN, et al. Regional Comparisons of Optical Coherence Tomography Angiography Vessel Density in Primary Open-Angle Glaucoma. Am J Ophthalmol 2016;171:75–83. [DOI] [PubMed] [Google Scholar]
- 32.Feke GT, Bex PJ, Taylor CP, et al. Effect of brimonidine on retinal vascular autoregulation and short-term visual function in normal tension glaucoma. Am J Ophthalmol 2014;158(1):105–12 e1. [DOI] [PMC free article] [PubMed] [Google Scholar]
- 33.Siesky B, Harris A, Brizendine E, et al. Literature review and meta-analysis of topical carbonic anhydrase inhibitors and ocular blood flow. Surv Ophthalmol 2009;54(1):33–46. [DOI] [PubMed] [Google Scholar]
- 34.Akil H, Huang AS, Francis BA, et al. Retinal vessel density from optical coherence tomography angiography to differentiate early glaucoma, pre-perimetric glaucoma and normal eyes. PLoS One 2017;12(2):e0170476. [DOI] [PMC free article] [PubMed] [Google Scholar]
- 35.Hood DC, Raza AS, de Moraes CG, et al. Glaucomatous damage of the macula. Prog Retin Eye Res 2013;32:1–21. [DOI] [PMC free article] [PubMed] [Google Scholar]
- 36.Hood DC. Improving our understanding, and detection, of glaucomatous damage: An approach based upon optical coherence tomography (OCT). Prog Retin Eye Res 2017;57:46–75. [DOI] [PMC free article] [PubMed] [Google Scholar]