Significance
Neuropeptide Y (NPY) is implicated in many pathological conditions including obesity, diabetes, and insulin resistance. However, a pathogenic role of NPY in kidney disease has not been described. We found that NPY is produced by the podocyte in the glomerulus, and this production decreases in renal disease, in contrast to an increase in circulating NPY levels. In the glomerulus, NPY signals via the NPY receptor 2 (NPY2R) and modulates PI3K, MAPK, and NFAT signaling, along with RNA processing and cell migration and, if prolonged, predicted nephrotoxicity. The pharmacological inhibition of NPY-NPY2R signaling also protected against albuminuria and kidney disease in a mouse model of glomerulosclerosis, suggesting that inhibiting this pathway may be therapeutically beneficial in the prevention of kidney disease.
Abstract
Albuminuria is an independent risk factor for the progression to end-stage kidney failure, cardiovascular morbidity, and premature death. As such, discovering signaling pathways that modulate albuminuria is desirable. Here, we studied the transcriptomes of podocytes, key cells in the prevention of albuminuria, under diabetic conditions. We found that Neuropeptide Y (NPY) was significantly down-regulated in insulin-resistant vs. insulin-sensitive mouse podocytes and in human glomeruli of patients with early and late-stage diabetic nephropathy, as well as other nondiabetic glomerular diseases. This contrasts with the increased plasma and urinary levels of NPY that are observed in such conditions. Studying NPY-knockout mice, we found that NPY deficiency in vivo surprisingly reduced the level of albuminuria and podocyte injury in models of both diabetic and nondiabetic kidney disease. In vitro, podocyte NPY signaling occurred via the NPY2 receptor (NPY2R), stimulating PI3K, MAPK, and NFAT activation. Additional unbiased proteomic analysis revealed that glomerular NPY-NPY2R signaling predicted nephrotoxicity, modulated RNA processing, and inhibited cell migration. Furthermore, pharmacologically inhibiting the NPY2R in vivo significantly reduced albuminuria in adriamycin-treated glomerulosclerotic mice. Our findings suggest a pathogenic role of excessive NPY-NPY2R signaling in the glomerulus and that inhibiting NPY-NPY2R signaling in albuminuric kidney disease has therapeutic potential.
Chronic kidney disease (CKD) is a major global healthcare concern, affecting over 10% of the general population, and frequently occurs secondary to other systemic disorders including diabetes, obesity, hypertension, and the metabolic syndrome. A common early hallmark of CKD is albuminuria, which not only reflects damage to the glomerular filtration barrier (GFB) in the kidney but also is an important independent risk factor for the progression to end-stage renal failure and cardiovascular disease (1–3). Thus, strategies to prevent albuminuria have important therapeutic potential, particularly in the early stages of CKD progression.
Podocytes are highly specialized epithelial cells of the glomerulus, lining the urinary side of the filtration barrier. Owing to their complex, dynamic structures and their ability to secrete (and adapt to) a number of growth factors, these cells have a central role in filtration barrier maintenance (4). As such, podocyte damage is a key driver of albuminuria and glomerular disease in numerous settings and occurs early in the pathogenesis of many albuminuric conditions (5–9).
While it is well-established that podocyte damage is a major cause of albuminuria (8), the pathways and molecules involved in podocyte injury are incompletely understood. We (10, 11) and others (12, 13) have highlighted the importance of podocyte insulin responses in maintaining glomerular function, and it is now evident that circulating factors associated with common systemic disorders, including diabetes, obesity, and the metabolic syndrome, can directly induce podocyte insulin resistance (14–17) and associated damage (15, 18). In this study, we analyzed the transcriptomes of insulin-sensitive and insulin-resistant podocytes with the aim of identifying molecules that are differentially regulated in podocyte damage, which may play a role in albuminuric kidney disease. This unbiased transcriptome analysis revealed that Neuropeptide Y (Npy) was the most highly down-regulated transcript in insulin-resistant vs. insulin-sensitive podocytes. Analysis of patient cohorts also revealed a significant reduction in glomerular NPY expression in both early and late-stage diabetic nephropathy (DN), as well as in several other human albuminuric conditions. This contrasts with the increased plasma and urinary levels of NPY that are observed in diabetes and CKD (19–22). This prompted us to further investigate the potential role of NPY (and NPY signaling) in the podocyte and glomerulus.
Results
Npy Expression Is Reduced in Diabetic, Insulin-Resistant Podocytes and Glomeruli.
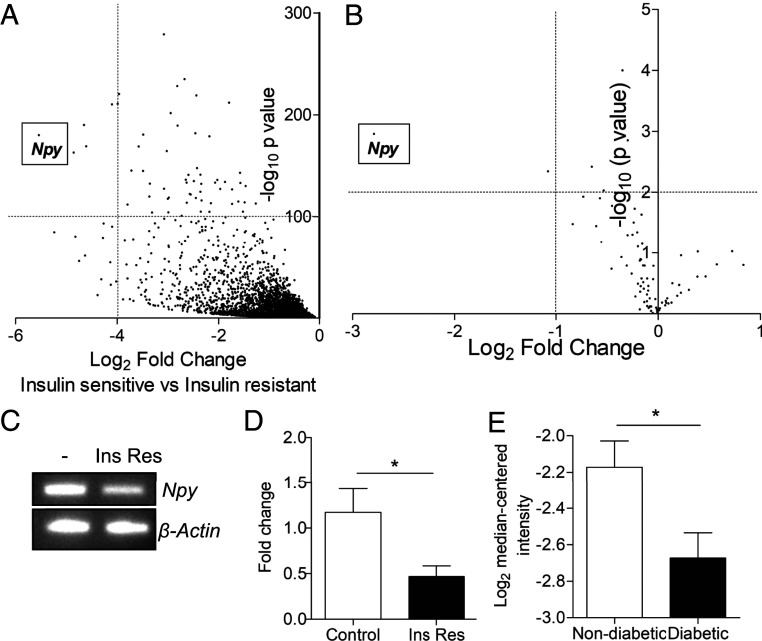
To explore factors associated with podocyte injury, we initially performed nonbiased RNA sequencing of highly insulin-sensitive mouse podocytes [with stable insulin receptor expression (14)] and insulin-resistant mouse podocytes [with insulin resistance induced via exposure to a combination of inflammatory cytokines, high insulin, and high glucose, as previously reported (14)]. Of over 23,000 transcripts, Npy was the most highly down-regulated in the insulin-resistant cells (46.53-fold reduction, P < 5.22 × 10−181), in comparison with highly insulin-sensitive podocytes (Fig. 1A and SI Appendix, Fig. S1). A significant reduction in Npy was also observed in RNA sequencing of control mouse podocytes (insulin-sensitive, without stable insulin receptor expression), when compared to the insulin-resistant cells (5.56-fold reduction, P < 3.06 × 10⁻³³, SI Appendix, Fig. S1). We also performed focused insulin-signaling qPCR arrays on podocytes exposed to the inflammatory cytokines TNF-α and IL-6, which become insulin-resistant with respect to glucose uptake (SI Appendix, Fig. S2). Results from these arrays also revealed that Npy was again the most significantly down-regulated transcript of 84 genes related to insulin signaling (Fig. 1B and SI Appendix, Fig. S1). This reduction in Npy expression was further confirmed in our insulin-resistant podocyte model using end-point PCR (Fig. 1C) and qPCR (Fig. 1D). Analyzing data from the large kidney transcriptomics database Nephroseq, we also found a significant reduction in Npy expression in the glomeruli of diabetic mice (Fig. 1E).
Fig. 1.
Npy mRNA is significantly down-regulated in insulin-resistant podocytes and diabetic mouse glomeruli. (A) Genes down-regulated in insulin-resistant, compared with insulin-sensitive, mouse podocytes (podocytes exposed to 1 ng/mL TNFα, 1 ng/mL IL-6, 100 nmol/L insulin, and 25 mmol/L glucose or stably expressing the insulin receptor, respectively) identified by RNA sequencing. (B) Results of focused insulin signaling qPCR arrays performed on podocytes treated with 1 ng/mL TNF-α and IL-6, demonstrating a significant reduction in Npy expression following cytokine treatment; n = 3. (C) RT-PCR and (D) qPCR results confirming a reduction in Npy in insulin-resistant podocytes in vitro (Ins Res, following exposure to 1 ng/mL TNFα, 1 ng/mL IL-6, 100 nmol/L insulin, and 25 mmol/L glucose) (n = 5). *P < 0.05. (E) Data from Nephroseq. Npy expression (log2 median-centered intensity) in the Hodgin Diabetes Mouse Glom dataset sorted by fasting blood glucose: nondiabetic, defined as <300 mg/dL (n = 23) vs. diabetic, defined as >300 mg/dL (n = 16); under-expression gene rank 2,840 (in top 20%). *P < 0.05.
Modulation of Glomerular NPY Expression in Human Disease.
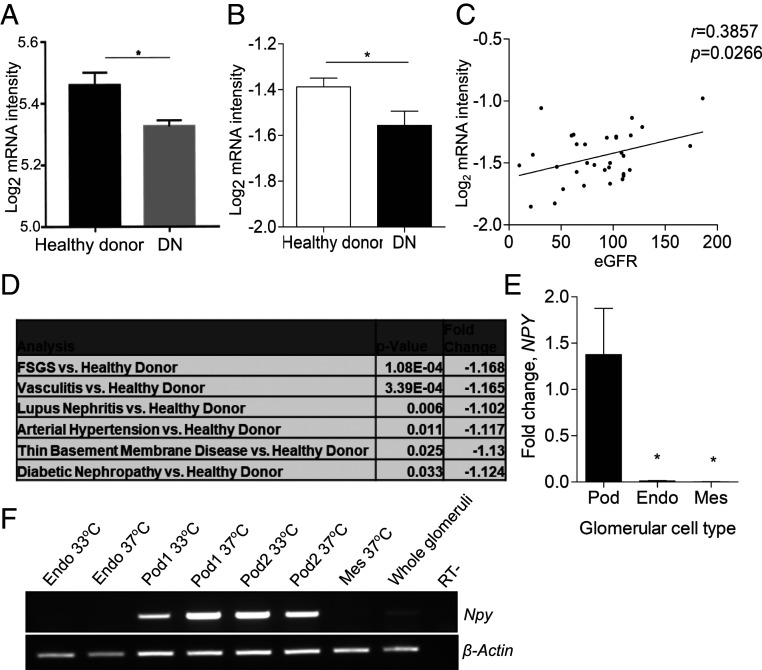
To evaluate whether NPY expression was reduced during the development of human diabetic kidney disease, we studied glomerular NPY expression in both early and late-stage DN patient cohorts (Pima diabetic patients and the Nephroseq “Ju CKD Glom” dataset, respectively) (23, 24). A significant reduction in NPY expression was observed in the glomeruli of patients with both early (Fig. 2A) and advanced type 2 DN (Fig. 2B), when compared with nondiabetic, healthy living donors. In the advanced DN patient group, we found a significant correlation between the level of glomerular NPY expression and estimated glomerular filtration rate (eGFR) (Fig. 2C). Further analysis of the Ju CKD Glom dataset revealed that glomerular NPY expression was significantly reduced in several renal diseases, including focal segmental glomerulosclerosis (FSGS), vasculitis, lupus nephritis, hypertension, and thin membrane disease (Fig. 2D). Of the three human glomerular cell types (podocytes, mesangial cells, and glomerular endothelial cells), NPY was exclusively expressed in podocytes (Fig. 2 E and F), although this expression was much lower than that seen in neuronal-derived cell lines or the adrenal gland (SI Appendix, Fig. S3).
Fig. 2.
Glomerular NPY expression is significantly down-regulated in human renal disease. (A) NPY expression (log2 mRNA intensity) in Pima early diabetic nephropathy (DN, n = 69) vs. healthy living donors (n = 18). *P < 0.05. (B) Data from Nephroseq: NPY expression (log2 median-centered intensity) in the Ju CKD Glom dataset: healthy living donor (n = 21) and DN (n = 12); under-expression gene rank 3,211 (in top 19%). *P < 0.05. (C) Correlation between glomerular NPY expression (log2 median-centered intensity) and eGFR in the Ju CKD Glom dataset: healthy living donors and diabetic nephropathy, n = 33. (D) NPY expression (log2 median-centered mRNA intensity) in Ju CKD Glom, showing a significant regulation in glomerular NPY in FSGS (n = 46), vasculitis (n = 44), lupus nephritis (n = 53), arterial hypertension (n = 36), and thin basement membrane disease (n = 24) vs. healthy living donors. (E) qPCR results showing relative levels of NPY expression in human glomerular cell lines (Pod, podocytes; Endo, glomerular endothelial cells; Mes, mesangial cells); n = 3 to 5; *P < 0.05. (F) RT-PCR for NPY and β-Actin in human glomerular cell lines under conditions of active (33 °C) and inactive (37 °C) SV40 expression (Endo, glomerular endothelial cells; Pod1 and Pod2, two independent human podocyte cell lines; Mes, mesangial cells) and isolated human glomeruli.
NPY−/− Mice Have No Apparent Renal Phenotype under Basal Conditions.
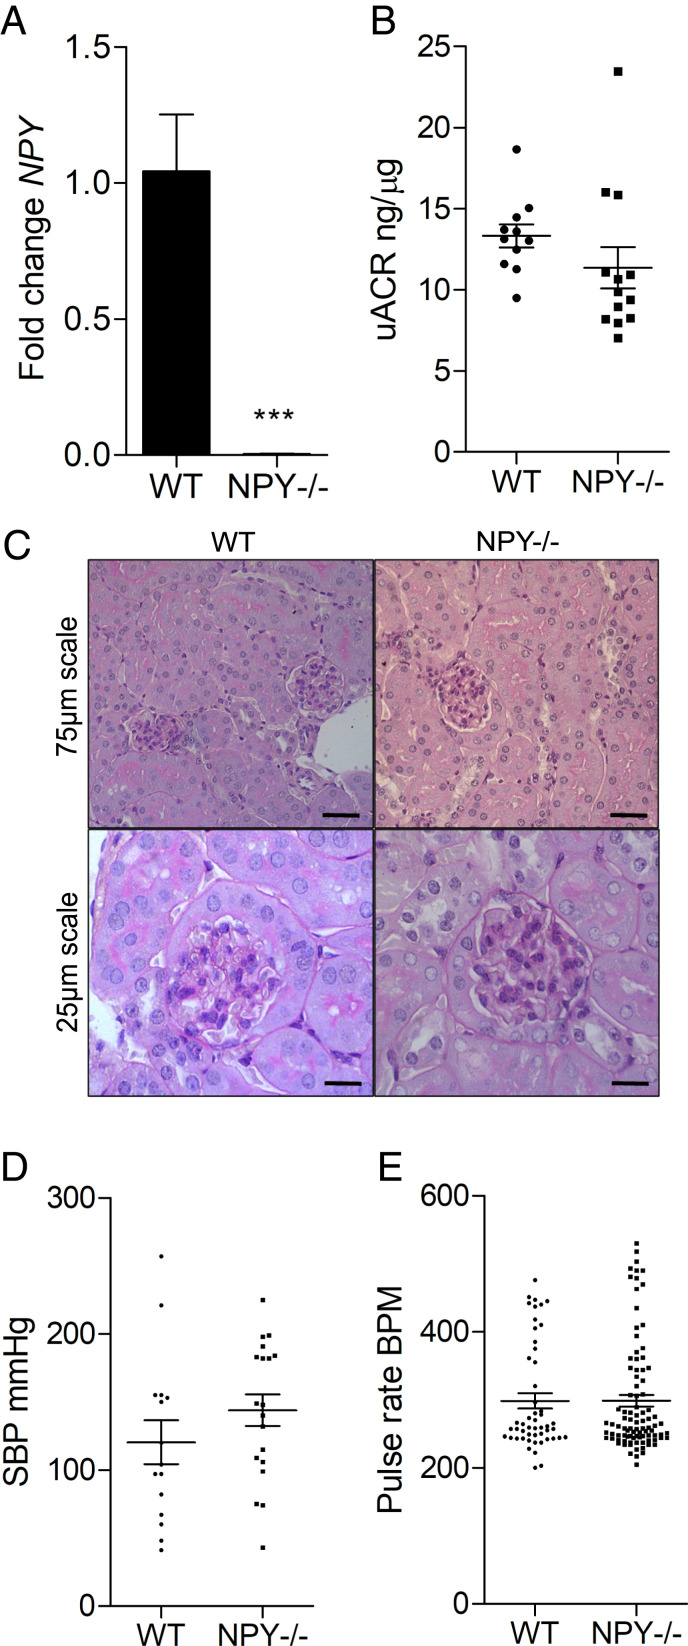
To investigate the consequences of reduced glomerular NPY expression on the development of albuminuria and podocyte damage in vivo, we studied NPY knockout (NPY−/−) mice on a nephropathy-prone 129Sv/Ev background. These mice maintain normal body weight and glucose and insulin levels under basal conditions (25). When we compared NPY−/− to age- and sex-matched wild-type (WT) control animals, despite undetectable Npy levels in NPY−/− mice (Fig. 3A), we observed no significant differences in the degree of albuminuria (Fig. 3B) or renal histology (Fig. 3C) under basal conditions. Importantly, as NPY has important cardiovascular roles (26–30), we did not detect any differences in baseline blood pressure parameters (systolic blood pressure [SBP] and pulse rate in beats per minute) between the WT and NPY−/− mice (Fig. 3 D and E).
Fig. 3.
Glomerular structure and function is normal in NPY−/− mice under basal conditions. (A) No detection of Npy transcript in kidneys from NPY−/− mice, compared with WT control kidney tissue, using qPCR; n = 3 per group. ***P < 0.001. (B) uACRs in WT (n = 11) and NPY−/− mice (n = 13). (C) Periodic acid–Schiff (PAS) staining of kidney tissue from WT and NPY−/− mice at 4 mo of age confirmed no significant histological abnormalities in these animals (n = 4 per group). (D) SBP measurements and (E) pulse rate (beats per minute, BPM) in WT (n = 3) and NPY−/− (n = 4) mice, 5 to 10 inflation cycles per mouse.
Diabetic NPY-Deficient Mice Are Protected from Albuminuria and Podocyte Damage.
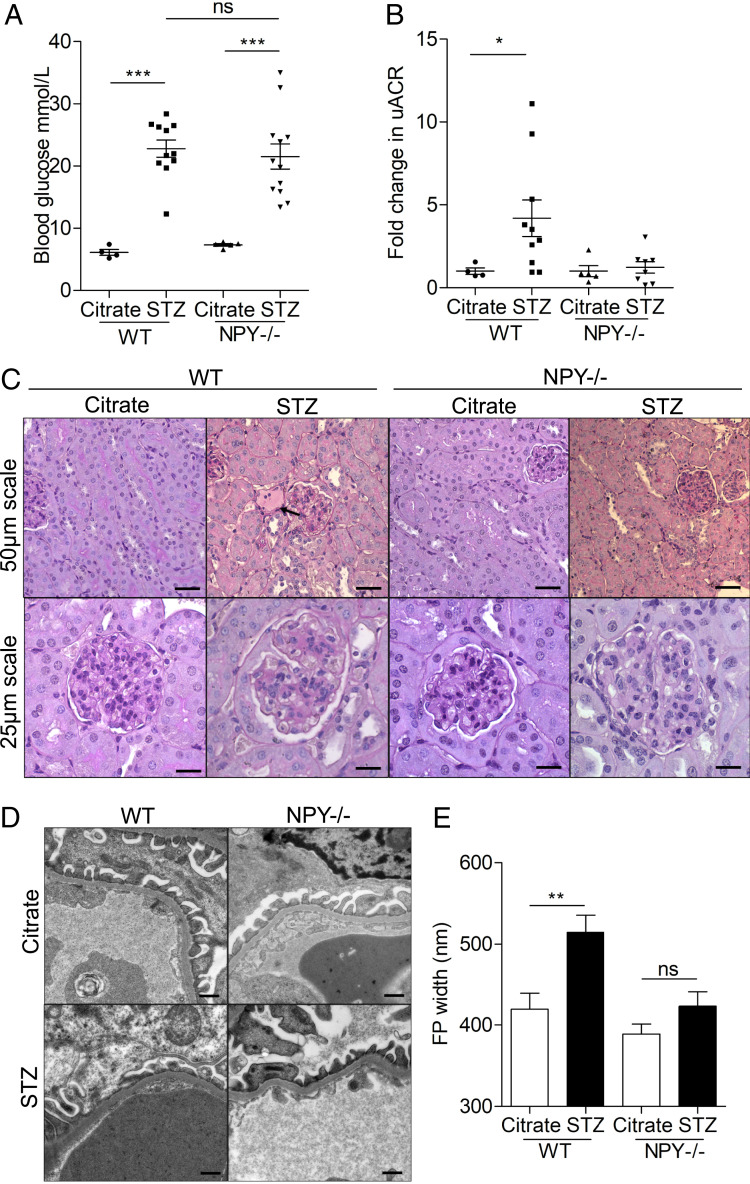
To explore the effect of NPY deficiency on the development of diabetic nephropathy, we compared the extent of albuminuria and glomerular damage in streptozotocin (STZ)-induced diabetic NPY−/− and WT mice. There were no significant differences in nonfasting blood glucose levels between WT and NPY−/− groups 8 wk after administration of STZ (Fig. 4A) as previously reported (31). However, in contrast to WT diabetic animals, which demonstrated significantly elevated urinary albumin:creatinine ratios (uACRs), diabetic NPY−/− mice had no significant increase in uACRs when compared with citrate-treated control animals 24 wk after the induction of diabetes (Fig. 4B). A fourfold increase in albuminuria was observed in WT mice (P = 0.036 WT citrate vs. STZ). No significant increase in albuminuria was observed in NPY−/− mice (P = 0.6828 NPY−/− citrate vs. STZ). Serum creatinine and urea levels remained normal in all experimental groups (SI Appendix, Fig. S4). Kidney tissue displayed evidence of mild mesangial matrix deposition and a small number of protein casts in the tubular regions of both WT and NPY−/− diabetic animals (Fig. 4C) with no significant differences in histological scores between groups (SI Appendix, Fig. S4 D and E), reflecting the mild renal phenotype of this STZ diabetic model. When analyzing the GFB ultrastructure, however, we observed that podocyte foot process (FP) architecture was significantly protected in diabetic NPY−/− animals when compared to diabetic WT controls (Fig. 4 D and E).
Fig. 4.
STZ-treated NPY−/− mice are protected from albuminuria and podocyte damage. Diabetes was induced in male NPY knockout (NPY−/−) 129/Sv and WT 129/Sv mice aged 6 to 8 wk with i.p. injections of 50 mg/kg STZ dissolved in sodium citrate buffer (pH 4.5) for 5 consecutive days. Tissue was collected 24 wk after administration of STZ. (A) Nonfasted blood glucose was significantly higher in both WT and NPY−/− animals from 8 wk after STZ injection; ***P < 0.001, with no differences between the two diabetic groups. (B) A significant increase in the uACR in STZ-treated WT mice 24 wk after injection. *P = 0.036 WT STZ (n = 10) vs. WT Citrate (n = 4), no significant increase in STZ-treated NPY−/− animals (n = 8) when compared with NPY−/− citrate-treated mice (n = 5). (C) PAS staining presented evidence of sclerosis in some glomeruli of each diabetic cohort, and small protein casts could be seen in tubules of each model (black arrow). (Scale bar, 25 μm.) (D) Electron microscopy (EM) images of STZ-treated WT and NPY−/− mice. (Scale bar, 500 nm.) (E) Quantification of podocyte FP width as a measurement of effacement; n = 3 mice per experimental group, >20 regions per mouse; **P < 0.01.
NPY-Deficient Mice Are Protected from Albuminuria and Podocyte Damage in Adriamycin Nephropathy.
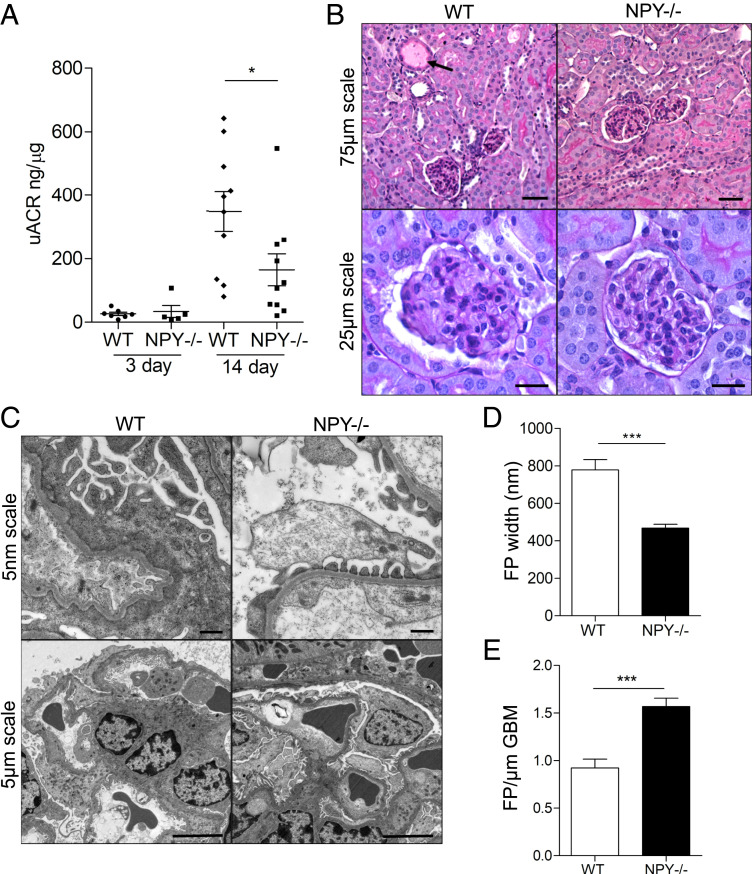
To investigate whether NPY deficiency was also protective in other, nondiabetic models of proteinuric kidney disease, we further studied the extent of kidney damage in adriamycin nephropathy (AN), a model typically characterized by podocyte injury, followed by glomerulosclerosis, inflammation, and fibrosis (32, 33). AN was induced in male WT or NPY−/− mice by a single intravenous (i.v.) injection of adriamycin (ADR) at concentrations of 6 mg/kg. There was no evidence of kidney disease in WT or NPY−/− vehicle-injected control animals (SI Appendix, Fig. S5). However, 14 d following adriamycin administration, NPY−/− mice had significantly lower uACRs than WT animals (Fig. 5A). Although a mild histological phenotype was observed in both WT and NPY−/− groups, there was evidence of tubular dilation and protein casts in WT-AN mice, which was absent in the NPY−/− AN group, reflecting the reduction in albuminuria in the NPY−/− animals (Fig. 5B and SI Appendix, Fig. S6). No significant differences in the levels of serum creatinine or urea were observed between experimental groups (SI Appendix, Fig. S6). Consistent with the reduction in albuminuria, ultrastructural analysis again demonstrated a significant reduction in FP effacement in NPY−/− animals, compared with WT-AN mice (Fig. 5 C–E).
Fig. 5.
NPY−/− mice are protected from albuminuria and podocyte damage in low-dose adriamycin nephropathy. Adriamycin was administered to male NPY knockout (NPY−/−) 129/Sv and WT 129/Sv mice at 6 mg/kg via a single i.v. injection under mild anesthesia. Tissue was collected 14 d following adriamycin injection. (A) uACRs were significantly lower in the NPY−/− AN group compared with WT AN mice (*P < 0.05, n = 7 WT 3 d, n = 5 NPY−/− 3 d, n = 10 WT 14 d, n = 10 NPY−/− 14 d); (B) PAS staining demonstrated evidence of sclerosis in some glomeruli of each AN group with mild tubular dilation and protein casts in WT AN mice (black arrow). (C) EM images of WT and NPY−/− AN mice. (D) Quantification of podocyte FP width. (E) The number of FPs per glomerular basement membrane (GBM) length as a measurement of effacement, demonstrating a significant reduction in FP effacement in NPY−/− AN compared with WT AN mice (***P < 0.001 n = 3/group, >20 regions per mouse).
Exogenous NPY Signals to Podocytes via NPY2R.
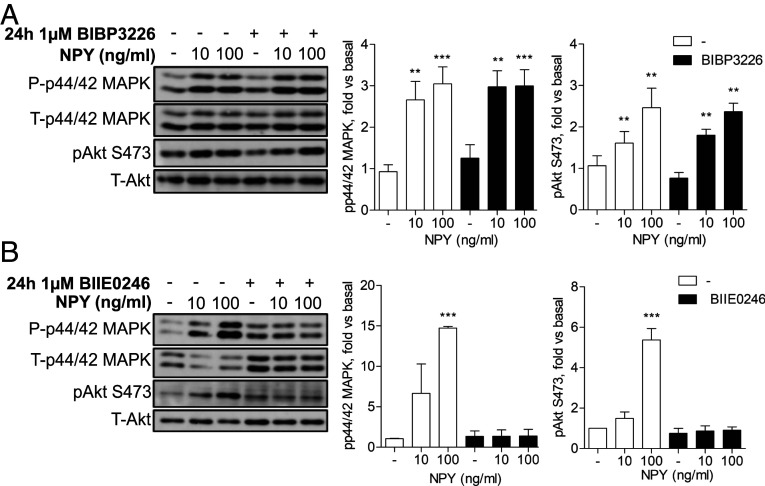
Given that a systemic knockout of NPY protected against albuminuria and podocyte ultrastructural damage in two in vivo models, we next investigated the possibility that circulating NPY could influence podocyte responses at the filtration barrier. Indeed, increases in plasma NPY are reported in several systemic conditions linked to albuminuria including obesity, diabetes, and hypertension (19, 34–38), as well as in CKD (19). NPY receptors are also expressed by renal cells (39–42), including our glomerular cell models (SI Appendix, Fig. S7). Initial dose–response and time-response experiments demonstrated that the stimulation of both human and mouse podocytes with NPY induced the activation of PI3K and ERK MAPK phosphorylation cascades, as shown by increased phosphorylation of Akt (S473, T308) and p44/42 MAPK (Thr202/Tyr204), respectively (SI Appendix, Fig. S8). Using specific chemical NPY receptor antagonists, we also found that blocking NPY1R with BIBP3226 had no significant effect on these signaling responses (Fig. 6A), whereas the pretreatment of podocytes with the specific NPY2R antagonist BIIE0246 (43) blocked the NPY-stimulated phosphorylation of Akt and p44/42 MAPK (Fig. 6B).
Fig. 6.
Podocytes respond to NPY in an NPY2R-dependent manner. (A) Representative Western blots and densitometry of differentiated mouse podocytes treated with the Y1 receptor antagonist BIBP3226 at 1 μM for 24 h prior to stimulation with 10 and 100 ng/mL NPY for 15 min, n = 4. **P < 0.01 and ***P < 0.001 vs. unstimulated, one-way ANOVA, Tukey’s multiple comparison. (B) Representative Western blots and densitometry of differentiated mouse podocytes treated with the Y2 receptor antagonist BIIE0246 (1 μM) for 24 h prior to stimulation with 10 and 100 ng/mL NPY for 15 min, n = 4. ***P < 0.001 vs. unstimulated, one-way ANOVA, Tukey’s multiple comparison.
NPY Promotes NFAT-Nuclear Translocation in Podocytes via a Calcium-Dependent Pathway.
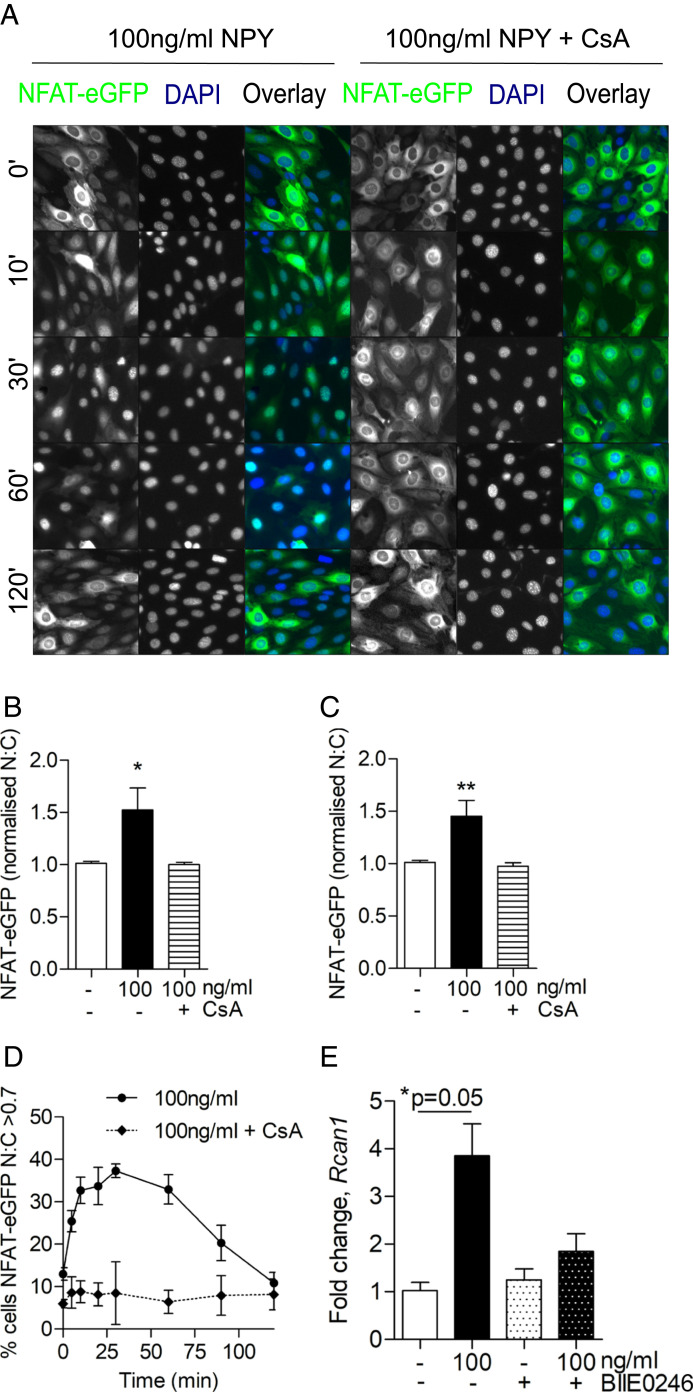
Furthermore, we found that NPY stimulation caused an increase in intracellular calcium concentrations (SI Appendix, Fig. S9) and induced the nuclear translocation of NFAT-eGFP (in a calcineurin-dependent manner) (Fig. 7 A–D). When analyzing whole-cell populations, a significant increase in the nuclear-localized NFAT-eGFP was evident 30 and 60 min post stimulation, which was blocked when podocytes were pretreated with cyclosporine (CsA) (Fig. 7 B and C). This was also associated with an increase in expression of the NFAT-regulated gene, regulator of calcineurin 1 (Rcan1) (44) (Fig. 7E), which was blocked in the presence of BIIE0246, demonstrating that NPY signaling can promote calcium-dependent NFAT activity in podocytes.
Fig. 7.
NPY stimulates calcium-dependent NFAT activation in podocytes. Podocytes were transfected with NFAT-eGFP and stimulated with 100 ng/mL of NPY at indicated time points before fixation and DAPI staining. Where indicated, 10 μM CsA was added 15 min prior to NPY stimulation. Modest changes in brightness and contrast were applied to all images for visual purposes; unmodified images were used for quantification. (A) Representative fluorescent images. (B and C) Population average values for NFAT-eGFP nuclear:cytoplasmic (N:C) ratios derived from arbitrary fluorescence unit measurements of NFAT-eGFP intensity in nuclear and cytoplasmic compartments and normalized to control (time 0), demonstrating a significant increase in N:C NFAT-eGFP at (B) 30 min and (C) 60 min post stimulation. *P < 0.05 and **P < 0.01, Mann–Whitney U test; no significant differences were observed with CsA pretreatment; n = 3; each condition was tested in triplicate. (D) Percentage of activated cells (where N:C of individual cells >0.7) in whole-cell populations over time; n = 3. (E) qPCR results demonstrating fold change in regulator of calcineurin 1 (Rcan1) expression following NPY stimulation, with and without costimulation of the Y2 receptor antagonist, BIIE0246, at 1 μM for 24 h; *P = 0.05, Mann–Whitney U test; n = 3.
Inhibiting NPY2R In Vivo Reduces Albuminuria in Adriamycin Nephropathy.
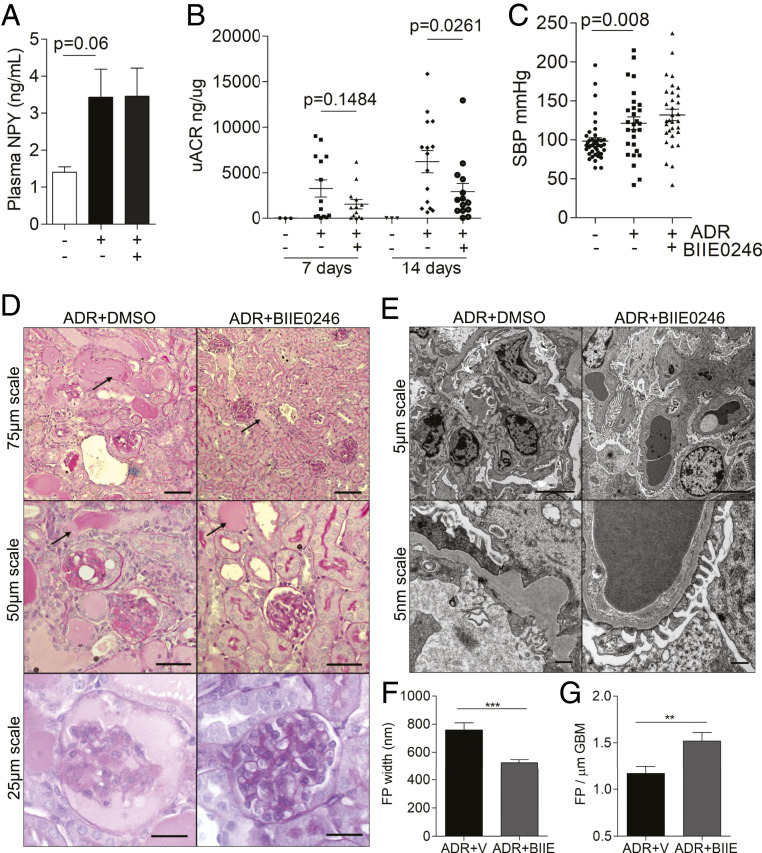
To determine whether NPY-NPY2R signaling influenced albuminuria in vivo, we investigated the effects of BIIE0246 on the development of AN. Male BALB/c mice were treated with BIIE0246 at 10 μg/day via daily intraperitoneal (i.p.) injection or subcutaneous osmotic minipump and albuminuric kidney damage was induced with a single i.v. injection of ADR. Of note, we observed a reduction in Npy messenger RNA (mRNA) in podocytes treated with ADR (SI Appendix, Fig. S10A) and an increase in plasma Npy levels in AN mice, which was not affected by BIIE0246 treatment (Fig. 8A). Fourteen days after the induction of AN, mice treated with the NPY2R antagonist had significantly reduced uACRs, when compared to vehicle control-treated animals (Fig. 8B), with no significant changes in body weight between any of the experimental groups (SI Appendix, Fig. S10C). Importantly, although a significant increase in SBP was observed in adriamycin-treated animals, there was no significant change in SBP between AN-vehicle and AN-BIIE0246 groups (Fig. 8C), indicating that the protective effects of BIIE0246 treatment on albuminuria were independent of any blood pressure-lowering effects. Furthermore, we observed an improvement in renal histology (Fig. 8D and SI Appendix, Fig. S10 D and E) and a maintenance of podocyte FP architecture (Fig. 8 E–G) in AN-BIIE0246 mice, compared with the AN-vehicle group. Collectively, these results suggest that pharmacologically targeting NPY-NPY2R signaling is beneficial in albuminuric kidney disease.
Fig. 8.
BIIE0246 treatment reduces albuminuria in ADR nephropathy. Adriamycin was administered to male BALB/c mice at 6 mg/kg via a single i.v. injection under mild anesthesia, and the effects of NPY2R inhibition were investigated. Control mice were treated with equivalent volumes of distilled water (adriamycin vehicle) and dimethylsulfoxide (BIIE0246 vehicle). (A) Plasma NPY levels (ng/mL) in male BALB/c mice treated with adriamycin (n = 8) or adriamycin in combination with the NPY2R antagonist BIIE0246 (n = 4). (B) uACRs in mice treated with adriamycin (n = 15), adriamycin plus the NPY2R antagonist BIIE0246 (n = 14), or vehicle (n = 3). A significant reduction in albuminuria is observed in the ADR+BIIE0246 group, compared with ADR+Vehicle group at 14 d. (C) A significant increase in SBP was observed in ADR-treated mice (**P = 0.0087) which was not influenced by NPY2R inhibition (P = 0.3260). (D) PAS staining demonstrating a reduction in the severity and extent of glomerular sclerosis and tubular dilation/protein accumulation in the ADR+BIIE0246 mice, although evidence of tubular dilation and protein casts can be seen in both ADR-treated groups (black arrows). (E) EM images of ADR+Vehicle- and ADR+BIIE0246-treated mice, demonstrating a significant loss of podocyte architecture. (F) Quantification of FP width. ***P < 0.001. (G) Number of FPs per GBM length, indicating a significant reduction in FP effacement in ADR+BIIE0246-treated mice compared to ADR+Vehicle treatment; n = 3 mice >20 regions per mouse. **P < 0.01.
Proteomic Analysis of Glomerular NPY-NPY2R Signaling Networks.
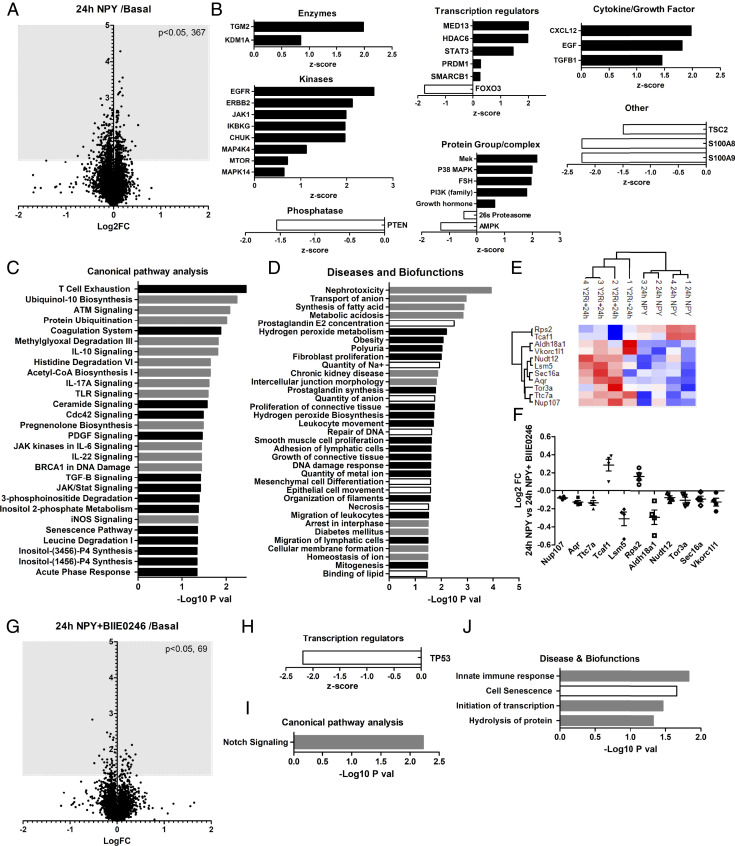
To further explore the effects of NPY in the glomerulus (and potential protective effects of NPY2R antagonism), we performed high-resolution Tandem Mass Tagged (TMT)-based spectrometry analysis on isolated whole BALB/c mouse glomeruli after either chronic (24-h) or acute (10-min) NPY stimulation, with or without BIIE0246 incubation. Analysis of the total glomerular proteome identified significant changes in 367 proteins after chronic (24-h) NPY treatment (Fig. 9A). The activity of potential upstream regulators of these proteins was predicted using Ingenuity Pathway analysis (IPA) (45) (Fig. 9B), which suggested a significant increase in activity of protein groups, including PI3K and MAPK (as indicated by our in vitro studies) (Fig. 6). A full list of upstream regulators, and proteins used to make these predictions, is presented in SI Appendix, Table S1.
Fig. 9.
Total proteomic analysis of mouse glomeruli treated with NPY ex vivo. Glomeruli were isolated and treated with NPY (100 ng/mL for 24 h) with or without NPY2R inhibition (1 μM BIIE0246 for 24 h). (A) Changes in the total glomerular proteome following 24 h of NPY stimulation compared with basal (control) glomeruli; Log2 fold change (FC) vs. −log10 P value of the scaled abundances. (B) Prediction of the upstream regulators of glomerular protein changes after 24 h of NPY treatment determined by IPA; positive z-score: predicted activation; negative z-score: predicted inhibition. (C) Canonical pathway and (D) Diseases and Biofunctions significantly enriched in mouse glomeruli treated with NPY for 24 h, which were not enriched in NPY+BIIE0246-treated glomeruli, determined by IPA. Black bars: predicted activation; white bars: predicted inhibition; gray bars: no activity information predicted. (E) Heat map and hierarchical clustering of z-scored scaled abundances normalized to basal values, demonstrating significant protein changes (24 h NPY) that are inhibited by BIIE0246 treatment. (F) Log2 FC of scaled protein abundances at 24 h NPY relative to NPY+BIIE0246 treatment. (G) Changes in the total glomerular proteome following 24 h of NPY + BIIE0246 treatment compared with basal; Log2 FC vs. −log10 P value of the scaled abundances. Nine proteins found to be significantly regulated by BIIE0246 treatment alone were excluded from the analysis. (H) TP53 was highlighted as a significantly inhibited upstream regulator of protein changes observed in NPY+BIIE0246-treated glomeruli. (I) “Notch signalling” was a significantly enriched canonical pathway. (J) Significantly enriched diseases and biofunctions where three or more molecules were used to make the prediction.
Enrichment analysis was also performed in IPA and predicted several “Canonical Pathways” (Fig. 9C and SI Appendix, Table S2), and “Diseases and Biofunctions” (Fig. 9D and SI Appendix, Table S3) were significantly altered with 24 h of NPY treatment. These pathways were not predicted to be significantly enriched in glomeruli treated with NPY in combination with BIIE0246. Of note, “Nephrotoxicity” and “Chronic Kidney Disease” were predicted, significantly enriched bioprocesses in response to chronic NPY stimulation (Fig. 9D and SI Appendix, Table S3). BIIE0246 caused a significant disruption in these responses. Of the glomerular proteins that were regulated by NPY, changes in Rps2, Tcaf1, Aldh18a1, Vkorc1l1, Nudt12, Lsm5, Sec16a, Aqr, Tor3a, Ttc7a, and Nup107 were most significantly inhibited by NPY2R antagonism (Fig. 9 E and F). Several of these proteins are involved in RNA processing. In NPY+BIIE0246-treated glomeruli, we found 69 significantly regulated proteins (Fig. 9G). IPA analysis predicted a significant inhibition of TP53 under these conditions, and a significant enrichment in notch signaling and innate immune responses (Fig. 9 H–J and SI Appendix, Table S4), suggesting that these NPY-stimulated responses do not occur via the NPY2R.
Phospho-proteomic analysis.
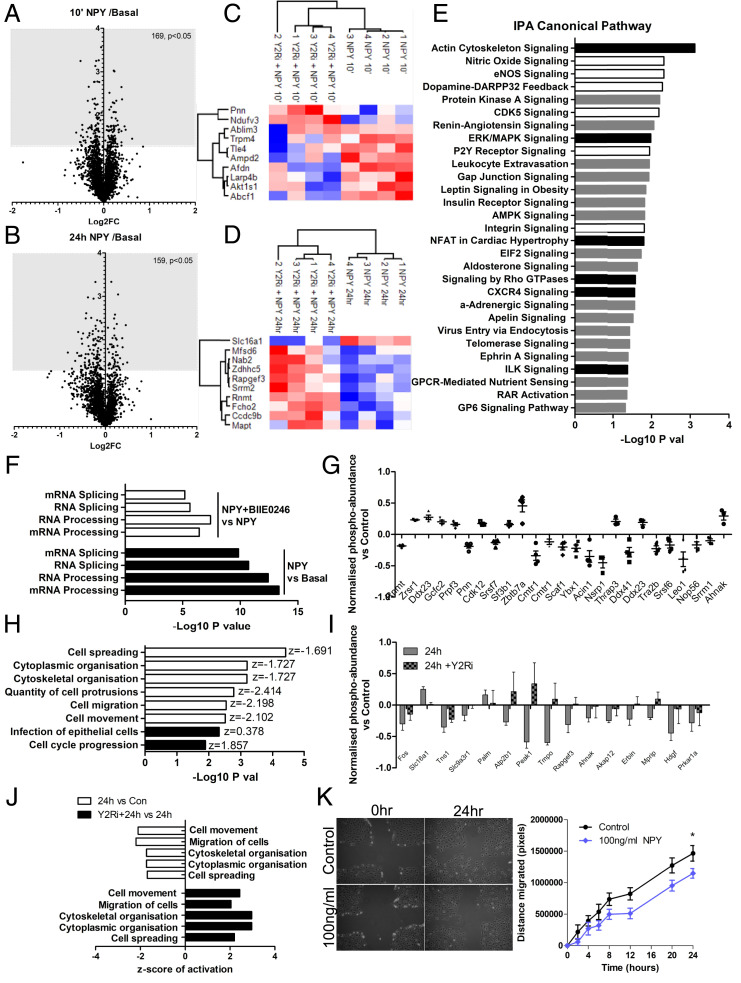
We also studied the glomerular phospho-proteome after acute (10-min) and chronic (24-h) NPY stimulation, which identified significant changes in phosphorylation of 169 and 159 glomerular proteins, respectively, when normalized to corresponding total protein levels (Fig. 10 A and B). The top 10 phospho-proteins regulated by NPY that were blocked by NPY2R antagonism are presented in Fig. 10 C and D. IPA analysis of the glomerular phosphoprotein changes predicted a significant enrichment of several Canonical Pathways after 10 min of NPY stimulation, which were no longer enriched with BIIE0246 treatment (Fig. 10E and SI Appendix, Table S5), including a significant activation of ERK/MAPK signaling, as demonstrated in mouse podocytes in vitro (Fig. 6B). Downstream Disease and Biofunction analysis suggested that the most significantly enriched and activated processes in glomeruli treated acutely with NPY were those involved in RNA post-transcriptional modifications, including increased processing and splicing of RNA and mRNA, which were inhibited by BIIE0246 treatment (Fig. 10F and SI Appendix, Table S7). Phospho-proteins that we found to be regulated by NPY stimulation involved in RNA processing are presented in Fig. 10G. NPY induced changes in the phosphorylation of 21 proteins that were sustained between 10 min and 24 h of NPY treatment (SI Appendix, Fig. S11). Interestingly, when looking at biofunctions regulated by both acute and chronic NPY treatment, IPA predicted a significant inhibition of cellular migratory responses (including cytoskeletal organization, number of cell protrusions, and cell spreading) (Fig. 10H and SI Appendix, Table S8), which was again reversed in glomeruli treated with BIIE0246 and NPY in combination (Fig. 10 I and J and SI Appendix, Table S9). This effect of NPY on cell migration was further validated in vitro using podocyte motility assays, which demonstrated a significant reduction in podocyte movement in response to NPY (Fig. 10K).
Fig. 10.
Phospho-proteomic analysis of NPY-NPY2R signaling in mouse glomeruli. Glomeruli were isolated and treated with NPY (100 ng/mL for 10 min or 24 h) with or without NPY2R inhibition (1 μM BIIE0246 for 24 h). (A) Changes in the glomerular phospho-proteome following 10 min of stimulation (10′ NPY) compared with basal (control) glomeruli, Log2 FC vs. −log10 P value of the normalized phospho-peptide abundances. (B) Changes in the glomerular phospho-proteome following 24 h of NPY stimulation (24 h NPY) compared with basal (control) glomeruli, Log2 FC vs. −log10 P value of the normalized phospho-peptide abundances. (C) Heat map and unsupervised clustering of z-scored normalized phospho-peptide abundances, relative to basal conditions within each experiment, showing the top 10 glomerular proteins significantly phosphorylated at 10 min and (D) 24 h of NPY treatment that was also inhibited by NPY2R inhibition. (E) Significantly enriched Canonical Pathways based on significantly changed phospho-peptides at 10′ NPY compared with basal, which were not enriched in NPY+BIIE0246-treated glomeruli. Black bars: predicted activation; white bars: predicted inhibition; gray bars: no activity information predicted. (F) Disease and Biofunction analysis in IPA predicted a significant enrichment and activation of RNA processing in glomeruli at 10′ NPY (black bars: positive activation z-score) and a significant inhibition in 10′ NPY+BIIE0246-treated glomeruli when compared with 10′ NPY treatment alone (white bars: negative activation z-score). (G) Top 25 proteins with phospho-sites regulated by 10′ NPY that are involved in RNA processing; bar chart demonstrates the normalized phospho-peptide abundance ratios, relative to basal levels. (H) Disease and biofunction predicted to be enriched in glomeruli at both 10 min and 24 h NPY, showing a sustained inhibition of cell migratory responses (white bars, negative z-score). Diseases and biofunctions were filtered to exclude those where fewer than four phospho-peptides were used to make the predictions and where predicted activation/inhibition was inconsistent between 10 min and 24 h. Data presented are for 24-h NPY-treated glomeruli. (I) Top 15 proteins with phospho-sites regulated by 24-h NPY stimulation, which are sensitive to BIIE0246 treatment and are involved in cell motility; bar chart demonstrates the normalized phospho-peptide abundance ratios relative to basal levels. (J) Disease and biofunction predictions showing a significant enrichment and inhibition of cell migratory responses in glomeruli following NPY treatment when compared with basal (white bars: negative z-score) and a significant enrichment and activation in NPY+BIIE0246-treated glomeruli when compared with NPY treatment alone (black bars: positive z-score). (K) Representative images taken at baseline and 24 h following NPY stimulation and quantification of the migratory response. The area of the clear zone was measured in pixels for each condition and compared to the area at time 0; *P < 0.05, one-way ANOVA, Tukey’s multiple comparison; n = 3, 4 replicates per condition.
Discussion
NPY is one of the most abundant peptides of the central and peripheral nervous systems, with a significant role in energy homeostasis (38, 46). Although its expression and release into plasma is largely associated with sympathetic nervous system (SNS) activity (47), several cells are now known to respond to NPY, and dysregulation of the NPY system is implicated in several pathological conditions including obesity (38), cardiovascular disease (29, 48), diabetes (49), and insulin resistance (50), conditions which are also often accompanied by albuminuria and CKD (1).
Interestingly, although the pathogenic involvement of NPY in albuminuric kidney disease has not previously been explored, increases in circulating NPY are observed in both the plasma and urine of type 1 (21) and type 2 diabetic patients with nephropathy (20), and the common Leu7pro7 polymorphism in the NPY gene, thought to be associated with increased peptide secretion (51), has been associated with proteinuria (52) and an increased susceptibility to nephropathy in type 1 diabetic patients (53). Recently, it has also been shown that increased plasma NPY levels are associated with proteinuria, faster progression of CKD, and a higher risk of kidney failure in two independent European cohorts of CKD (19).
We initially hypothesized that reducing NPY levels would contribute to glomerular disease and podocyte damage. However, under basal conditions, NPY-deficient mice (25) had no apparent kidney phenotype and no difference in levels of albuminuria. In contrast, NPY-deficient mice were protected from albuminuria and podocyte damage in both STZ-induced diabetes and adriamycin-induced glomerular injury. These observations, coupled with the knowledge that circulating NPY is often increased in conditions such as diabetes, obesity, hypertension, and CKD (19, 35–38), suggested that increased circulating NPY might in fact contribute to albuminuria, potentially by directly affecting the filtration barrier. As such, our initial observations of reduced NPY mRNA in diabetic podocytes and glomeruli may reflect a response to disease to limit local glomerular NPY levels. This was supported by the finding that podocyte NPY production was much lower than that of neuronal cells (SI Appendix, Fig. S3), which are the major source of circulating NPY.
NPY has been shown to have a direct effect on peripheral cells in several conditions. For example, increased circulating NPY in obesity can directly signal to adipocytes, via NPY2R, promoting adipogenesis, thereby augmenting symptoms of the metabolic syndrome and the obese phenotype (38); in diabetic retinopathy, NPY-NPY2R signaling may contribute toward retinal neovascularization (54), and NPY-NPY1R signaling to macrophages has antiinflammatory effects in diet-induced obesity, with NPY1R deficiency exacerbating obesity, insulin resistance, and inflammation (50). As such, the pharmacological modulation of NPY receptor signaling is a promising strategy for several diseases, and NPY receptor ligands are being trialled for the treatment of obesity (29). The potential for NPY receptor ligands in the treatment of renal disease, however, has not been investigated.
Our subsequent experiments using both human and mouse podocytes revealed that NPY could directly signal to these cells via NPY2R. Furthermore, the stimulation of podocytes with NPY promoted NFAT activation via a calcineurin- (thus calcium-) dependent pathway. Given that the overactivation of both NFATc1 (44, 55, 56) and NFATc3 (57, 58) is linked to podocyte damage, it is feasible that increased NPY-NPY2R signaling to podocytes directly contributes to albuminuria, in part via the activation of Ca2+-calcineurin-NFAT pathways.
To investigate the therapeutic potential of modulating NPY2R signaling in albuminuria, we further studied the effects of BIIE0246 treatment (43, 59) on the development of albuminuria in vivo. We found a significant reduction in the level of albuminuria in mice treated with the NPY2R antagonist when compared with vehicle-treated mice in AN. This was coupled with an improvement in renal histology and podocyte FP architecture. Importantly, we observed no differences in SBP between AN-BIIE0246 and AN-vehicle groups, indicating that the protective effects on albuminuria were independent of any effects on blood pressure. This supports evidence suggesting that NPY-NPY1R signaling is important in controlling blood pressure [and renal vasoconstriction in hypertensive rat models (41)], as opposed to NPY-NPY2R responses (26, 34, 60, 61).
We further found that, in ex vivo glomeruli, both acute and chronic stimulation with NPY could regulate several signaling pathways, increasing posttranscriptional RNA processing and reducing cell migration in an NPY2R-dependent manner. Taken together, our results suggest that NPY-NPY2R signaling plays a direct, pathogenic role in the glomerulus in albuminuric kidney disease.
As described, NPY is also a major component of the SNS; it is present in renal nerve fibers where it is costored with norepinephrine. Interestingly, several studies also describe direct, protective effects of denervation of the kidney [which is characterized by reduced circulating NPY (62)], independent of changes in blood pressure (63, 64). In the context of glomerular disease, renal denervation protects against podocyte injury and albuminuria (64), and drugs to reduce sympathetic nerve activity have been successfully used to treat microalbuminuria in diabetic patients, despite having no effect on blood pressure (65). Although we cannot determine the role of SNS activity in our models per se, our results demonstrate that NPY can have direct effects in the glomerulus and suggest a pathogenic role for NPY2R signaling in albuminuria, in this regard, supporting a direct role for overactivity of the SNS in kidney damage. Furthermore, our results provide a potential mechanism behind the association that others have observed between NPY and albuminuria in DN and CKD (19, 20, 52, 53). The observation that blocking NPY2R is protective also implicates other NPY family members in albuminuria, in particular Peptide YY (39, 41).
In summary, using an unbiased RNA screening approach, we identified NPY to be down-regulated in insulin-resistant podocytes and diabetic glomeruli. However, our subsequent experiments suggested that this NPY down-regulation was an adaptive response (opposed to causative) and demonstrated that reducing NPY-NPY2R signaling (opposed to NPY mRNA expression) was protective in models of albuminuria. We found that NPY influenced several signaling responses which were dependent on NPY2R activity in the glomerulus. In podocytes, NPY activated calcium-NFAT signaling and inhibited cell motility, both of which may be detrimental if not properly regulated. Remarkably, the chemical inhibition of NPY-NPY2R signaling in vivo protected against albuminuria and podocyte damage. Collectively, these results demonstrate a direct effect of NPY at the filtration barrier and suggest that targeting NPY-NPY2R signaling has therapeutic potential in albuminuric kidney disease.
Materials and Methods
Please refer to SI Appendix for full detailed materials and methods.
Human Samples.
Protocol human kidney biopsies were obtained from Pima Indians (n = 69) with type-2 diabetes from the Gila River Indian Community (23). Renal biopsies from healthy living donors (n = 18) were from the European Renal cDNA Bank cohort (66). The study was approved by the Institutional Review Board of the National Institute of Diabetes and Digestive and Kidney Diseases, and each participant signed an informed consent document. Kidney tissue processing, microarray preparation, and gene expression profiling were done as described previously (66–68). Gene expression data were also extracted from the Nephroseq database (https://www.nephroseq.org).
Animal Studies.
All animal experiments and procedures were approved by the UK Home Office in accordance with the Animals (Scientific Procedures) Act of 1986. Male NPY knockout (NPY−/−) mice were bred on a 129Sv/Ev background as previously reported (25). Diabetes was induced in mice aged 6 to 8 wk of age, with low-dose i.p. injections of 50 mg/kg STZ for 5 consecutive days, resulting in a mild renal phenotype by 24 wk. ADR nephropathy was induced with a single tail-vein injection of ADR at 6 mg/kg body weight. For NPY2Ri studies, male BALB/c were treated with BIIE0246, a selective NPY2R antagonist with minimal affinity for the Y1R and Y5R (43), at 10 μg/day for 14 d.
Cell Culture and Treatments.
Conditionally immortalized human (69) and mouse (70) podocytes were maintained as previously reported (14). Recombinant full-length NPY was used at previously published concentrations (38), following a 2- to 6-h serum starvation. Selective antagonists of NPY1R (BIBP3226, Tocris) and NPY2R (BIIE0246, Tocris) were used at 1 μM for 24 h. Where stated, 10 μM CsA was added 15 min before stimulation with NPY. Adenovirus-expressing NFATC1-eGFP (Ad-NFAT-GFP) was prepared and used as previously described (71).
Proteomic Analysis of Ex Vivo Glomeruli.
Glomeruli were isolated by dynabead perfusion from male BALB/c mice as previously described (14, 72) and incubated for 24 h in RPMI-1640 containing l-glutamine and NaHCO3, supplemented with 10% fetal bovine serum (Sigma Aldrich) before appropriate stimulation. Glomerular proteins were extracted in RIPA lysis and extraction buffer (ThermoFisher) and prepared for TMT-based mass spectrometer analysis. All spectra were acquired using an Orbitrap Fusion Lumos mass spectrometer controlled by Xcalibur 4.1 software (Thermo Scientific). The data output from Proteome Discoverer 2.1 was handled, processed, and further analyzed in Microsoft Office Excel, GraphPad Prism, Perseus, and R. Log2-transformed scaled total protein abundance data and adjusted phospho-peptide data were used for analysis. Enrichment analysis was performed with IPA (45), using all detected proteins/phosphoproteins in our TMT-MS/MS analysis as background.
Other Statistical Analysis.
Unless otherwise stated, data are presented as mean ± SEM and analysis were performed using GraphPad Prism (GraphPad Software). Statistical significance was calculated with one-way ANOVA or t tests and taken as P < 0.05. Normality tests and nonparametric tests were performed accordingly.
Data Availability.
All data related to this study are included either in the paper, SI Appendix, or from the corresponding author upon reasonable request. Detailed methods are provided in SI Appendix. The phospho-/total proteomics data will be deposited in the PRoteomics IDEntification repository as part of the ProteomeXchange Consortium.
Supplementary Material
Acknowledgments
We thank the Wolfson Bioimaging Facility at the University of Bristol and staff of the histology services unit at the University of Bristol for technical support; Kirsty Stevenson (Department of Clinical Biochemistry, Bristol Royal Infirmary) for serum creatinine and urea analysis; Dr. Kirsty McMillan for SH-SY5Y cells and primary cortical neurons; and Dr. Benjamin P. Flynn and Dr. Becky Conway-Campbell for use of and assistance with IPA. This study was supported by a Kidney Research UK project grant (RP26/2014); by the Medical Research Council, which funds R.J.M.C. with a Senior Research Fellowship (MR/K010492/1); and by the Intramural Research Program of the National Institute of Diabetes and Digestive and Kidney Diseases. This work was also supported by funding from the Horizon2020-IMI Biomarker Enterprise to Attack Diabetic Kidney Disease consortium which supports A.C.L., R.J.M.C., and S.C.S.
Footnotes
The authors declare no competing interest.
This article is a PNAS Direct Submission.
This article contains supporting information online at https://www.pnas.org/lookup/suppl/doi:10.1073/pnas.2004651117/-/DCSupplemental.
References
- 1.Eckardt K. U., et al., Evolving importance of kidney disease: From subspecialty to global health burden. Lancet 382, 158–169 (2013). [DOI] [PubMed] [Google Scholar]
- 2.Matsushita K.et al.; Chronic Kidney Disease Prognosis Consortium , Association of estimated glomerular filtration rate and albuminuria with all-cause and cardiovascular mortality in general population cohorts: A collaborative meta-analysis. Lancet 375, 2073–2081 (2010). [DOI] [PMC free article] [PubMed] [Google Scholar]
- 3.Mogensen C. E., Microalbuminuria predicts clinical proteinuria and early mortality in maturity-onset diabetes. N. Engl. J. Med. 310, 356–360 (1984). [DOI] [PubMed] [Google Scholar]
- 4.Tryggvason K., Patrakka J., Wartiovaara J., Hereditary proteinuria syndromes and mechanisms of proteinuria. N. Engl. J. Med. 354, 1387–1401 (2006). [DOI] [PubMed] [Google Scholar]
- 5.Pagtalunan M. E., et al., Podocyte loss and progressive glomerular injury in type II diabetes. J. Clin. Invest. 99, 342–348 (1997). [DOI] [PMC free article] [PubMed] [Google Scholar]
- 6.Wolf G., Chen S., Ziyadeh F. N., From the periphery of the glomerular capillary wall toward the center of disease: Podocyte injury comes of age in diabetic nephropathy. Diabetes 54, 1626–1634 (2005). [DOI] [PubMed] [Google Scholar]
- 7.Toyoda M., Najafian B., Kim Y., Caramori M. L., Mauer M., Podocyte detachment and reduced glomerular capillary endothelial fenestration in human type 1 diabetic nephropathy. Diabetes 56, 2155–2160 (2007). [DOI] [PubMed] [Google Scholar]
- 8.Brinkkoetter P. T., Ising C., Benzing T., The role of the podocyte in albumin filtration. Nat. Rev. Nephrol. 9, 328–336 (2013). [DOI] [PubMed] [Google Scholar]
- 9.Weil E. J., et al., Podocyte detachment and reduced glomerular capillary endothelial fenestration promote kidney disease in type 2 diabetic nephropathy. Kidney Int. 82, 1010–1017 (2012). [DOI] [PMC free article] [PubMed] [Google Scholar]
- 10.Welsh G. I., et al., Insulin signaling to the glomerular podocyte is critical for normal kidney function. Cell Metab. 12, 329–340 (2010). [DOI] [PMC free article] [PubMed] [Google Scholar]
- 11.Coward R. J., et al., The human glomerular podocyte is a novel target for insulin action. Diabetes 54, 3095–3102 (2005). [DOI] [PubMed] [Google Scholar]
- 12.Ising C., et al., Inhibition of insulin/IGF-1 receptor signaling protects from mitochondria-mediated kidney failure. EMBO Mol. Med. 7, 275–287 (2015). [DOI] [PMC free article] [PubMed] [Google Scholar]
- 13.Madhusudhan T., et al., Defective podocyte insulin signalling through p85-XBP1 promotes ATF6-dependent maladaptive ER-stress response in diabetic nephropathy. Nat. Commun. 6, 6496 (2015). [DOI] [PMC free article] [PubMed] [Google Scholar]
- 14.Lay A. C., et al., Prolonged exposure of mouse and human podocytes to insulin induces insulin resistance through lysosomal and proteasomal degradation of the insulin receptor. Diabetologia 60, 2299–2311 (2017). [DOI] [PMC free article] [PubMed] [Google Scholar]
- 15.Lay A., Coward R. J., Recent advances in our understanding of insulin signalling to the podocyte. Nephrol. Dial. Transplant. 29, 1127–1133 (2014). [DOI] [PubMed] [Google Scholar]
- 16.Lennon R., et al., Saturated fatty acids induce insulin resistance in human podocytes: Implications for diabetic nephropathy. Nephrol. Dial. Transplant. 24, 3288–3296 (2009). [DOI] [PMC free article] [PubMed] [Google Scholar]
- 17.Lay A. C., Coward R. J. M.. The evolving importance of insulin signaling in podocyte health and disease. Front. Endocrinol. 9, (2018). [DOI] [PMC free article] [PubMed] [Google Scholar]
- 18.Tejada T., et al., Failure to phosphorylate AKT in podocytes from mice with early diabetic nephropathy promotes cell death. Kidney Int. 73, 1385–1393 (2008). [DOI] [PubMed] [Google Scholar]
- 19.Zoccali C., et al., Neuropeptide Y and chronic kidney disease progression: A cohort study. Nephrol. Dial. Transplant. 33, 1805–1812 (2018). [DOI] [PubMed] [Google Scholar]
- 20.Satoh C., et al., Elevated plasma immunoreactive neuropeptide Y concentrations and its increased urinary excretion in patients with advanced diabetic nephropathy. Endocr. J. 46, 139–146 (1999). [DOI] [PubMed] [Google Scholar]
- 21.Sokolovska J., et al., Angiopoietin 2 and Neuropeptide Y are associated with diabetic kidney disease in Type 1 diabetes mellitus. Exp. Clin. Endocrinol. Diabetes, 10.1055/a-1079-4711 (2020). [DOI] [PubMed] [Google Scholar]
- 22.Zoccali C., et al., Neuropeptide Y, left ventricular mass and function in patients with end stage renal disease. J. Hypertens. 21, 1355–1362 (2003). [DOI] [PubMed] [Google Scholar]
- 23.Weil E. J., et al., Effect of losartan on prevention and progression of early diabetic nephropathy in American Indians with type 2 diabetes. Diabetes 62, 3224–3231 (2013). [DOI] [PMC free article] [PubMed] [Google Scholar]
- 24.Ju W., et al., Defining cell-type specificity at the transcriptional level in human disease. Genome Res. 23, 1862–1873 (2013). [DOI] [PMC free article] [PubMed] [Google Scholar]
- 25.Erickson J. C., Clegg K. E., Palmiter R. D., Sensitivity to leptin and susceptibility to seizures of mice lacking neuropeptide Y. Nature 381, 415–421 (1996). [DOI] [PubMed] [Google Scholar]
- 26.Pedrazzini T., et al., Cardiovascular response, feeding behavior and locomotor activity in mice lacking the NPY Y1 receptor. Nat. Med. 4, 722–726 (1998). [DOI] [PubMed] [Google Scholar]
- 27.Naveilhan P., et al., Normal feeding behavior, body weight and leptin response require the neuropeptide Y Y2 receptor. Nat. Med. 5, 1188–1193 (1999). [DOI] [PubMed] [Google Scholar]
- 28.Ruohonen S. T., et al., Stress-induced hypertension and increased sympathetic activity in mice overexpressing neuropeptide Y in noradrenergic neurons. Neuroendocrinology 89, 351–360 (2009). [DOI] [PubMed] [Google Scholar]
- 29.Brothers S. P., Wahlestedt C., Therapeutic potential of neuropeptide Y (NPY) receptor ligands. EMBO Mol. Med. 2, 429–439 (2010). [DOI] [PMC free article] [PubMed] [Google Scholar]
- 30.Michalkiewicz M., Michalkiewicz T., Kreulen D. L., McDougall S. J., Increased blood pressure responses in neuropeptide Y transgenic rats. Am. J. Physiol. Regul. Integr. Comp. Physiol. 281, R417–R426 (2001). [DOI] [PubMed] [Google Scholar]
- 31.Park S., Peng X. D., Frohman L. A., Kineman R. D., Expression analysis of hypothalamic and pituitary components of the growth hormone axis in fasted and streptozotocin-treated neuropeptide Y (NPY)-intact (NPY+/+) and NPY-knockout (NPY-/-) mice. Neuroendocrinology 81, 360–371 (2005). [DOI] [PubMed] [Google Scholar]
- 32.Lee V. W., Harris D. C., Adriamycin nephropathy: A model of focal segmental glomerulosclerosis. Nephrology (Carlton) 16, 30–38 (2011). [DOI] [PubMed] [Google Scholar]
- 33.Wang Y., Wang Y. P., Tay Y. C., Harris D. C. H., Progressive adriamycin nephropathy in mice: Sequence of histologic and immunohistochemical events. Kidney Int. 58, 1797–1804 (2000). [DOI] [PubMed] [Google Scholar]
- 34.Liu J., et al., Blockage of peripheral NPY Y1 and Y2 receptors modulates barorefex sensitivity of diabetic rats. Cell. Physiol. Biochem. 31, 421–431 (2013). [DOI] [PubMed] [Google Scholar]
- 35.Milewicz A., Mikulski E., Bidzinska B., Plasma insulin, cholecystokinin, galanin, neuropeptide Y and leptin levels in obese women with and without type 2 diabetes mellitus. Int. J. Obes. 24 (suppl. 2), S152–S153 (2000). [DOI] [PubMed] [Google Scholar]
- 36.Baranowska B., Wolińska-Witort E., Martyńska L., Chmielowska M., Baranowska-Bik A., Plasma orexin A, orexin B, leptin, neuropeptide Y (NPY) and insulin in obese women. Neuroendocrinol. Lett. 26, 293–296 (2005). [PubMed] [Google Scholar]
- 37.Baranowska B., et al., The role of neuropeptides in the disturbed control of appetite and hormone secretion in eating disorders. Neuroendocrinol. Lett. 24, 431–434 (2003). [PubMed] [Google Scholar]
- 38.Kuo L. E., et al., Neuropeptide Y acts directly in the periphery on fat tissue and mediates stress-induced obesity and metabolic syndrome. Nat. Med. 13, 803–811 (2007). [DOI] [PubMed] [Google Scholar]
- 39.Sheikh S. P., Hansen A. P., Williams J. A., Solubilization and affinity purification of the Y2 receptor for neuropeptide Y and peptide YY from rabbit kidney. J. Biol. Chem. 266, 23959–23966 (1991). [PubMed] [Google Scholar]
- 40.Jackson E. K., Kochanek S. J., Gillespie D. G., Dipeptidyl peptidase IV regulates proliferation of preglomerular vascular smooth muscle and mesangial cells. Hypertension 60, 757–764 (2012). [DOI] [PMC free article] [PubMed] [Google Scholar]
- 41.Dubinion J. H., Mi Z., Zhu C., Gao L., Jackson E. K., Pancreatic polypeptide-fold peptide receptors and angiotensin II-induced renal vasoconstriction. Hypertension 47, 545–551 (2006). [DOI] [PubMed] [Google Scholar]
- 42.Wharton J., et al., Expression of the human neuropeptide tyrosine Y1 receptor. Proc. Natl. Acad. Sci. U.S.A. 90, 687–691 (1993). [DOI] [PMC free article] [PubMed] [Google Scholar]
- 43.Doods H., et al., BIIE0246: A selective and high affinity neuropeptide Y Y(2) receptor antagonist. Eur. J. Pharmacol. 384, R3–R5 (1999). [DOI] [PubMed] [Google Scholar]
- 44.Wang Y., et al., Activation of NFAT signaling in podocytes causes glomerulosclerosis. J. Am. Soc. Nephrol. 21, 1657–1666 (2010). [DOI] [PMC free article] [PubMed] [Google Scholar]
- 45.Krämer A., Green J., J. Pollard, Jr, Tugendreich S., Causal analysis approaches in ingenuity pathway analysis. Bioinformatics 30, 523–530 (2014). [DOI] [PMC free article] [PubMed] [Google Scholar]
- 46.Zhang L., Bijker M. S., Herzog H., The neuropeptide Y system: Pathophysiological and therapeutic implications in obesity and cancer. Pharmacol. Ther. 131, 91–113 (2011). [DOI] [PubMed] [Google Scholar]
- 47.Hulting J., Sollevi A., Ullman B., Franco-Cereceda A., Lundberg J. M., Plasma neuropeptide Y on admission to a coronary care unit: Raised levels in patients with left heart failure. Cardiovasc. Res. 24, 102–108 (1990). [DOI] [PubMed] [Google Scholar]
- 48.Shah S. H., et al., Neuropeptide Y gene polymorphisms confer risk of early-onset atherosclerosis. PLoS Genet. 5, e1000318 (2009). [DOI] [PMC free article] [PubMed] [Google Scholar]
- 49.Ruohonen S. T., et al., Transgenic mice overexpressing neuropeptide Y in noradrenergic neurons: A novel model of increased adiposity and impaired glucose tolerance. Diabetes 57, 1517–1525 (2008). [DOI] [PubMed] [Google Scholar]
- 50.Macia L., et al., Neuropeptide Y1 receptor in immune cells regulates inflammation and insulin resistance associated with diet-induced obesity. Diabetes 61, 3228–3238 (2012). [DOI] [PMC free article] [PubMed] [Google Scholar]
- 51.Mitchell G. C., Wang Q., Ramamoorthy P., Whim M. D., A common single nucleotide polymorphism alters the synthesis and secretion of neuropeptide Y. J. Neurosci. 28, 14428–14434 (2008). [DOI] [PMC free article] [PubMed] [Google Scholar]
- 52.Pettersson-Fernholm K.et al.; FinnDiane Study Group , Leucine 7 to proline 7 polymorphism in the preproneuropeptide Y is associated with proteinuria, coronary heart disease, and glycemic control in type 1 diabetic patients. Diabetes Care 27, 503–509 (2004). [DOI] [PubMed] [Google Scholar]
- 53.Ma J., et al., Distribution of neuropeptide Y Leu7Pro polymorphism in patients with type 1 diabetes and diabetic nephropathy among Swedish and American populations. Eur. J. Endocrinol. 157, 641–645 (2007). [DOI] [PubMed] [Google Scholar]
- 54.Koulu M., et al., Neuropeptide Y and Y2-receptor are involved in development of diabetic retinopathy and retinal neovascularization. Ann. Med. 36, 232–240 (2004). [DOI] [PubMed] [Google Scholar]
- 55.Zhang L., et al., NFAT2 inhibitor ameliorates diabetic nephropathy and podocyte injury in db/db mice. Br. J. Pharmacol. 170, 426–439 (2013). [DOI] [PMC free article] [PubMed] [Google Scholar]
- 56.Pedigo C. E., et al., Local TNF causes NFATc1-dependent cholesterol-mediated podocyte injury. J. Clin. Invest. 126, 3336–3350 (2016). [DOI] [PMC free article] [PubMed] [Google Scholar]
- 57.Peng R., et al., MiR-30a inhibits the epithelial–mesenchymal transition of podocytes through downregulation of NFATc3. Int. J. Mol. Sci. 16, 24032–24047 (2015). [DOI] [PMC free article] [PubMed] [Google Scholar]
- 58.Wu J., et al., MicroRNA-30 family members regulate calcium/calcineurin signaling in podocytes. J. Clin. Invest. 125, 4091–4106 (2015). [DOI] [PMC free article] [PubMed] [Google Scholar]
- 59.Ailanen L., et al., Peripherally administered Y2-receptor antagonist BIIE0246 prevents diet-induced obesity in mice with excess neuropeptide Y, but enhances obesity in control mice. Front. Pharmacol. 9, 319 (2018). [DOI] [PMC free article] [PubMed] [Google Scholar]
- 60.Wang L., et al., Neuropeptide Y(1) Receptor NPY1R discovery of naturally occurring human genetic variants governing gene expression in cella as well as pleiotropic effects on autonomic activity and blood pressure in vivo. J. Am. Coll. Cardiol. 54, 944–954 (2009). [DOI] [PMC free article] [PubMed] [Google Scholar]
- 61.Michalkiewicz M., Zhao G., Jia Z., Michalkiewicz T., Racadio M. J., Central neuropeptide Y signaling ameliorates N(omega)-nitro-L-arginine methyl ester hypertension in the rat through a Y1 receptor mechanism. Hypertension 45, 780–785 (2005). [DOI] [PubMed] [Google Scholar]
- 62.Dörr O., et al., Neuropeptide Y as an indicator of successful alterations in sympathetic nervous activity after renal sympathetic denervation. Clin. Res. Cardiol. 104, 1064–1071 (2015). [DOI] [PubMed] [Google Scholar]
- 63.Eriguchi M., et al., Renal denervation has blood pressure-independent protective effects on kidney and heart in a rat model of chronic kidney disease. Kidney Int. 87, 116–127 (2015). [DOI] [PubMed] [Google Scholar]
- 64.Rafiq K., et al., Renal sympathetic denervation suppresses de novo podocyte injury and albuminuria in rats with aortic regurgitation. Circulation 125, 1402–1413 (2012). [DOI] [PMC free article] [PubMed] [Google Scholar]
- 65.Strojek K., Grzeszczak W., Górska J., Leschinger M. I., Ritz E., Lowering of microalbuminuria in diabetic patients by a sympathicoplegic agent: Novel approach to prevent progression of diabetic nephropathy? J. Am. Soc. Nephrol. 12, 602–605 (2001). [DOI] [PubMed] [Google Scholar]
- 66.Schmid H.et al.; European Renal cDNA Bank (ERCB) Consortium , Modular activation of nuclear factor-kappaB transcriptional programs in human diabetic nephropathy. Diabetes 55, 2993–3003 (2006). [DOI] [PubMed] [Google Scholar]
- 67.Martini S.et al.; European Renal cDNA Bank; C-PROBE Cohort; CKDGen Consortium , Integrative biology identifies shared transcriptional networks in CKD. J. Am. Soc. Nephrol. 25, 2559–2572 (2014). [DOI] [PMC free article] [PubMed] [Google Scholar]
- 68.Nair V., et al., A molecular morphometric approach to diabetic kidney disease can link structure to function and outcome. Kidney Int. 93, 439–449 (2018). [DOI] [PMC free article] [PubMed] [Google Scholar]
- 69.Saleem M. A., et al., A conditionally immortalized human podocyte cell line demonstrating nephrin and podocin expression. J. Am. Soc. Nephrol. 13, 630–638 (2002). [DOI] [PubMed] [Google Scholar]
- 70.Keir L. S., et al., Generating conditionally immortalised podocyte cell lines from wild-type mice. Nephron 129, 128–136 (2015). [DOI] [PubMed] [Google Scholar]
- 71.Armstrong S. P., Caunt C. J., Fowkes R. C., Tsaneva-Atanasova K., McArdle C. A., Pulsatile and sustained gonadotropin-releasing hormone (GnRH) receptor signaling: Does the Ca2+/NFAT signaling pathway decode GnRH pulse frequency? J. Biol. Chem. 284, 35746–35757 (2009). [DOI] [PMC free article] [PubMed] [Google Scholar]
- 72.Hurcombe J. A., et al., Podocyte GSK3 is an evolutionarily conserved critical regulator of kidney function. Nat. Commun. 10, 403 (2019). [DOI] [PMC free article] [PubMed] [Google Scholar]
Associated Data
This section collects any data citations, data availability statements, or supplementary materials included in this article.
Supplementary Materials
Data Availability Statement
All data related to this study are included either in the paper, SI Appendix, or from the corresponding author upon reasonable request. Detailed methods are provided in SI Appendix. The phospho-/total proteomics data will be deposited in the PRoteomics IDEntification repository as part of the ProteomeXchange Consortium.


