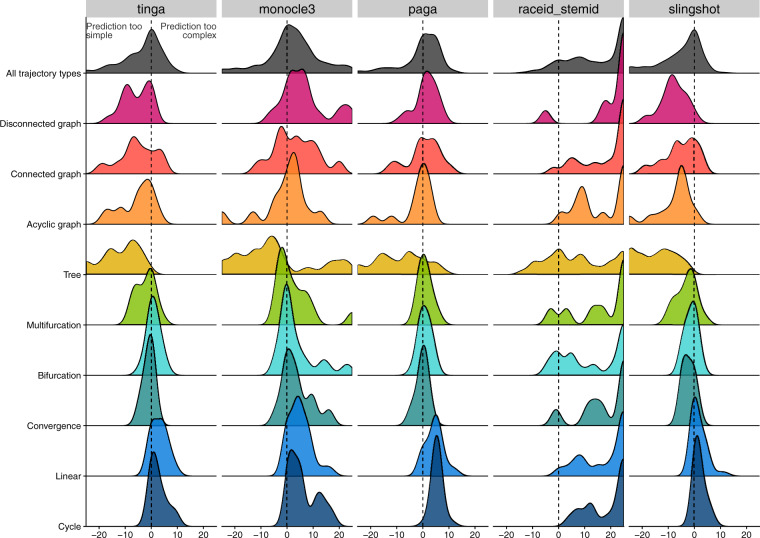
Fig. 11.
The bias between the topology returned by a method and the ground truth topology is represented for each trajectory type (represented in rows), and for each method (represented in columns). This bias was computed as the difference in the number of nodes + the number of edges in the graph returned by a method compared to the ground truth. The dotted vertical lines represent a perfect match between a method’s and the ground truth topologies. The fact that a method’s results are on the right of the dotted line show us that this method tends to return too complex topologies compared to the real topology. Conversely, methods for which we observe results on the left of the dotted line tend to return too simple topologies

