

Abstract
Motivation
Predicting drug–target interactions (DTIs) using human phenotypic data have the potential in eliminating the translational gap between animal experiments and clinical outcomes in humans. One challenge in human phenome-driven DTI predictions is integrating and modeling diverse drug and disease phenotypic relationships. Leveraging large amounts of clinical observed phenotypes of drugs and diseases and electronic health records (EHRs) of 72 million patients, we developed a novel integrated computational drug discovery approach by seamlessly combining DTI prediction and clinical corroboration.
Results
We developed a network-based DTI prediction system (TargetPredict) by modeling 855 904 phenotypic and genetic relationships among 1430 drugs, 4251 side effects, 1059 diseases and 17 860 genes. We systematically evaluated TargetPredict in de novo cross-validation and compared it to a state-of-the-art phenome-driven DTI prediction approach. We applied TargetPredict in identifying novel repositioned candidate drugs for Alzheimer’s disease (AD), a disease affecting over 5.8 million people in the United States. We evaluated the clinical efficiency of top repositioned drug candidates using EHRs of over 72 million patients. The area under the receiver operating characteristic (ROC) curve was 0.97 in the de novo cross-validation when evaluated using 910 drugs. TargetPredict outperformed a state-of-the-art phenome-driven DTI prediction system as measured by precision–recall curves [measured by average precision (MAP): 0.28 versus 0.23, P-value < 0.0001]. The EHR-based case–control studies identified that the prescriptions top-ranked repositioned drugs are significantly associated with lower odds of AD diagnosis. For example, we showed that the prescription of liraglutide, a type 2 diabetes drug, is significantly associated with decreased risk of AD diagnosis [adjusted odds ratios (AORs): 0.76; 95% confidence intervals (CI) (0.70, 0.82), P-value < 0.0001]. In summary, our integrated approach that seamlessly combines computational DTI prediction and large-scale patients’ EHRs-based clinical corroboration has high potential in rapidly identifying novel drug targets and drug candidates for complex diseases.
Availability and implementation
nlp.case.edu/public/data/TargetPredict.
1 Introduction
Computational approaches have been developed to predict drug–target interactions (DTIs) (Chen et al., 2016). Computational-based approaches often predicted DTIs from chemical similarities (Bleakley and Yamanishi, 2009; Chen et al., 2012, 2016; Gönen, 2012; He et al., 2010; Keiser et al., 2009; Shi et al., 2015; Wang et al., 2013, 2014; Yamanishi et al., 2008) and genomic profiles (Cheng et al., 2012; Chu and Chen, 2008; Cobanoglu et al., 2013; Lu et al., 2017; Sawada et al., 2018; Wang and Zeng, 2013; Yuan et al., 2016). Phenome data were clinically observed from the human, therefore, can offer unique opportunities for novel DTI identification. Drug phenome-based approaches using drug–side effects (SEs) have demonstrated high potential in identifying novel DTIs (Campillos et al., 2008; Zhou et al., 2019). We have recently developed a novel drug–side effect context-sensitive network (DSE-CSN)-based approach to model the context-specific interactions amongst drugs and their associated SEs (Zhou et al., 2019). We demonstrated that the DSE-CSN-based approach had significantly higher performance in DTI prediction as compared to the traditional drug phenome network-based approach. In this study, we propose a significantly improved drug-target prediction approach (TargetPredict) by incorporating a large amount of human phenotype data that we extracted from tens of millions of research articles, patient health data and other free-text documents (Xu and Wang, 2013; Zheng and Xu, 2018).
TargetPredict incorporated 855 904 phenotypic and genetic relationships among 1430 drugs, 4251 SEs, 1059 diseases and 17 860 genes (Fig. 1), including a disease comorbidity network (DCN) constructed from the 6 480 372 patient reports in FDA Adverse Event Reporting System (FAERS) (Zheng and Xu, 2018), and TreatKB, a comprehensive drug–disease treatment knowledge source constructed using natural language processing from 21 million published biomedical research articles (Xu and Wang, 2013). The complex relationships were modeled simultaneously using our CSN-based model. The CSN-based model has been validated in predicting DTIs, disease-associated genes and disease-related food metabolites (Chen and Xu, 2017, 2019; Zhou et al., 2019). Our previous study showed that the CSN-based model, which preserves the semantic drug–SE relationships, showed higher performance compared to traditional similarity score-based approach in DTI predictions (Zhou et al., 2019).
Fig. 1.

TargetPredict: an integrated phenome-driven drug-target prediction system
We used Alzheimer’s disease (AD) as an example to demonstrate that the predicted DTIs have the potential to guide drug discovery. AD is one of the leading causes of dementia in the elderly population, affecting over 5.8 million people in the United States (Association, 2019). Currently, there exists no cure for AD. The FDA-approved medications, such as cholinesterase inhibitors, can only stabilize the AD’s symptoms for a limited time (Hoie, 2019). Therefore, there is an urgent need to discover novel drug therapies for AD. We interrogated DTI predictions with known AD genetics to identify repositioned drug candidates. If a drug d is predicted to have a new off-target gene g, which is known to be involved in AD, we then tested if patients taking drug d has lower risk of AD. We performed retrospective case–control studies using patients’ electronic health records (EHRs). Currently, we have access to de-identified and population-level EHRs of over 72 million unique patients (20% of the US population from 360 hospitals and 317 000 providers across all 50 states). The EHRs can be accessed from IBM Watson Health Explorys database using Explorys Cohort Discovery (IBM, 2020). Recent studies showed that with unique EHRs and built-in informatics tools, knowledge-driven hypotheses can be evaluated among diverse real-world patient populations with minimum efforts (Elangovan et al., 2018; Kaelber et al., 2012; Patel and Kaelber, 2014). Our most recent study using this aggregated patients’ EHRs from Explorys showed that tumor necrosis factors (TNF) blocking agents (etanercept, adalimumab and infliximab) are significantly associated with reduced risk of AD and dementia in patients with systemic inflammatory diseases (Zhou et al., 2020).
In summary, this study significantly improves our previous phenome-driven DTI prediction algorithm and extends it for drug discovery by (i) integrating additional human phenotypic data mined from public literature, patient health data and other free-text documents; (ii) identifying candidate drugs by interrogating DTI prediction with known disease genetics and (iii) corroborating top candidate drugs using large-scale patients’ EHRs.
2 Materials and methods
Figure 2 shows the outline of our experiments: (i) we constructed TargetPredict system that consists of 855 904 edges, 1430 drug nodes, 4251 SE nodes, 1059 disease nodes and 17 860 gene nodes; (ii) we predicted DTIs using a standard network-based ranking algorithm and evaluated the prediction ability in de novo cross-validation setting using known drug targets and (iii) we identified repositioned candidate drugs by interrogating predicted drug targets with known AD genetics, and evaluated the clinical efficiency of top candidates using EHRs of over 72 million patients.
Fig. 2.

Outline of the experiments
2.1 Construction of TargetPredict
2.1.1 Context-sensitive phenotypic drug network (DSE-CSN)
We constructed a drug–side effect context-sensitive network (DSE-CSN) as in our previous study (Zhou et al., 2019). The drug–SE pairs were downloaded from Side Effect Resource (SIDER) (Kuhn et al., 2016). DSE-CSN consists of 1430 drug nodes, 4251 SE nodes and 145 321 edges between drugs and SEs. Drug and SE terms were mapped their UMLS Concept Unique Identifiers (CUIs) using MetaMap (2018 V2 release) (MetaMap, 2018). A drug name or an SE term can only be mapped to a unique concept or CUI. Drug nodes on DSE-CSN are not directly connected; instead, they are connected indirectly through shared SEs.
2.1.2 Disease comorbidity network
DCN was built based on 6 480 372 patient health reports using data mining techniques (Zheng and Xu, 2018). DCN includes 1059 disease nodes and 12 608 edges. Disease names on DCN have been mapped to the UMLS CUIs using MetaMap (2016 V2 release) (Zheng and Xu, 2018).
2.1.3 Drug–disease treatment knowledge base
We used drug–disease treatment relationships to connect DSE-CSN to DCN. In our previous studies, we constructed TreatKBs, which include 111 862 drug–disease pairs (1336 drugs and 8046 diseases) extracted from records of 4.8 million patients in FAERS (Xu and Wang, 2014), 9216 drug–disease pairs (1483 drugs and 1381 diseases) extracted from 44 000 FDA drug labels (Xu and Wang, 2014), 34 305 pairs (1560 drugs and 7970 diseases) extracted from 21 million MEDLINE abstracts (Xu and Wang, 2013) and 69 724 pairs (1286 drugs and 11 848 diseases) from 180 000 clinical trial studies (Xu and Wang, 2013). All the terms in TreatKB have already been mapped to UMLS CUIs. Drug nodes on DSE-CSN are connected to disease nodes on DCN based on the drug–disease associations in TreatKB.
2.1.4 Connect phenome networks with a protein–protein interaction network
DSE-CSN and DCN were connected to a protein–protein interaction network (PPIN) through known drug-gene and disease-gene associations. PPIN was constructed using protein–protein interactions from STRING database (Szklarczyk et al., 2015). PPIN consisted of 17 860 gene nodes and 689 674 undirected and unweighted edges. We used a cutoff of 400, which is a middle point for PPI association scores ranging from 100 to 900. We used the combined score from STRING database, which were computed by combining the probabilities from the different information sources (e.g. experiments, pathway knowledge bases, text mining) and corrected for the probability of observing an interaction by random (Szklarczyk et al., 2015). This choice of cutoff value and data resource was based on our previous experience in using PPIN in both disease genetics prediction and drug discovery. We found that a too low cutoff could introduced lots of noises, and a too-high cutoff could remove some true signals. The reason for using combined data resources is that these data resources are largely complementary. Drug nodes on DSE-CSN were connected to genes on PPIN using 4142 DTIs from the DrugBank database (Wishart et al., 2008). Disease nodes on DCN were connected to gene nodes on PPIN using 1602 disease-gene associations from Online Mendelian Inheritance in Man (OMIM) (Hamosh et al., 2004). We also experimented with connecting SE nodes on DSE-CSN to gene nodes on PPI using disease-gene associations from OMIM.
2.2 Predict potential DTIs from TargetPredict
The input to TargetPredict is a drug and output is a ranked list of genes. We applied the standard random walker with restart network ranking algorithm (Li and Patra, 2010), which we previously applied this algorithm to predict disease genes (Chen and Xu, 2016; Chen et al., 2015b), drug targets (Zhou et al., 2019) and repositioned drug candidates (Xu and Wang, 2015, 2016). Given an input drug as the seed, the algorithm estimated the probability scores of each gene being reached from the seed. The probability vector at each step is represented by
| (1) |
in which denotes the initial score vector, denotes the score vector of the t-th step and α denotes the probability of restarting from the seed node. The algorithm stopped until the difference between the two steps ( norm) fall below .
We used G, D and P to represent the heterogeneous network consisting of PPIN, DSE-CSN and DCN. T denotes the transition matrix of the entire network, which includes three intra-network transition matrices on the diagonal and six inter-network transition matrices on the off-diagonal:
| (2) |
represents the corresponding adjacency matrices. We regulated the movements of the random walker between any two networks among DSE-CSN, DCN and PPIN with the jumping probability λxy . For example, if the walker stands on a node on DSE-CSN, which is connected with both DCN and PPIN, it has the option to move to DCN with the probability of λDP, move to PPIN with the probability of λDG or stay within DSE-CSN with the probability of .
The intra-network transition matrices on the diagonal were calculated in (3), which normalized the intra-adjacency matrix of a network , and weighted the matrix with the probability of stay within the network:
| (3) |
The inter-network transition matrices on the off-diagonal were calculated in (4), which normalized the inter adjacency matrix of a bipartite network and weighted the matrix with the probability of moving between the network x and y:
| (4) |
2.3 Investigate the effects of each knowledge base and different configurations of TargetPredict on DTI predictions
We investigated the effects of each knowledge base and different configurations TargetPredicted. We first connected DSE-CSN to DCN through randomly generated drug–disease treatment associations. To generate such random connections, we kept all the drug nodes and disease nodes unchanged but diseases are randomly connected to each drug. We also replaced DCN with a randomized DCN. To generate such a random network, we kept all diseases nodes and total number of edges unchanged but diseases are randomly connected with each other. We next built four TargetPredict systems to investigate how different configurations of connecting DSE-CSN with DCN and PPIN affect the overall performance of DTI prediction. The first TargetPredict system used drug–disease treatment pairs from FDA labels to connect drug nodes on DSE-CSN to disease nodes on DCN. The second TargetPredict system used drug–disease treatment pairs from FAERS to connect drug nodes on DSE-CSN to disease nodes on DCN. The third TargetPredict linked SE nodes to disease nodes on the first TargetPredict model if they represent the same concept. The fourth TargetPredict added the connections between SE nodes and gene nodes on the first TargetPredict model through known disease-gene associations from the OMIM database.
2.4 Evaluation and comparison
The major advantage of phenome-driven drug-target prediction approaches is that they can predict novel genetic target for drugs without known targets. Thus, we conducted the de novo cross-validation, instead of leave-one-out validation, to evaluate how TargetPredict perform in predicting novel drug targets. We tested all of the 910 drugs with known DTIs on DSE-CSN. For each of the 910 drugs, we removed all its known connections to target genes and evaluated if TargetPredict could predict the removed links back and ranked them highly. We also compared TargetPredict to our previous DSE-CSN-based DTI prediction system (Zhou et al., 2019) in the de novo cross-validation setting.
We plotted the receiver operating characteristic (ROC) curve to evaluate the performance of TargetPredict. We used 11-point interpolate precision–recall (PR) curves to compare the prediction performance among different systems. For highly skewed data, which is true for any DTI prediction task, PR curves are more accurate than ROC curves in comparing different prediction algorithms (Davis and Goadrich, 2006; Davis et al., 2005). The overall performance was measured by average precision (MAP) (approximates the area under the curve) of PR curve (Manning et al., 2008).
The selection of parameters may influence the overall performance of network-based ranking algorithms, including the probability of restart from the seed node α and the transition probability among sub-networks. For example, λDG between DSE-CSN and PPIN. TargetPredict and DSE-CSN-based prediction system shared DSE-CSN and PPIN. To assure fair comparison, we regulated the common parameters between TargetPredict and DSE-CSN-based system (α, λGD and λDG) in the de novo cross-validation. We first fixed other parameters and changed α from 0.1 to 0.9. Then we fixed other parameters and changed λDG from 0.1 to 0.7. Next, we fixed other parameters and changed λGD from 0.1 to 0.7. Figure 3 indicates that the DSE-CSN-based system achieved the optimal performance when λDG was set to 0.3, λGD to 0.7 and α to 0.9. TargetPredict outperformed DSE-CSN’s optimal performance when α is greater than 0.3, λDG falls between [0.3, 0.7] and λGD falls between [0.1, 0.3]. We set the jumping probability λDP as 0.1, λDG as 0.3, λPD as 0.7, λPG as 0.1, λGD and λGP as 0.3 and α as 0.7 for TargetPredict. We used these parameters combination for the subsequent analysis.
Fig. 3.

(a) Mean average precision versus the probability of restarting from the seed and (b) mean average precision versus the transition probability from DSE-CSN to PPIN (c) mean average precision versus the transition probability from PPIN to DSE-CSN
2.5 Large-scale EHRs-based clinical corroboration for AD drug repositioning
We used AD as an example to demonstrate that our predicted DTIs have the potential to guide drug discovery. We downloaded 679 AD-associated genes from the AlzGene database (Bertram et al., 2007). For each drug, we set the drug as the seed node and predicted its novel targets using TargetPredict. TargetPredict outputs the probability scores of each gene of being reached from the drug seed. We sum up the probability scores for AD-associated genes for each drug and prioritize all the 1430 drugs based on the sum of scores.
2.5.1 Database description
We performed large-scale retrospective case–control studies to demonstrate that drugs identified using TargetPredict has the potential to benefit real-word AD patients. The de-identified EHR data for patients with age over 65 years old are used as AD is a disease prevalent in elderly population. Explorys collected patient information including disease diagnoses history, drug use history, laboratory test results, demographics, procedures and finding from multiple health information systems. The data were normalized using standard biomedical terminologies from UMLS (Bodenreider, 2004). Specifically, the disease names were normalized with Systematized Nomenclature of Medicine-Clinical Terms, a health terminology standard in US Federal Government systems for the efficient exchange of interoperable EHRs (Shahpori and Doig, 2010). Individual drug names were normalized with RxNorm, a standard nomenclature for clinical drugs developed by the US National Library of Medicine (Nelson et al., 2011). Laboratory tests were normalized by logical observation identifier names and codes (McDonald et al., 2003). At the time of the study, the Explorys Cohort Discovery platform contained over 72 million unique patients among which over 17 million were over 65 years.
2.5.2 Study population
We investigated if patients who were prescribed the top 30 drug candidates have lower risks of AD or the border diagnose of dementia. We first identified all patients aged over 65 years. For a candidate drug D1, we extracted patients with a diagnose code of its original treatment disease P1 as the study cohort. The study cohort was further separated as the drug group and no-drug group. The drug group included patients with P1 and prescribed D1. The no-drug group is patients with P1 but with no records of prescribing D1. Considering the possibility of misdiagnosis of AD in the EHR database, we used both AD and the broader diagnosis of dementia (including AD) as the outcomes. Among patients over 65 years, 334 750 of them have a diagnosis code of AD, 883 260 of them have a broader diagnosis of dementia. Similar methods were used to identify patients with other disease diagnosis codes. Patients who prescribed a drug were identified by searching the generic drug names from RxNorm.
2.5.3 Statistical analysis
We calculated the risk associations of candidate drugs with AD as we did in our previous study (Zhou et al., 2020). The associations between candidate drugs and risks of AD/dementia were estimated by odds ratios of AD/dementia over drug use groups versus non-drug use groups. Due to the fact that we do not have access to patient-level data, the adjusted odds ratios (AORs), 95% confidence intervals (CIs) and P-values were calculated using Cochran–Mantel–Haenszel (CMH) method by controlling for confounding factors including age, gender and race. To compute AOR, we first compute the OR of each of the 24 strata (tabulation of two genders: female and male, two races: Caucasian and non-Caucasian, six age groups: 65–69, 70–74, 75–79, 80–84, 85–89, over 90), then weighted average across all strata. A P-value < 0.05 (two-sided) was considered as statistical significance. Among the top 30 drugs, we excluded drugs that do not have enough prescribers (e.g. rarely used drugs) to performed the CMH analysis (at least one element in the contingency table is <10 at all strata). Among the top 30 drugs, 10 were excluded for dementia and 14 were excluded for AD.
3 Results
3.1 Performance measure and comparison as measured by ROC curve
TargetPredict achieved a high area under the curve (AUC) of 0.97 (Fig. 4). ROC curves, however, did not show a clear advantage of TargetPredict compared to the DSE-CSN-based system. In this study, the number of negative examples (genes not targeted by drugs) greatly surpasses the number of positive examples (known drug targets). The ROC curves usually overestimate the performance for highly skewed datasets (Davis and Goadrich, 2006). Thus, there are two potential reasons for similar ROC curves between TargetPredict and DSE-CSN-based system: (i) the prediction ability of the two models is similar and (ii) the highly skew data obscured the difference of prediction ability between these two models.
Fig. 4.
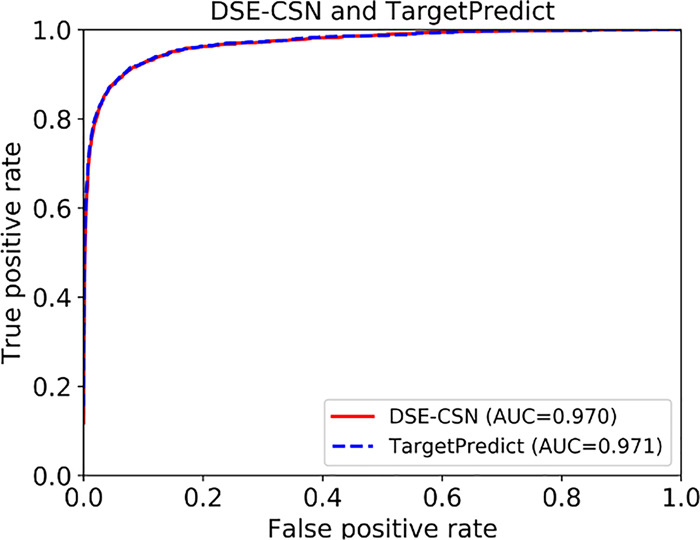
ROC curves of TargetPredict and DSE-CSN-based system
3.2 Performance measure and comparison as measured by PR curves
We then used PR curves to compare TargetPredict with the DSE-CSN-based system. Figure 5a shows the performance of TargetPredict, which connects drug nodes to disease nodes using the FDA-approved drug–disease treatment pairs, and compared it to DSE-CNS approach. The PR curves show that the MAP of TargetPredict is 0.28, which is significantly higher than the DSE-CSN-based system (MAP = 0.23, P-value < 0.0001). To investigate the effects of drug–disease treatment relationships on the overall performance, we connected DSE-CSN to DCN through randomly generated drug–disease treatment associations. PR curves in Figure 5a show that TargetPredict with random drug–disease connections yielded an MAP of 0.20, which is significantly lower than that using the drug–disease treatment relationships from FDA labels (P-value < 0.0001). These results demonstrated that integrating disease comorbidity with drug–SE information through FDA-approved drug–disease treatment pairs can significantly improve DTI predictions. We also generated a random DCN on which the disease nodes are randomly connected. However, due to the high connection of DCN, we did not observe a significant influence of random DCN.
Fig. 5.

The PR curves between TargetPredict and DSE-CSN-based system
Drug–disease treatment pairs mined from FAERS are more comprehensive but noisier than those extracted from FDA drug labels. We observed in Figure 5b that TargetPredict using drug–disease treatment pairs from FAERS had better performance than DSE-CSN system (MAP: 0.26 versus 0.23, P-value < 0.0001), but lower performance than that using the drug–disease treatment pairs from FDA labels (MAP: 0.28 versus 0.23, P-value < 0.0001). These results demonstrated that connecting DSE-CSN to DCN through highly accurate drug–disease treatment relationships is important for DTI predictions.
We then investigated if connecting SEs to diseases or genes can further improve the performance. Figure 6a shows that connecting SEs with disease nodes on TargetPredict using the same UMLS CUIs did not significantly improve the prediction ability. This may be due to the fact that not many SE nodes on DSE-CNS can be mapped to disease nodes on DCN. Figure 6b shows that connecting SEs to genes yielded lower performance. This may be caused by the uncertain associations between SEs and genes from existing disease genetics databases as well as the noisy nature of drug–SE associations from SIDER. This suggests that while integrating more data (data quantity) can include more information; DTI prediction would also depend on data accuracy or data quality.
Fig. 6.

(a)The PR curves between TargetPredict (SE to disease) and TargetPredict build from FDA-approved drug–disease treatment pairs. (b) The PR curves compared TargetPredict (SEs to genes) and TargetPredict build from FDA-approved drug–disease treatment pairs
3.3 TargetPredict has the potential to identify novel drug therapies for AD
We used TargetPredict (constructed using drug–disease treatment pairs from FDA labels) to perform target-based drug repositioning toward AD. The top 30 ranked drugs are listed in Table 1. Among the top 30 drugs, rivastigmine has been approved for the treatment of dementia associated with AD or Parkinson’s disease. Donepezil has been approved for palliation of Dementia of the Alzheimer’s type. In addition, six of the top-ranked drugs have been tested in clinical trials for treating AD. These results further confirmed the validity of our drug discovery strategy by interrogating genetic drug targets predicted by TargetPredict with known disease genetics.
Table 1.
Top 30-ranked repositioned drug candidates
| Rank | Drug name | Original indication | Evidence |
|---|---|---|---|
| 1 | Malathion | Head lice | |
| 2 | Echothiophate | Angle-closure glaucoma | |
| 3 | Rivastigmine | Dementia | FDA-approved |
| 4 | Edrophonium | Muscle relaxants | |
| 5 | Pralidoxime | Nerve agent poisoning | |
| 6 | Pravastatin | Hypercholesterolemia | |
| 7 | Fluvastatin | Hypercholesterolemia | |
| 8 | Neostigmine | Myasthenia gravis | |
| 9 | Rosuvastatin | Hyperlipidemia | |
| 10 | Pyridostigmine | Myasthenia gravis | |
| 11 | Lorcaserin | Obesity | |
| 12 | Disulfiram | Alcohol dependence | |
| 13 | Gemfibrozil | Hyperlipidemia | NCT02045056 |
| 14 | Donepezil | AD | FDA-approved |
| 15 | Bacitracin | Bacterial infections | |
| 16 | Sulfamethoxazole | Bacterial infectious | |
| 17 | Aliskiren | Hypertension | |
| 18 | Anastrozole | Breast cancer | |
| 19 | Physostigmine | Glaucoma | |
| 20 | Exemestane | Breast cancer | |
| 21 | Letrozole | Breast cancer | |
| 23 | Prednisone | Inflammation | NCT00000178 |
| 24 | Testolactone | Breast cancer | |
| 25 | Varenicline | Nicotine dependence | NCT00744978 |
| 26 | Pioglitazone | Type 2 diabetes | NCT01931566 |
| 27 | Dipivefrin | Glaucoma | |
| 28 | Liraglutide | Type 2 diabetes | NCT01843075 |
| 29 | Abiraterone | Prostate cancer | |
| 30 | Etoricoxi | Osteoarthritis |
Note: NCT**: AD drugs from clinical trials. FDA-approved AD drugs are highlighted in bold.
To further test the clinical efficiency of top-ranked drug candidates, we performed retrospective case–control studies using patients’ EHRs data. The AORs, 95% CIs and P-values were plotted in Figures 7 and 8. The vertical line where AOR equals 1 suggests that there is no association between drug use and AD (or dementia). The right to the vertical reference line suggests that the odds of AD/dementia is higher for drug group than for no-drug group, and the left to the vertical reference line suggests that the odds of AD/dementia is lower for the drug than for the no-drug group.
Fig. 7.

The effects of top-ranked drugs for AD
Fig. 8.

The effects of top-ranked drugs for Dementia
Among the top drugs studied, Figure 6 showed the potential clinical efficiency for preventing or treating AD (AOR < 1.0, P-value < 0.05). For example, liraglutide was previously approved to treat type 2 diabetes. Among senior patients with type 2 diabetes, odds of being diagnosed with AD was 24% lower [AOR: 0.76; 95% CI (0.70, 0.82), P-value < 0.0001] among patients prescribed liraglutide compared with those who did not prescribe the drug after controlling age, gender and races (Fig. 7). The potential benefit of liraglutide was replicated in patients with a diagnosis code of dementia [AOR: 0.80; 95% CI (0.77, 0.84), P-value < 0.0001]. Interestingly, a study showed that liraglutide indeed prevented the loss of brain insulin receptors, an import feature of the AD brain and reversed memory impairment in both mice and non-human primates (Batista et al., 2018). These results indicate that TargetPredict has potential in identifying novel candidate anti-AD drugs, which have both clinical efficacy evidence gathered from real-world AD patients and interpretable mechanisms of action (e.g. liraglutide ≥ GLP1R ≥ AD).
We also identified that pravastatin and fluvastatin associated with a higher risk of AD and dementia (Figs 7 and 8). Previous meta-analysis suggested that statins associated with reduced risk of AD and dementia (Chu et al., 2018). Fluvastatin and pravastatin belong to a subtype of statins called hydrophilic statins (Laufs et al., 2017). The associations between hydrophilic statin use and risk of AD (or dementia) are inconsistent across different studies. For example, a study using 6992 patients suggested that hydrophilic statins do not significantly associate the risk of AD (Haag et al., 2009). Some studies showed that hydrophilic statins users have higher risks of AD compared to lipophilic statins users (Lin et al., 2015). In fact, meta-analysis suggested that the association between hydrophilic statins and risk of AD is relatively weak (Adjusted Relative Risk = 0.619; CI = 0.383–1.000; P = 0.050) (Chu et al., 2018). Previous observation studies tend to have a limited sample size, which could bias the results. The advantage of our study is that we studied the drug outcomes using EHRs of 72 million unique patients including 63 million adults and seniors (20% of US population across 50 states), which overcame many of the limitations from traditional epidemiological studies due to small sample sizes, high sampling errors and high sample selection bias that impeded their generalizability. We believe that our study may provide more robust evidence supporting the risk associations of pravastatin and fluvastatin with AD.
Our top-ranked drugs also included some drugs that do not significantly associated AD. For example, TargetPredict ranked prednisone, a drug used to treat rheumatoid arthritis (RA), on top 23. In our patients’ EHRs analysis, among patients diagnosed with RA, prescription of prednisone did not significantly associate with risk of AD diagnosis [AOR: 1.01; 95% CI (0.97, 1.04); P-value = 0.74]. A clinical trial study also failed to show the benefits of prednisone in cognitive decline in AD patients (Aisen et al., 2000). Since the genetic mechanisms underlying AD are not fully revealed, genes from AlzGene database may not be the true underlying genes (Bertram et al., 2007). Therefore, drugs target genes from AlzGene may not truly target the genetic mechanisms of AD. One of our naturally future direction is to develop drug repositioning methods that allows us to predict diseases with unknown mechanisms.
4 Discussion
In this study, we developed an integrated computational drug discovery approach by seamlessly combining DTI prediction and clinical corroboration. We demonstrated that TargetPredict performed better than the state-of-the-art phenome-driven system. We investigated the potential of TargetPredict in novel drug repositioning for AD by interrogating predicted drug targets with AD genetics. We evaluated the clinical efficiency of top repositioned drug candidates using EHRs of over 72 million patients.
Our study can be further improved. First, we evaluated TargetPredict for 910 drugs in a de novo validation scheme using known drug-target associations. The de novo validation is more stringent than leave-one-out validation in evaluating the de novo prediction power of an algorithm. In addition, our EHR-based corroboration in some degree tested TargetPredict’s potential in identifying novel drug targets. However, to further evaluate how this system performs in identifying truly novel drug off-targets will need experimental testing.
Second, EHRs from Explorys Cohort Discovery are de-identified population-level data. Patient-level information like exact age at diagnosis, duration of treatment or years of follow up are not accessible. In this study, we were not able to constrain the time windows between disease diagnosis and drug use in this study. We will need further evaluate the top candidate drugs in cohort studies using patient-level data.
Third, the TargetPredict model also has limitations. For example, the DCN was constructed using the disease characteristics of patients from FAERSs. The medications and reported drug-related adverse events were not used in constructing the DCN. The disease commodity network constructed from FAERS can be further improved by information from other data resources, including EHRs, biomedical literature, among others. For example, Hidalgo et al. (2009) constructed a DCN using 3 years of Medicare claims of 30 million Americans. This network captures disease comorbidity relationships in specific race and gender groups. The limitation is that the data only included patients 65 years or older (Hidalgo et al., 2009). In another study, Jensen et al. (2014) identified the temporal disease comorbidities from 6.2 million patients’ data in Denmark. The data sources are less population biased and capture the temporal disease progression. However, the disease comorbidity was identified using relative risks, which may lead to an intrinsic bias toward rare diseases (Chen et al., 2015a). In the future, we would like to develop methods to integrate disease phenotypic information extracted from different sources to compensate for the limitations of each single knowledge base. For example, for rare diseases, we would set more weights from comorbidity relationships extracted from FAERS. Another future direction is that we will experiment with adding disease-gene associations from Genome-Wide Association Studies (GWAS) data to the entire network. Currently, we used disease-gene associations from OMIM instead of GWAS to connect disease nodes on DCN to PPIN because that disease-gene associations from OMIM are much stronger (often are causal) than those from GWAS and there are more diseases in OMIM database as compared to GWAS. We will investigate methods to incorporate GWAS data by experimenting with different weighting schemes. For example, we can make the random walker less likely to jump to the GWAS-based disease-gene network as compared to the OMIM-based network. We will also investigate methods or further data resources to weight disease-gene association strengths from GWAS data, which may provide more robust ways to incorporate GWAS data.
Last but not least, we demonstrated the potential of TargetPredict for AD drug discovery by seamlessly integrating our drug-target discovery with patients’ EHRs-based clinical corroborations. TargetPredict platform included 1430 approved drugs and the Explorys database includes patients with the diagnosis of tens of thousands for diseases. Currently, we are applying this strategy for drug discovery for other diseases, including schizophrenia, depression, cancers and substance addiction. However, how our system performs for a specific disease will depend on how much disease-relevant data and knowledge included in TargetPredict as well as the number of patients with the disease included in the Explorys database.
Acknowledgements
R.X. conceived the study. M.Z., C.Z. and R.X. designed the experiment. M.Z. performed the experiment and wrote the manuscript.
Funding
M.Z., C.Z. and R.X. are supported by the Eunice Kennedy Shriver National Institute of Child Health & Human Development of the National Institutes of Health under the NIH Director’s New Innovator award number DP2HD084068 (Xu), National Institute of Aging (1 R01 AG057557-01, Xu), National Institute of Aging (1 R01 AG061388-01, Xu), National Institute of Aging (1 R56 AG062272-01, Xu), American Cancer Society Research Scholar Grant (RSG-16-049-01-MPC, Xu) and NIH Clinical and Translational Science Collaborative of Cleveland (1UL1TR002548-01, Konstan).
Conflict of Interest: none declared.
References
- Aisen P.S. et al. (2000) A randomized controlled trial of prednisone in Alzheimer’s disease. Neurology, 54, 588–588. [DOI] [PubMed] [Google Scholar]
- Association, A. (2019) 2019 Alzheimer’s disease facts and figures. Alzheimer’s Dementia, 15, 321–387. [Google Scholar]
- Batista A.F. et al. (2018) The diabetes drug liraglutide reverses cognitive impairment in mice and attenuates insulin receptor and synaptic pathology in a non-human primate model of Alzheimer’s disease. J. Pathol., 245, 85–100. [DOI] [PMC free article] [PubMed] [Google Scholar]
- Bertram L. et al. (2007) Systematic meta-analyses of Alzheimer disease genetic association studies: the AlzGene database. Nat. Genet., 39, 17–23. [DOI] [PubMed] [Google Scholar]
- Bleakley K., Yamanishi Y. (2009) Supervised prediction of drug–target interactions using bipartite local models. Bioinformatics, 25, 2397–2403. [DOI] [PMC free article] [PubMed] [Google Scholar]
- Bodenreider O. (2004) The unified medical language system (UMLS): integrating biomedical terminology. Nucleic Acids Res., 32, 267D–270D. [DOI] [PMC free article] [PubMed] [Google Scholar]
- Campillos M. et al. (2008) Drug target identification using side-effect similarity. Science, 321, 263–266. [DOI] [PubMed] [Google Scholar]
- Chen Y., Xu R. (2016) Phenome-based gene discovery provides information about Parkinson’s disease drug targets. BMC Genomics, 17, 493. [DOI] [PMC free article] [PubMed] [Google Scholar]
- Chen Y., Xu R. (2017) Context-sensitive network-based disease genetics prediction and its implications in drug discovery. Bioinformatics, 33, 1031–1039. [DOI] [PMC free article] [PubMed] [Google Scholar]
- Chen Y., Xu R. (2019) Context-sensitive network analysis identifies food metabolites associated with Alzheimer’s disease: an exploratory study. BMC Med. Genomics, 12, 17. [DOI] [PMC free article] [PubMed] [Google Scholar]
- Chen X. et al. (2012) Drug–target interaction prediction by random walk on the heterogeneous network. Mol. Biosyst., 8, 1970–1978. [DOI] [PubMed] [Google Scholar]
- Chen Y. et al. (2015. a) Disease comorbidity network guides the detection of molecular evidence for the link between colorectal cancer and obesity. AMIA Summits Transl. Sci. Proc., 2015, 201. [PMC free article] [PubMed] [Google Scholar]
- Chen Y. et al. (2015. b) Phenome-driven disease genetics prediction toward drug discovery. Bioinformatics, 31, i276–i283. [DOI] [PMC free article] [PubMed] [Google Scholar]
- Chen X. et al. (2016) Drug–target interaction prediction: databases, web servers and computational models. Brief. Bioinform., 17, 696–712. [DOI] [PubMed] [Google Scholar]
- Cheng F. et al. (2012) Prediction of drug-target interactions and drug repositioning via network-based inference. PLoS Comput. Biol., 8, e1002503. [DOI] [PMC free article] [PubMed] [Google Scholar]
- Chu L.-H., Chen B.-S. (2008) Construction of a cancer-perturbed protein-protein interaction network for discovery of apoptosis drug targets. BMC Syst. Biol., 2, 56. [DOI] [PMC free article] [PubMed] [Google Scholar]
- Chu C.-S. et al. (2018) Use of statins and the risk of dementia and mild cognitive impairment: a systematic review and meta-analysis. Sci. Rep., 8, 1–12. [DOI] [PMC free article] [PubMed] [Google Scholar]
- Cobanoglu M.C. et al. (2013) Predicting drug–target interactions using probabilistic matrix factorization. J. Chem. Inf. Model., 53, 3399–3409. [DOI] [PMC free article] [PubMed] [Google Scholar]
- Davis J., Goadrich M. (2006) The relationship between precision-recall and ROC curves. In Proceedings of the 23rd International Conference on Machine Learning, pp. 233–240. Pittsburgh, USA.
- Davis J. et al. (2005) View learning for statistical relational learning: with an application to mammography. In: IJCAI, pp. 677–683. Pittsburgh, USA.
- Elangovan A. et al. (2018) Factors associated with early (<50 years) and late onset (50 years) colorectal cancer: a population-based national study: 219. Am. J. Gastroenterol., 113, S127–S128. [Google Scholar]
- Gönen M. (2012) Predicting drug–target interactions from chemical and genomic kernels using Bayesian matrix factorization. Bioinformatics, 28, 2304–2310. [DOI] [PubMed] [Google Scholar]
- Haag M.D. et al. (2009) Statins are associated with a reduced risk of Alzheimer disease regardless of lipophilicity: the Rotterdam study. J. Neurol. Neurosurg. Psychiatry, 80, 13–17. [DOI] [PubMed] [Google Scholar]
- Hamosh A. et al. (2004) Online mendelian inheritance in man (OMIM), a knowledgebase of human genes and genetic disorders. Nucleic Acids Res., 33, D514–D517. [DOI] [PMC free article] [PubMed] [Google Scholar]
- He Z. et al. (2010) Predicting drug-target interaction networks based on functional groups and biological features. PLoS One, 5, e9603. [DOI] [PMC free article] [PubMed] [Google Scholar]
- Hidalgo C.A. et al. (2009) A dynamic network approach for the study of human phenotypes. PLoS Comput. Biol., 5, e1000353. [DOI] [PMC free article] [PubMed] [Google Scholar]
- Hoie E. (2019) Alzheimer’s disease: current treatments and potential new agents. US Pharm., 44, 20–23. [Google Scholar]
- IBM. (30 May 2020) IBM Explorys solutions. https://www.ibm.com/products/explorys-ehr-data-analysis-tools
- Jensen A.B. et al. (2014) Temporal disease trajectories condensed from population-wide registry data covering 6.2 million patients. Nat. Commun., 5, 1–10. [DOI] [PMC free article] [PubMed] [Google Scholar]
- Kaelber D.C. et al. (2012) Patient characteristics associated with venous thromboembolic events: a cohort study using pooled electronic health record data. J. Am. Med. Inf. Assoc., 19, 965–972. [DOI] [PMC free article] [PubMed] [Google Scholar]
- Keiser M.J. et al. (2009) Predicting new molecular targets for known drugs. Nature, 462, 175–181. [DOI] [PMC free article] [PubMed] [Google Scholar]
- Kuhn M. et al. (2016) The sider database of drugs and side effects. Nucleic Acids Res., 44, D1075–D1079. [DOI] [PMC free article] [PubMed] [Google Scholar]
- Laufs U. et al. (2017) Practical aspects in the management of statin-associated muscle symptoms (SAMS). Atheroscler. Suppl., 26, 45–55. [DOI] [PubMed] [Google Scholar]
- Li Y., Patra J.C. (2010) Genome-wide inferring gene–phenotype relationship by walking on the heterogeneous network. Bioinformatics, 26, 1219–1224. [DOI] [PubMed] [Google Scholar]
- Lin F.-C. et al. (2015) Early statin use and the progression of Alzheimer disease: a total population-based case-control study. Medicine, 94, e2143. [DOI] [PMC free article] [PubMed] [Google Scholar]
- Lu Y. et al. (2017) Link prediction in drug-target interactions network using similarity indices. BMC Bioinform., 18, 39. [DOI] [PMC free article] [PubMed] [Google Scholar]
- Manning C.D. et al. (2008) Introduction to Information Retrieval. Cambridge University Press, Cambridge, UK. [Google Scholar]
- McDonald,C.J. et al. (2003) LOINC, a universal standard for identifying laboratory observations: A 5-year update. Clin. Chem., 49, 624–633. [DOI] [PubMed]
- MetaMap. (2018) MetaMap.
- Nelson S.J. et al. (2011) Normalized names for clinical drugs: RxNorm at 6 years. J. Am. Med. Inf. Assoc., 18, 441–448. [DOI] [PMC free article] [PubMed] [Google Scholar]
- Patel V.N., Kaelber D.C. (2014) Using aggregated, de-identified electronic health record data for multivariate pharmacosurveillance: a case study of azathioprine. J. Biomed. Inf., 52, 36–42. [DOI] [PMC free article] [PubMed] [Google Scholar]
- Sawada R. et al. (2018) Predicting inhibitory and activatory drug targets by chemically and genetically perturbed transcriptome signatures. Sci. Rep., 8, 1–9. [DOI] [PMC free article] [PubMed] [Google Scholar]
- Shahpori R., Doig C. (2010) Systematized nomenclature of medicine–clinical terms direction and its implications on critical care. J. Crit. Care, 25, 364.e1–364.e9. [DOI] [PubMed] [Google Scholar]
- Shi J.-Y. et al. (2015) Predicting drug-target interactions via within-score and between-score. BioMed Res. Int., 2015, 1–9. [DOI] [PMC free article] [PubMed] [Google Scholar]
- Szklarczyk D. et al. (2015) String v10: protein–protein interaction networks, integrated over the tree of life. Nucleic Acids Res., 43, D447–D452. [DOI] [PMC free article] [PubMed] [Google Scholar]
- Wang Y., Zeng J. (2013) Predicting drug-target interactions using restricted Boltzmann machines. Bioinformatics, 29, i126–i134. [DOI] [PMC free article] [PubMed] [Google Scholar]
- Wang W. et al. (2013) Drug target predictions based on heterogeneous graph inference In Biocomputing 2013, pp. 53–64. World Scientific, Singapore. [PMC free article] [PubMed] [Google Scholar]
- Wang W. et al. (2014) Drug repositioning by integrating target information through a heterogeneous network model. Bioinformatics, 30, 2923–2930. [DOI] [PMC free article] [PubMed] [Google Scholar]
- Wishart D.S. et al. (2008) DrugBank: a knowledgebase for drugs, drug actions and drug targets. Nucleic Acids Res., 36, D901–D906. [DOI] [PMC free article] [PubMed] [Google Scholar]
- Xu R., Wang Q. (2013) Large-scale extraction of accurate drug-disease treatment pairs from biomedical literature for drug repurposing. BMC Bioinform., 14, 181. [DOI] [PMC free article] [PubMed] [Google Scholar]
- Xu R., Wang Q. (2014) Automatic signal extraction, prioritizing and filtering approaches in detecting post-marketing cardiovascular events associated with targeted cancer drugs from the FDA adverse event reporting system (FAERS). J. Biomed. Inf., 47, 171–177. [DOI] [PMC free article] [PubMed] [Google Scholar]
- Xu R., Wang Q. (2015) Phenopredict: a disease phenome-wide drug repositioning approach towards schizophrenia drug discovery. J. Biomed. Inf., 56, 348–355. [DOI] [PMC free article] [PubMed] [Google Scholar]
- Xu R., Wang Q. (2016) A genomics-based systems approach towards drug repositioning for rheumatoid arthritis. BMC Genomics, 17, 518. [DOI] [PMC free article] [PubMed] [Google Scholar]
- Yamanishi Y. et al. (2008) Prediction of drug–target interaction networks from the integration of chemical and genomic spaces. Bioinformatics, 24, i232–i240. [DOI] [PMC free article] [PubMed] [Google Scholar]
- Yuan Q. et al. (2016) DrugE-rank: improving drug–target interaction prediction of new candidate drugs or targets by ensemble learning to rank. Bioinformatics, 32, i18–i27. [DOI] [PMC free article] [PubMed] [Google Scholar]
- Zheng C., Xu R. (2018) Large-scale mining disease comorbidity relationships from post-market drug adverse events surveillance data. BMC Bioinform., 19, 500. [DOI] [PMC free article] [PubMed] [Google Scholar]
- Zhou M. et al. (2019) A drug-side effect context-sensitive network approach for drug target prediction. Bioinformatics, 35, 2100–2107. [DOI] [PMC free article] [PubMed] [Google Scholar]
- Zhou M. et al. (2020) Tumor necrosis factor (TNF) blocking agents are associated with lower risk for Alzheimer’s disease in patients with rheumatoid arthritis and psoriasis. PLoS One, 15, e0229819. [DOI] [PMC free article] [PubMed] [Google Scholar]