

Abstract
Motivation
Mining drug–disease association and related interactions are essential for developing in silico drug repurposing (DR) methods and understanding underlying biological mechanisms. Recently, large-scale biological databases are increasingly available for pharmaceutical research, allowing for deep characterization for molecular informatics and drug discovery. However, DR is challenging due to the molecular heterogeneity of disease and diverse drug–disease associations. Importantly, the complexity of molecular target interactions, such as protein–protein interaction (PPI), remains to be elucidated. DR thus requires deep exploration of a multimodal biological network in an integrative context.
Results
In this study, we propose BiFusion, a bipartite graph convolution network model for DR through heterogeneous information fusion. Our approach combines insights of multiscale pharmaceutical information by constructing a multirelational graph of drug–protein, disease–protein and PPIs. Especially, our model introduces protein nodes as a bridge for message passing among diverse biological domains, which provides insights into utilizing PPI for improved DR assessment. Unlike conventional graph convolution networks always assuming the same node attributes in a global graph, our approach models interdomain information fusion with bipartite graph convolution operation. We offered an exploratory analysis for finding novel drug–disease associations. Extensive experiments showed that our approach achieved improved performance than multiple baselines for DR analysis.
Availability and implementation
Source code and preprocessed datasets are at: https://github.com/zcwang0702/BiFusion.
1 Introduction
Drug repurposing (DR) is a strategy to identify novel therapeutic purposes for existing drugs with a goal to expand the scope of the original medical indication of known drugs (Li et al., 2016). This task is of great pharmaceutical significance as the de novo drug discovery is known to be costly and lengthy. The total cost of developing a drug ranges from $2 billion to $3 billion and it takes at least 13–15 years to bring a single drug to market (Yella et al., 2018). By contrast, DR offers a fast and cost-effective means for drug candidate discovery. For example, the repurposed drug candidate has proven to be sufficiently safe through preclinical assessments, thus resulting in a shortened period of clinical evaluation.
Recently, large-scale databases such as protein–protein interaction (PPI) networks, drug–target interactions and drug–disease associations are rapidly growing and increasingly accessible. The wealth of drug-related data presents great opportunities to generate novel insights surrounding drug mechanisms and develop in silico DR methods to accelerate drug discovery. However, in silico DR is challenging due to the molecular heterogeneity of disease and diverse drug–disease associations. For example, the complexity of molecular target interactions such as PPI remains to be elucidated. Without knowledge from a broader network of the molecular determinants of disease and drug targets, we are unable to develop efficacious drug treatment for complex diseases (Greene and Loscalzo, 2017). Therefore, DR requires deep exploration of a multimodal biological network including drug–disease, drug/disease–protein and protein–protein associations in an integrative context.
Among various biomedical interactions, the importance of the complex PPI network is broadly recognized in biological systems and the development of disease states (Scott et al., 2016). In other words, PPIs are at the center of almost every cellular process from cell motility to DNA replication. Thus understanding PPI mechanism could greatly help elucidate the function of a known or novel protein and its role in a known biological pathway, which can be a key factor for justifying DR. Existing approaches using PPIs are often focused on using predefined descriptors to represent protein information such as the overlap of PPI closeness. However, they cannot fully explore the potential information within PPI in an integrative context, which requires modeling interdomain information fusion to characterize drug’s pharmacological action and guide a roadmap for DR assessment.
Previous studies in DR were primarily focused on drug and disease activities to uncover statistical associations between them (Dakshanamurthy et al., 2012; Sanseau et al., 2012; Ye et al., 2014). These analyses worked on a single data modality such as gene expression or drug–target interactions, only capturing partial information of the heterogeneous network. In addition, these methods cannot consider the important topological information among different biological networks. To address this limitation, there has been a growing number of efforts to incorporate various data sources for boosting the accuracy of drug repositioning (Gottlieb et al., 2011; Guney et al., 2016; Li and Lu, 2012; Luo et al., 2016; Napolitano et al., 2013; Zeng et al., 2019; Zhang et al., 2013). These approaches integrate multiple information sources such as chemical fingerprint, interaction network closeness of drug targets and correlation between drug side effects. However, these approaches with engineering-based features were unable to capture graph-structured information such as chemical molecules of drugs and PPI network knowledge. Therefore, graph-based model architectures become highly desired for incorporating multiscale, graph-based knowledge and improving the model performance in DR.
Graph convolutional networks (GCNs) (Kipf and Welling, 2017) extend deep-learning approaches specifically designed for processing graph-based data in various graph-related tasks. In principle, GCNs perform a convolution by aggregating the neighbor nodes’ information to learn node representations in the entire graph. GCN has unique advances in its automation on feature extraction from raw graph-structured inputs. Recently, a handful of GCN-based methods in drug–drug and drug–target interaction predictions have proved the usefulness of GCN-based models for drug information extraction (Feng et al., 2018; Gao et al., 2018; Ma et al., 2018; Zitnik et al., 2018). However, exploring GCN-based networks for deep understanding multiscale biological characteristics of drug data remains to be fully elucidated. Specifically, a notable limitation for conventional GCN-based methods is that same node attributes should always be assumed. Thus, these approaches view the multirelational networks as a global graph, completely ignoring distinct node features from different domains. For example, node features in drug and protein domains actually follow separate statistical distributions. But conventional GCNs can only leverage neighboring nodes in a single graph thus are quite difficult to measure correlation between the two separate domains.
To address all challenges above, we propose a bipartite graph convolution network approach, termed BiFusion, for in silico DR. The key motivation is to model interactions between diverse biological domains through bipartite graphs. Unlike previous GCN-based methods, our model enables interdomain information fusion with a bipartite graph convolution operation. To allow information fusion, our model learns to represent different features from heterogeneous nodes into a unified embedding space, where protein nodes serve as a bridge for message passing within complex biological networks. This design differs from conventional GCN that is limited on node representation in a single graph. Overall, our major contributions can be summarized as follows: (i) To the best of our knowledge, this article proposed the first bipartite GCN-based approach for in silico DR, assembling interactions across protein, drug and disease domains from large-scale databases. (ii) We proposed a novel end-to-end graph learning framework that can effectively integrate multirelational interaction data for DR, yielding improved performance than baseline methods. (iii) Our analysis provided insights into better extracting and fusing information from the PPI network for DR.
2 Related works
We briefly review computational approaches for DR and related researches on GCNs.
2.1 In silico DR
Numerous studies have used single data source to identify drug indications. Different information modalities include structural features of compounds (or proteins) (Dakshanamurthy et al., 2012), genetic activities (Sanseau et al., 2012) and phenotypic profiles such as side effects of drugs (Ye et al., 2014). However, these methods failed to offer an unbiased perspective for predicting drug–disease associations due to the potential noise in the single information source. In addition, these methods cannot model important topological information among different biological networks. In response, current methods can be categorized into similarity-based and network-based approaches.
Most of similarity-based approaches are integrative methods using the heterogeneous information (Gottlieb et al., 2011; Li and Lu, 2012; Napolitano et al., 2013; Zhang et al., 2013). They rely on the assumption that similar drugs are indicated for similar diseases. These methods utilize shared characteristics between drugs such as drug–targets, chemical structures and adverse effects, and then constructed similarity features to build computational models. For example, PREDICT (Gottlieb et al., 2011) is a similarity-based framework integrating drug–drug similarity (based on drug–protein interactions, sequence and gene-ontology) and disease–disease similarity (disease–phenotype and human phenotype ontology), authors used them as key features applying logistic regression to predict similar drugs for similar diseases.
Network-based approaches (Cheng et al., 2018, 2019; Guney et al., 2016; Luo et al., 2016; Zeng et al., 2019) model graph-structured information among different biological networks to boost the performance for DR. Typically, in these models, the nodes in the networks represent either drug, disease or gene products and edges denote the interactions or relationships among them. For example Cheng et al. (2018) identified hundreds of new drug–disease associations by quantifying the network proximity of disease genes and drug targets in the human protein–protein interactome. The deepDR (Zeng et al., 2019) learnt high-level features of drugs from the heterogeneous networks by a multimodal deep autoencoder and applied a variational autoencoder to infer candidates for approved drugs. However, deepDR considered information sources in the drug domain only without interactions in the disease domain.
Bipartite graph comprises a set of nodes decomposed into two disjoint sets (Pavlopoulos et al., 2018; Yildirim et al., 2007), which is a natural representation for modeling complex items of biological systems and their interactions. Extensive studies have revealed the feasibility of bipartite graphs and their impact in the field of network biology (Pavlopoulos et al., 2018). For example Yildirim et al. (2007) built a bipartite graph to analyze relationships between drug targets and disease–gene products. Kontou et al. (2016) performed a bipartite graph approach to analyze the relationships between human genetic diseases. In the field of DR, Li and Lu (2012) developed a bipartite drug–target network method using drug pair similarity integrated drug chemical structure similarity, common drug targets and their interactions. Zheng et al. (2019) also constructed a bipartite graph model with known relationships between drugs and their target proteins. However, most of these methods heavily relied on predefined drug similarity features and ignored the important information sources in the disease domain. Although they utilized the PPI information, the relationships between drug targets and disease–gene products in the context of biological interaction network have not been investigated.
2.2 Graph convolutional networks
GCN (Kipf and Welling, 2017) has opened a new paradigm for graph learning and achieved leading performance in machine-learning tasks. The major motivation of GCN roots in generalizing convolutional neural network (CNN) in the graph domain. Increasing amount of graph-structured data necessitate the use of GCN-based models for addressing with complex relationships and interdependencies of objects in non-Euclidean spaces. Traditional CNN models are no longer applicable on these tasks because structural information are not considered or sufficiently used in feature extraction in graphs. In addition, traditional graph-based approaches are inflexible at scale as they often rely on hand-engineered features including summary graph statistics and kernel functions. By contrast, GCN-based models are designed to capture the dependence of graphs via a recursive neighborhood aggregation scheme, where each node aggregates feature vectors of its neighbors to update its new node features. Thus, GCNs demonstrate their superiority for graph-related tasks given their ability to naturally integrate the feature attributes of graph-structured data and learn intrinsic features from raw graph-structured inputs.
GCN extends the idea of the graph neural network (GNN) (Scarselli et al., 2008). Specifically, a graph can be denoted by consisting of a vertex set and edge set is the node feature of vertex vi. A general GNN layer can be defined as follows:
| (1) |
where is a learnable matrix transforming N-dimensional features to M-dimensional features, the is a permutation-invariant aggregation operation such like element-wise mean-pooling and the ρ operator can be a nonlinear activation function such as ReLU. is the neighborhood of the node vi connected by in . In GCN, these two operators are integrated as follows:
| (2) |
Following on this work, there is increasing interest in extending and improving GCN with more powerful aggregation function such as GraphSAGE (Hamilton et al., 2017) and Graph Attention Network (GAT) (Veličković et al., 2018). GAT uses an attention mechanism on the node features to construct the weighting kernel as . The attention mechanism is a single-layer feedforward neural network, parametrized by a weight vector and applying the LeakyReLU nonlinearity. The weighting coefficients computed by the attention mechanism can be expressed as:
| (3) |
where T represents transposition and is the concatenation operation.
Despite advances of GCNs, applying them to bipartite graphs in biomedical domains was seldom explored. The main technical challenge is that node features in different domains of bipartite graphs present quite distinct characteristics. Therefore, it is insufficient to simply apply conventional GCNs to model the connections between multiple domains. To build and explore such connection, we identified that recent studies (He et al., 2020; Nassar, 2018) have shown the effectiveness of bipartite GNNs on modeling interconnected graphs.
Conceptually, our research draws inspiration from recent progress of applying GCNs in biomedicine. For example Zitnik et al. (2018) achieved state-of-the-art results in predicting polypharmacy side effects using GCN. Fout et al. (2017) showed the effectiveness of GCN in the task of protein interface prediction. Kearnes et al. (2016) proposed a graph convolution framework to learn molecular representations for data-driven tasks considering both node and edge features.
3 Datasets
We formulated the problem of DR as a drug–disease link prediction task using multimodal interaction data. We constructed a multirelational graph network using multiple biomedical datasets that allow systematic evaluations for DR. Specifically, drug–disease interaction networks contain drugs therapeutic indications. Drug–protein/ disease–protein networks describe the proteins targeted by drugs/diseases. Finally, protein–protein networks contain interaction relationships between proteins. Below we describe details of the datasets to construct the graph network in our study (Fig. 1).
Fig. 1.
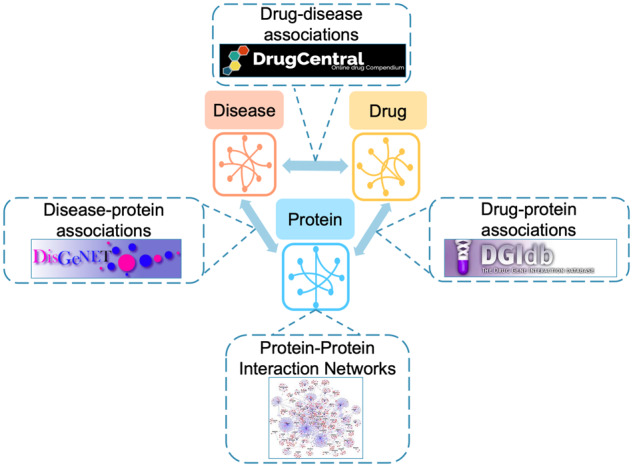
Overview of our heterogeneous information network. The multirelational network has 592 disease, 1012 drug and 13 460 protein nodes connected by 3204 drug–disease, 7713 drug–protein, 104 716 disease–protein and 141 296 protein–protein edges
3.1 Drug–disease associations
For this study, we collected 3204 known therapeutic indications of drugs from repoDB database (Brown and Patel, 2017), in which 6677 approved indications were drawn from DrugCentral (Ursu et al., 2017). Only FDA-approved small-molecule drugs were considered and generic name of each drug were standardized by Medical Subject Headings (MeSH) (Lipscomb, 2000) and Unified Medical Language System vocabularies (Bodenreider, 2004). We also mapped drugs to PubChem (Kim et al., 2019) with compound ID to get their chemical structure information represented by simplified molecular-input line-entry system (SMILES) string (Weininger, 1988). Most of drugs (75%) treat less than 3 indicated diseases; only 4% of drugs treat more than 10 diseases. 70% of the diseases have less than 5 drugs; 16% of the diseases have 5–10 drugs; 14% of diseases have more than 10 drugs.
3.2 Drug–protein and disease–protein associations
Drug targets were obtained from the DGIdb (Cotto et al., 2018) database which consolidates drug gene interactions and potentially druggable genes into a single resource from papers, databases and web resources. DGIdb normalized content from 30 disparate sources using a combination of expert curation and text mining, resulting in 29 783 drug gene interactions which cover 41 100 genes and 9495 drugs. We pulled target protein-coding genes of a given drug from DGIdb, then mapped genes to proteins with gene names. Our drug–protein interaction network covers 7713 drug–protein interactions between 1012 drugs and 1681 proteins.
Disease–protein associations were extracted from DisGeNET (Piñero et al., 2017), one of the largest available collections of genes and variants involved in human diseases. DisGeNET integrates data from expert curated databases with information gathered through text mining the scientific literature, including various resources such as the comparative toxicogenomics database (CTD) (Davis et al., 2017) and online mendelian inheritance in man (OMIM) (Hamosh et al., 2004). We pulled protein-coding genes of a given disease and then map them to corresponding products. Our curated disease–protein interaction network covers 104 716 disease–protein associations between 592 diseases and 9941 proteins.
3.3 Protein–protein interactions
We used the human PPIs compiled by Menche et al. (2015) which is an unweighted and undirected network with 13 460 proteins and 141 296 physical interactions. The network contains physical interactions with experimental support, such as regulatory interactions, metabolic enzyme-coupled interactions and signaling interactions. The PPI network is approximately scale-free and shows other typical characteristics as observed previously in many other biological networks, such as high clustering and short pathlengths.
The final multirelational network after linking entity vocabularies across different modalities and databases has 592 disease, 1012 drug and 13 460 protein nodes connected by 3204 drug–disease, 7713 drug–protein, 104 716 disease–protein and 141 296 protein–protein edges.
4 Materials and methods
4.1 Interdomain message passing through bipartite graph convolution
A bipartite graph is a graph where and denote two sets of the two domains of vertices (nodes). ui and vj denote the ith and jth node in and , respectively, where and . All edges of a bipartite graph are strictly between and (i.e. ), denotes the edge between ui and vj. The features of two sets of nodes can be denoted by Xu and Xv where is a feature matrix with representing the feature vector of node ui, and is defined similarly.
Bipartite graph convolution only performs message passing and node feature aggregation through interdomain edges as the intradomain edges are absent in bipartite graphs. For the message passing from domain to , we define a general bipartite graph convolution (bg) as:
| (4) |
where is the neighborhood of the node ui connected by in (i.e. ). Note that any unipartite graph convolution defined on can be formulated as a bipartite graph convolution defined on .
Our bipartite graph convolution layers uses GAT as the backbone, termed as bipartite graph attention convolution layer (bga). As the attention mechanism considers features of two sets of nodes, we specifically define a learnable matrix (resp. ) for Xu (resp. Xv). The bga can be formulated as:
| (5) |
where the weighting coefficients can be expressed as:
| (6) |
4.2 Model framework
We cast drug discovery task as a link prediction problem by fusing information from a heterogeneous network incorporating drug, disease and protein relationships. More specifically, we show that the heterogeneous network can be represented by an undirected graph with three sets of nodes: drugs (), diseases () and proteins (). The initial features of these three sets of nodes are and , respectively. consists of three interdomain edges including drug–disease associations (), drug–protein target relationship () and disease–protein target relationship (), and one intradomain edges of PPI network ().
Our model operates directly on the graph with encoder–decoder architecture (Fig. 2A). The encoder is a bipartite GCN learning the embedding representations for all graph nodes. It fuses heterogeneous information through message passing across drug, disease and protein nodes. The decoder is a multilayer perceptron neural network decoder using drug and disease node embeddings to reconstruct drug–disease association matrix.
Fig. 2.

Overview of BiFusion model architecture. (A) The pipeline of BiFusion contains a bipartite GCN encoder and a MLP decoder. The encoder takes similarity features of drug and disease nodes as inputs, and generates drug–disease pair embeddings by fusing heterogeneous information through message passing across drug, disease and protein nodes. Each BiFusion layer consists of three computing steps shown in the following subfigures. BiFusion decoder takes pair embeddings to produce prediction score and reconstruct drug–disease association matrix. (B) The first step in BiFusion layer: a single bipartite graph attention convolution layer is applied to project information from drug and disease domains to protein domain. (C) The second step in BiFusion layer: a single layer graph attention convolution layer is applied within PPI network. (D) The third step in BiFusion layer: another bipartite graph attention convolution layer is used to update drug and disease features based on learnt protein node embeddings
4.3 Node feature representation
We applied zero-initialization for all protein nodes and defined similarity measures for initializing features for drug and disease nodes.
Chemical-based drug similarity measure: Canonical SMILES of the drug molecules were used from PubChem. The similarity score between two drugs is computed based on their fingerprints according to the two-dimensional Tanimoto score (Tanimoto, 1957).
Graph-based disease similarity measure: We used MeSH term (Lipscomb, 2000) as disease descriptor for constructing similarity measures. Given that the structure of MeSH is a directed acyclic graph which enables the comparison of semantic similarity in the graph, we applied the graph-based method proposed by Wang et al. (2007) to measure similarity between disease MeSH terms.
4.4 Bipartite graph convolutional encoder
Each layer of our bipartite graph convolutional encoder consists of three computing steps. First, we applied a single bipartite graph attention convolution layer to pass the message of drugs and diseases to target proteins simultaneously. Conceptually, we can view this step as projecting information from macro level (e.g. information in drugs and disease domains) to micro level (e.g. protein space). This message passing step is formulated as follows:
| (7) |
where k indicates the layer index and are hidden embeddings of nodes (when k = 0, ). We concatenated the results of two message passing processes into a unified embedding representation. Therefore, the updated embeddings of protein nodes can be written as:
| (8) |
In the second step, to enhance domain fusion and model the relationships between drug targets and disease–gene products, we applied a single layer GAT within our PPI network. The intuition behind this step is that GAT can enable feature smoothing between protein neighborhood nodes, and a drug is more likely to treat a disease if they are nearby in protein space. This layer performs intradomain message passing that allows information fusion in protein space and depict complex interactions between drugs and diseases. Therefore, protein nodes serve as a bridge of message passing within our multirelational graph. In each layer, GAT propagates node hidden embeddings across edges of PPI network, which is defined as:
| (9) |
Finally, we utilized the nonlinear graph information captured by protein nodes to update hidden embeddings of drug and disease nodes. In particular, we applied another bipartite graph attention convolution layer to project protein embeddings back to drug and disease domains. Therefore, the third step can be viewed as an integrative graph method to learn drug and disease representations through closeness in PPI network. For those drugs and diseases that share target proteins, this step will help to further make their features similar. The updated feature representations of drug and disease nodes can be written as:
| (10) |
We summarize our bipartite graph convolutional encoder in Figure 2B–D.
4.5 Multilayer perceptron neural network decoder
Our network decoder applies a multilayer perceptron to reconstruct links in the drug–disease interaction graph. In particular, using embeddings of drug node and disease node returned by the encoder, we concatenated two embeddings to represent the drug–disease pair and then fed into the decoder. In particular, decoder scores a drug–disease pair through a three-layer neural network representing how likely it is that the drug can be indicated for the disease:
| (11) |
Then we applied a sigmoid function σ to compute probability of edge :
| (12) |
4.6 Model training
During model training, we optimized model parameters using the cross-entropy loss in an end-to-end fashion. Followed previous studies (Mikolov et al., 2013), we trained the model through negative sampling. Specifically, for each positive drug–disease edge , we sampled a random edge as a negative example. This is achieved by replacing a drug or disease node vj with node that is selected randomly according to a sampling distribution (Mikolov et al., 2013). We calculated the final loss function by considering all edges. To optimize the model, we used the Adam optimizer (Kingma and Ba, 2015) and initialized weights as described in Glorot and Bengio (2010). To generalize well to unobserved data, we trained the model in a denoising setup by randomly dropping out all outgoing messages of a particular node with a fixed probability. In particular, during the message passing process in encoder, individual outgoing messages across multirelational edges are dropped out independently, making embeddings more robust against the presence or absence of single edges. We also apply regular dropout (Srivastava et al., 2014) to the hidden layer units in MLP decoder.
5 Experiments
5.1 Evaluation metrics
We conduct 10-fold cross validation to evaluate the model performance. All known drug–disease associations are randomly divided into 10 subsets with equal size. A matching number of unknown pairs were selected as negative samples in training and testing sets through negative sampling strategy. In each cross-validation trial, one subset is taken in turn as the test set, whereas the remaining subsets constitute the training set. We selected model hyperparameters by performing cross validation on the training set. We measure the prediction performance using three criteria: area under the receiver-operating characteristic (AUROC), area under the precision–recall curve (AUPRC) and overall accuracy, which are widely used for drug indication prediction tasks. As the prediction performance can vary considerably across diseases and drugs, we further report the disease/drug-centric accuracy, which is the average of balanced accuracy of all drug–disease pair subsets clustered by disease/drug nodes. To reduce the data bias, we performed 100 independent cross-validation runs and reported the full distribution of average testing performance of all evaluation metrics. In addition, during each random run, a different sampled negative set and partition of the dataset were used. To prevent information leakage in the evaluation, we ensure that only drugs and diseases seen in the training set were used to construct similarity features.
5.2 Method comparison
We compare the performance of our model against the several competing approaches. Specifically, BiFusion uses a two-layer architecture with 256 and 128 hidden units in each layer, and a dropout rate of 0.1 in all experiments.
GCN (Zitnik et al., 2018) includes encoder and decoder modules. The encoder is a conventional GCN operating on our multimodal graph of protein–protein, drug–protein and disease–protein interactions. The decoder is a tensor factorization model using node embeddings to model drug–disease associations.
DeepWalk (Perozzi et al., 2014) learns latent node representations of our heterogeneous information network based on local information obtained from truncated random walks. Drug–disease pairs are represented by concatenating latent drug and disease node representations. We used pair representations as inputs to train a logistic regression classifier.
Collective variational autoencoder (cVAE) (Chen and de Rijke, 2018; Zeng et al., 2019) simultaneously recovers drug–disease association matrix and side information using a variational autoencoder. Specifically, drug–disease association matrix and drug–drug similarity matrix are encoded and decoded collectively through the same inference network and generation network.
Sparse linear methods with side information (SSLIM) (Ning and Karypis, 2012) learns a sparse coefficient matrix to do top-N recommendation, by leveraging both association matrix and similarity matrix within a regularized optimization process.
Network-based proximity: This approach measures relative proximity that quantifies the network-based relationship between drugs and disease proteins in the interactome. Given the set of disease proteins S and drug targets T, the proximity is the closest measure d(s, t), the shortest path length between nodes s and t in the network, which is defined . Proximity versus sensitivity and specificity curves is used to find the optimal proximity threshold.
BiFusion-v2 (w/o PPI): To investigate the contribution of intradomain message passing operation in PPI network, we implemented a variant of our BiFusion model. We remove the second step of message passing to hide PPI information in each layer of encoder.
6 Results
6.1 Performance comparison
In Table 1, we found that BiFusion showed strong performance and outperformed other approaches by a large margin. Especially, BiFusion surpassed other methods without incorporating the graph structure information (cVAE and SSLM) by up to 22.3% (AUROC), highlighting the importance of graph-level information fusion for drug–disease findings. We also observed that our model achieved a gain of 8.2% (AUROC) over GCN operating on homogeneous graph, which indicated the effectiveness of bipartite graph convolution to model multirelational network. In addition, the protein feature smoothing operation allowed BiFusion a 2.4% gain (AUROC) over BiFusion-v2. Such finding supported that intradomain message passing operation can encourage information fusion in PPI network and thus enhanced the model performance on capturing complex interactions between drugs and diseases.
Table 1.
The summary of model performance on repoDB dataset under 10-fold cross validation
| Method | AUROC | AUPRC | Overall accuracy | Drug-centric accuracy | Disease-centric accuracy |
|---|---|---|---|---|---|
| BiFusion | 0.857 ± 0.003 | 0.867 ± 0.003 | 0.738 ± 0.002 | 0.710 ± 0.003 | 0.705 ± 0.003 |
| BiFusion-v2 (w/o PPI) | 0.837 ± 0.003 | 0.810 ± 0.003 | 0.712 ± 0.003 | 0.687 ± 0.002 | 0.674 ± 0.003 |
| GCN | 0.792 ± 0.004 | 0.774 ± 0.005 | 0.700 ± 0.003 | 0.651 ± 0.004 | 0.659 ± 0.004 |
| DeepWalk | 0.769 ± 0.003 | 0.764 ± 0.003 | 0.672 ± 0.003 | 0.617 ± 0.003 | 0.637 ± 0.003 |
| cVAE | 0.743 ± 0.003 | 0.739 ± 0.003 | 0.665 ± 0.002 | 0.623 ± 0.003 | 0.616 ± 0.003 |
| SSLIM | 0.701 ± 0.002 | 0.703 ± 0.002 | 0.635 ± 0.002 | 0.590 ± 0.002 | 0.625 ± 0.002 |
| Network-based proximity | 0.663 ± 0.004 | 0.678 ± 0.004 | 0.608 ± 0.004 | 0.568 ± 0.004 | 0.603 ± 0.005 |
The best results are highlighted in bold.
6.2 Investigation of novel predictions
To validate the ability of models for predicting truly novel drug– disease associations (i.e. for new diseases without any treatment information), we further implemented a disjoint cross-validation fold-generation method (disease-centric cross validation) that ensures none of the diseases in onefold would appear in another fold. Specifically, all disease nodes were split into 10 equal-sized subsets during disease-centric cross validation. We clustered drug–disease pairs by disease nodes, then recombined pair clusters based on disease subsets resulting in 10 pair subsets. Each pair subset was used in turn as the testing set. We also performed 100 independent runs to report full distribution of average testing performance.
As shown in Table 2, BiFusion achieved AUROC value of 0.775 and disease-centric accuracy value of 0.700, outperforming all baseline methods. We observe that BiFusion surpassed two other GCN-based methods by up to 6.7% (disease-centric accuracy), which showed the superior performance of our model on predicting novel drug–disease associations.
Table 2.
The results of novel predictions on repoDB dataset
| Method | AUROC | AUPRC | Overall accuracy | Drug-centric accuracy | Disease-centric accuracy |
|---|---|---|---|---|---|
| BiFusion | 0.775 ± 0.003 | 0.794 ± 0.003 | 0.709 ± 0.002 | 0.666 ± 0.003 | 0.700 ± 0.003 |
| BiFusion-v2 (w/o PPI) | 0.749 ± 0.003 | 0.732 ± 0.003 | 0.674 ± 0.003 | 0.663 ± 0.003 | 0.668 ± 0.004 |
| GCN | 0.740 ± 0.004 | 0.726 ± 0.005 | 0.687 ± 0.004 | 0.669 ± 0.004 | 0.656 ± 0.005 |
| DeepWalk | 0.712 ± 0.004 | 0.700 ± 0.004 | 0.663 ± 0.003 | 0.647 ± 0.003 | 0.655 ± 0.004 |
| cVAE | 0.696 ± 0.003 | 0.698 ± 0.003 | 0.637 ± 0.002 | 0.631 ± 0.002 | 0.641 ± 0.003 |
| SSLIM | 0.671 ± 0.002 | 0.699 ± 0.003 | 0.616 ± 0.002 | 0.575 ± 0.003 | 0.591 ± 0.002 |
| Network-based proximity | 0.661 ± 0.004 | 0.692 ± 0.004 | 0.622 ± 0.004 | 0.574 ± 0.004 | 0.594 ± 0.005 |
6.3 Experiments on the external dataset
To illustrate the potential generalization of our model, we performed evaluation on an external dataset (Gottlieb et al., 2011). Following the rule of collecting our primary dataset, we identified a total of 1234 associations containing 475 drugs and 141 diseases from the external dataset. We compared the performance of our method with baseline approaches under the same experiment settings as discussed. Table 3 showed the full distribution of average testing performance of 100 random runs. The results illustrated that BiFusion led best performance with AUROC value of 0.757, whereas GCN, DeepWalk, cVAE and SSLM have 0.717, 0.649, 0.676 and 0.652, respectively. BiFusion also achieved the best result in AUPRC with surpassing baseline methods by up to 24.5%.
Table 3.
The summary of model performance on external dataset
| Method | AUROC | AUPRC | Overall accuracy | Drug-centric accuracy | Disease-centric accuracy |
|---|---|---|---|---|---|
| BiFusion | 0.757 ± 0.005 | 0.721 ± 0.004 | 0.671 ± 0.004 | 0.675 ± 0.004 | 0.653 ± 0.004 |
| BiFusion-v2 (w/o PPI) | 0.722 ± 0.005 | 0.677 ± 0.005 | 0.675 ± 0.005 | 0.670 ± 0.004 | 0.636 ± 0.005 |
| GCN | 0.717 ± 0.004 | 0.676 ± 0.004 | 0.664 ± 0.003 | 0.667 ± 0.003 | 0.624 ± 0.004 |
| DeepWalk | 0.649 ± 0.003 | 0.628 ± 0.003 | 0.611 ± 0.003 | 0.604 ± 0.003 | 0.572 ± 0.003 |
| cVAE | 0.676 ± 0.006 | 0.653 ± 0.005 | 0.637 ± 0.005 | 0.629 ± 0.006 | 0.639 ± 0.006 |
| SSLIM | 0.652 ± 0.003 | 0.607 ± 0.003 | 0.602 ± 0.002 | 0.614 ± 0.003 | 0.625 ± 0.003 |
| Network-based proximity | 0.610 ± 0.003 | 0.579 ± 0.002 | 0.573 ± 0.003 | 0.566 ± 0.002 | 0.563 ± 0.003 |
6.4 Case study
We conducted a case study to further assess the quality of our model’s novel predictions by performing a literature-based evaluation of new hits. Specifically, we applied BiFusion to predict candidate drugs for two diseases including breast carcinoma and Parkinson’s disease (PD). After the prediction scores of all candidate pairs are computed, we generate a ranked list of drug–disease associations by the predicted scores. We then identified novel associations by excluding all the known drug–disease associations from the primary dataset. Table 4 shows candidate drugs with evidences.
Table 4.
New candidate drugs ranked by prediction scores by BiFusion for breast carcinoma and Parkinson’s disease
| Diseases | Rank | Candidate drugs | Evidences |
|---|---|---|---|
| Breast carcinoma | 1 | Clofarabine | Lubecka-Pietruszewska et al. (2014) and Lubecka et al. (2018) |
| 3 | Cimetidine | Boueuf et al. (2003) | |
| 4 | Thiamine | Liu et al. (2018) | |
| 5 | Arsenic trioxide | Zhang et al. (2016) and Shi et al. (2017) | |
| Parkinson disease | 1 | Dextromethorphan | Fox et al. (2017) and Fralick et al. (2019) |
| 2 | Solifenacin | Zesiewicz et al. (2015) | |
| 4 | Atomoxetine | Warner et al. (2018), Rae et al. (2016) and Ye et al. (2015) | |
| 7 | Venlafaxine | Broen et al. (2016) | |
| 8 | Tapentadol | Vaz et al. (2020) |
Breast carcinoma: Among the top five predicted drugs in the rank list, four drugs (80% success rate) were validated by various literature evidences. Arsenic trioxide was predicted by BiFusion to be associated with breast carcinoma, which is supported by recent reports. For example Zhang et al. (2016) showed arsenic trioxide suppresses cell growth and migration via inhibition of miR-27a in breast cancer cells. Shi et al. (2017) found that arsenic trioxide suppressed cell growth, stimulated apoptosis and retarded cell invasion partly via upregulation of let-7a in breast cancer cells. Clofarabine (CIF) is also one of the top predicted candidates for treating breast carcinoma. Lubecka-Pietruszewska et al. (2014) provided the first evidence of CIF implications in epigenetic regulation of transcriptional activity of selected tumor suppressor genes in breast cancer. Lubecka et al. (2018) demonstrated the ability of ClF-based combinations with polyphenols to promote cancer cell death and reactivate DNA methylation-silenced tumor suppressor genes in breast cancer cells. In addition, BiFusion found that Cimetidine and Thiamine were associated with breast cancer, which was supported by several evidences (Boueuf et al., 2003; Liu et al., 2018).
Parkinson’s disease: PD is a neurodegenerative disease currently without efficacious treatments available yet. Among top 10 predicted candidates, we found 5 drugs were validated by literature. For example dextromethorphan is the top predicted candidate. Despite approval by the FDA for pseudobulbar affect based on studies of patients with amyotrophic lateral sclerosis or multiple sclerosis, Fox et al. (2017) and Fralick et al. (2019) provided evidence of clinical benefit with dextromethorphan–quinidine for treating PD. Atomoxetine was also predicted by our model to be associated with PD. Such prediction can be supported by a previous study (Ye et al., 2015), indicating that atomoxetine can enhanced prefrontal cortical activation and frontostriatal connectivity and may improve response inhibition in PD. The results of Rae et al. (2016) also suggested that atomoxetine restores the response inhibition network in PD.
6.5 The effect of layer numbers on model performance
To investigate the effect of layer numbers on model performance, we compared results with different number of layers in BiFusion on the repoDB dataset. We performed 100 independent cross-validation runs and reported the mean value of AUROC and AUPRC. Figure 3 showed the model performance along with the increase of layer numbers. We observed that one layer has the lowest performance, suggesting that a shallow bipartite GCN cannot sufficiently propagate the node feature to fuse heterogeneous information, especially for the complex drug–protein–disease network. Meanwhile, we found that BiFusion achieved significant improvement with two layers’ structure. But with more than two layers, the model performance tends to decrease. This finding may be explained that GCN model is viewed as a special form of Laplacian smoothing that over-smoothing occurs with too many convolutional layers (Li et al., 2018). Thus, if BiFusion’s layers are going too deep, the output embedding features can be over-smoothed and less differentiated from different classes.
Fig. 3.
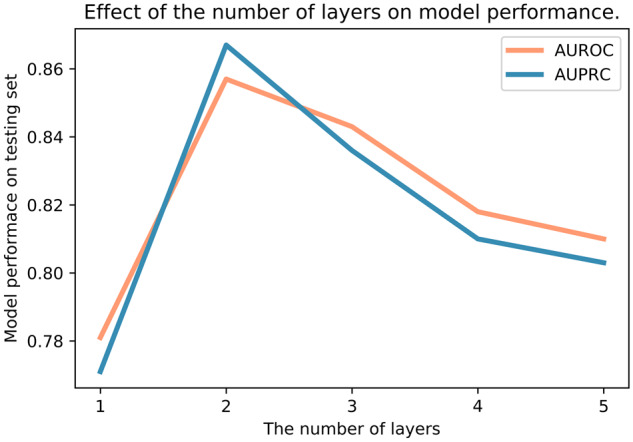
Effect of the number of layers on model performance. The x axis denotes the number of BiFusion layers and the y axis is the model performance on testing set
7 Conclusion
In this study, we presented a novel bipartite GCNs toward heterogeneous information fusion for computational DR. Our BiFusion model achieved information fusion via an important interdomain message passing across drug-, disease- and protein-level information. Extensive experiments have demonstrated that our model achieves strong performance on the task of DR. In addition, we externally validated results that have confirmed the potential generalization of our approach for DR. Case study offers concrete examples that reaffirmed medical usefulness of our approach. In the future work, we plan to assess model performance by exploring scalable cohorts with clinically validated associations between drugs and diseases. As our approach supports multilevel biological information fusion, additional pharmaceutical information such as drug side effects information can be also considered to improve our network analysis.
Financial Support: none declared.
Conflict of Interest: none declared.
References
- Bodenreider O. (2004) The Unified Medical Language System (UMLS): integrating biomedical terminology. Nucleic Acids Res., 32, 267D–270D. [DOI] [PMC free article] [PubMed] [Google Scholar]
- Boueuf M. et al. (2003) Inhibition of adhesion breast cancer cells by anticoagulant drugs and cimetidine. Neoplasma, 50, 148–151. [PubMed] [Google Scholar]
- Broen M. et al. (2016) Trajectories of recovery in depressed Parkinson’s disease patients treated with paroxetine or venlafaxine. Parkinsonism Relat. Disord., 23, 80–85. [DOI] [PubMed] [Google Scholar]
- Brown A.S., Patel C.J. (2017) A standard database for drug repositioning. Sci. Data, 4, 170029. [DOI] [PMC free article] [PubMed] [Google Scholar]
- Chen Y., de Rijke M. (2018) A collective variational autoencoder for top-n recommendation with side information. In Proceedings of the 3rd Workshop on Deep Learning for Recommender Systems, pp. 3–9. Association for Computing Machinery, New York, NY, United States.
- Cheng F. et al. (2018) Network-based approach to prediction and population-based validation of in silico drug repurposing. Nat. Commun., 9, 1–12. [DOI] [PMC free article] [PubMed] [Google Scholar]
- Cheng F. et al. (2019) Network-based prediction of drug combinations. Nat. Commun., 10, 1–11. [DOI] [PMC free article] [PubMed] [Google Scholar]
- Cotto K.C. et al. (2018) DGIdb 3.0: a redesign and expansion of the drug–gene interaction database. Nucleic Acids Res., 46, D1068–D1073. [DOI] [PMC free article] [PubMed] [Google Scholar]
- Dakshanamurthy S. et al. (2012) Predicting new indications for approved drugs using a proteochemometric method. J. Med. Chem., 55, 6832–6848. [DOI] [PMC free article] [PubMed] [Google Scholar]
- Davis A.P. et al. (2017) The comparative toxicogenomics database: update 2017. Nucleic Acids Res., 45, D972–D978. [DOI] [PMC free article] [PubMed] [Google Scholar]
- Feng Q. et al. (2018) PADME: a deep learning-based framework for drug–target interaction prediction. arXiv preprint arXiv:1807.09741.
- Fout A. et al. (2017) Protein interface prediction using graph convolutional networks. In: Advances in Neural Information Processing Systems, pp. 6530–6539. Curran Associates Inc., Red Hook, NY, USA.
- Fox S.H. et al. (2017) Trial of dextromethorphan/quinidine to treat levodopa-induced dyskinesia in Parkinson’s disease. Mov. Disord., 32, 893–903. [DOI] [PubMed] [Google Scholar]
- Fralick M. et al. (2019) Assessment of use of combined dextromethorphan and quinidine in patients with dementia or Parkinson disease after us food and drug administration approval for pseudobulbar affect. JAMA Internal Med., 179, 224–230. [DOI] [PMC free article] [PubMed] [Google Scholar]
- Gao K.Y. et al. (2018) Interpretable drug target prediction using deep neural representation. In: IJCAI, pp. 3371–3377.
- Glorot X., Bengio Y. (2010) Understanding the difficulty of training deep feedforward neural networks. In Proceedings of the Thirteenth International Conference on Artificial Intelligence and Statistics, pp. 249–256. Proceedings of the Thirteenth International Conference on Artificial Intelligence and Statistics, AISTATS 2010, Chia Laguna Resort, Sardinia, Italy.
- Gottlieb A. et al. (2011) Predict: a method for inferring novel drug indications with application to personalized medicine. Mol. Syst. Biol., 7, 496. [DOI] [PMC free article] [PubMed] [Google Scholar]
- Greene J.A., Loscalzo J. (2017) Putting the patient back together-social medicine, network medicine, and the limits of reductionism. N. Engl. J. Med., 377, 2493–2499. [DOI] [PubMed] [Google Scholar]
- Guney E. et al. (2016) Network-based in silico drug efficacy screening. Nat. Commun., 7, 10331. [DOI] [PMC free article] [PubMed] [Google Scholar]
- Hamilton W. et al. (2017) Inductive representation learning on large graphs. In: Advances in Neural Information Processing Systems, pp. 1024–1034. Curran Associates Inc., Red Hook, NY, United States.
- Hamosh A. et al. (2004) Online Mendelian Inheritance in Man (OMIM), a knowledgebase of human genes and genetic disorders. Nucleic Acids Res., 33, D514–D517. [DOI] [PMC free article] [PubMed] [Google Scholar]
- He C. et al. (2020) Bipartite graph neural networks for efficient node representation learning. In: Thirty-Fourth AAAI Conference on Artificial Intelligence. AAAI press.
- Kearnes S. et al. (2016) Molecular graph convolutions: moving beyond fingerprints. J. Comput. Aided Mol. Des., 30, 595–608. [DOI] [PMC free article] [PubMed] [Google Scholar]
- Kim S. et al. (2019) PubChem 2019 update: improved access to chemical data. Nucleic Acids Res., 47, D1102–D1109. [DOI] [PMC free article] [PubMed] [Google Scholar]
- Kingma D.P., Ba J. (2015) Adam: a method for stochastic optimization. In: 3rd International Conference on Learning Representations (ICLR).
- Kipf T.N., Welling M. (2017) Semi-supervised classification with graph convolutional networks In: International Conference on Learning Representations (ICLR).
- Kontou P.I. et al. (2016) Network analysis of genes and their association with diseases. Gene, 590, 68–78. [DOI] [PubMed] [Google Scholar]
- Li J., Lu Z. (2012) A new method for computational drug repositioning using drug pairwise similarity. In: 2012 IEEE International Conference on Bioinformatics and Biomedicine, pp. 1–4. IEEE Press. [DOI] [PMC free article] [PubMed]
- Li J. et al. (2016) A survey of current trends in computational drug repositioning. Brief. Bioinf., 17, 2–12. [DOI] [PMC free article] [PubMed] [Google Scholar]
- Li Q. et al. (2018) Deeper insights into graph convolutional networks for semi-supervised learning. In: Thirty-Second AAAI Conference on Artificial Intelligence. AAAI press.
- Lipscomb C.E. (2000) Medical subject headings (MeSH). Bull. Med. Libr. Assoc., 88, 265–266. [PMC free article] [PubMed] [Google Scholar]
- Liu X. et al. (2018) The effects of thiamine on breast cancer cells. Molecules, 23, 1464. [DOI] [PMC free article] [PubMed] [Google Scholar]
- Lubecka K. et al. (2018) Novel clofarabine-based combinations with polyphenols epigenetically reactivate retinoic acid receptor beta, inhibit cell growth, and induce apoptosis of breast cancer cells. Int. J. Mol. Sci., 19, 3970. [DOI] [PMC free article] [PubMed] [Google Scholar]
- Lubecka-Pietruszewska K. et al. (2014) Clofarabine, a novel adenosine analogue, reactivates DNA methylation-silenced tumour suppressor genes and inhibits cell growth in breast cancer cells. Eur. J. Pharmacol., 723, 276–287. [DOI] [PubMed] [Google Scholar]
- Luo H. et al. (2016) Drug repositioning based on comprehensive similarity measures and bi-random walk algorithm. Bioinformatics, 32, 2664–2671. [DOI] [PubMed] [Google Scholar]
- Ma, T. et al. (2018). Drug similarity integration through attentive multi-view graph auto-encoders. In: Proceedings of the Twenty-Seventh International Joint Conference on Artificial Intelligence, IJCAI 2018.
- Menche J. et al. (2015) Uncovering disease–disease relationships through the incomplete interactome. Science, 347, 1257601–1257601. [DOI] [PMC free article] [PubMed] [Google Scholar]
- Mikolov T. et al. (2013) Distributed representations of words and phrases and their compositionality. In: Advances in Neural Information Processing Systems, pp. 3111–3119. Curran Associates Inc., Red Hook, NY, USA.
- Napolitano F. et al. (2013) Drug repositioning: a machine-learning approach through data integration. J. Cheminf., 5, 30. [DOI] [PMC free article] [PubMed] [Google Scholar]
- Nassar M. (2018) Hierarchical bipartite graph convolution networks. In: Appeared in the Workshop on Relational Representation Learning (R2L) at Conference on Neural Information Processing Systems 2018. Curran Associates Inc., Red Hook, NY, USA.
- Ning X., Karypis G. (2012) Sparse linear methods with side information for top-n recommendations. In Proceedings of the sixth ACM conference on Recommender systems, pp. 155–162. Association for Computing Machinery, New York, NY, USA.
- Pavlopoulos G.A. et al. (2018) Bipartite graphs in systems biology and medicine: a survey of methods and applications. Gigascience, 7, giy014. [DOI] [PMC free article] [PubMed] [Google Scholar]
- Perozzi B. et al. (2014) Deepwalk: online learning of social representations. In Proceedings of the 20th ACM SIGKDD International Conference on Knowledge Discovery and Data Mining, pp. 701–710. Association for Computing Machinery, New York, NY, USA.
- Piñero J. et al. (2017) DisGeNet: a comprehensive platform integrating information on human disease-associated genes and variants. Nucleic Acids Res., 45, D833–D839. [DOI] [PMC free article] [PubMed] [Google Scholar]
- Rae C.L. et al. (2016) Atomoxetine restores the response inhibition network in Parkinson’s disease. Brain, 139, 2235–2248. [DOI] [PMC free article] [PubMed] [Google Scholar]
- Sanseau P. et al. (2012) Use of genome-wide association studies for drug repositioning. Nat. Biotechnol., 30, 317–320. [DOI] [PubMed] [Google Scholar]
- Scarselli F. et al. (2008) The graph neural network model. IEEE Trans. Neural Netw., 20, 61–80. [DOI] [PubMed] [Google Scholar]
- Scott D.E. et al. (2016) Small molecules, big targets: drug discovery faces the protein–protein interaction challenge. Nat. Rev. Drug Discov., 15, 533–550. [DOI] [PubMed] [Google Scholar]
- Shi Y. et al. (2017) Arsenic trioxide inhibits cell growth and motility via up-regulation of let-7a in breast cancer cells. Cell Cycle, 16, 2396–2403. [DOI] [PMC free article] [PubMed] [Google Scholar]
- Srivastava N. et al. (2014) Dropout: a simple way to prevent neural networks from overfitting. J. Mach. Learn. Res., 15, 1929–1958. [Google Scholar]
- Tanimoto T. (1957) IBM Internal Report 17th Nov.
- Ursu O. et al. (2017) DrugCentral: online drug compendium. Nucleic Acids Res., 45, D932–D939. [DOI] [PMC free article] [PubMed] [Google Scholar]
- Vaz R.L. et al. (2020) Identification of antiparkinsonian drugs in the 6-hydroxydopamine zebrafish model. Pharmacol. Biochem. Behav., 189, 172828. [DOI] [PubMed] [Google Scholar]
- Veličković P. et al. (2018) Graph attention networks. In: International Conference on Learning Representations (ICLR).
- Wang J.Z. et al. (2007) A new method to measure the semantic similarity of go terms. Bioinformatics, 23, 1274–1281. [DOI] [PubMed] [Google Scholar]
- Warner C.B. et al. (2018) The role of atomoxetine for Parkinson disease-related executive dysfunction: a systematic review. J. Clin. Psychopharmacol., 38, 627–631. [DOI] [PubMed] [Google Scholar]
- Weininger D. (1988) Smiles, a chemical language and information system. 1. Introduction to methodology and encoding rules. J. Chem. Inf. Comput. Sci., 28, 31–36. [Google Scholar]
- Ye H. et al. (2014) Construction of drug network based on side effects and its application for drug repositioning. PLoS One, 9, e87864. [DOI] [PMC free article] [PubMed] [Google Scholar]
- Ye Z. et al. (2015) Improving response inhibition in Parkinson’s disease with atomoxetine. Biol. Psychiatry, 77, 740–748. [DOI] [PMC free article] [PubMed] [Google Scholar]
- Yella J.K. et al. (2018) Changing trends in computational drug repositioning. Pharmaceuticals, 11, 57. [DOI] [PMC free article] [PubMed] [Google Scholar]
- Yildirim M.A. (2007) Drug–target network. Nat. Biotechnol., 25, 1119–1127. [DOI] [PubMed] [Google Scholar]
- Zeng X. et al. (2019) deepDR: a network-based deep learning approach to in silico drug repositioning. Bioinformatics, 35, 5191–5198. [DOI] [PMC free article] [PubMed] [Google Scholar]
- Zesiewicz T.A. et al. (2015) Randomized, controlled pilot trial of solifenacin succinate for overactive bladder in parkinson’s disease. Parkinsonism Relat. Disord., 21, 514–520. [DOI] [PubMed] [Google Scholar]
- Zhang P. et al. (2013) Computational drug repositioning by ranking and integrating multiple data sources. In: Joint European Conference on Machine Learning and Knowledge Discovery in Databases, pp. 579–594. Springer, Berlin, Heidelberg. [Google Scholar]
- Zhang S. et al. (2016) Arsenic trioxide suppresses cell growth and migration via inhibition of mir-27a in breast cancer cells. Biochem. Biophys. Res. Commun., 469, 55–61. [DOI] [PubMed] [Google Scholar]
- Zheng S. et al. (2019) A computational bipartite graph-based drug repurposing method. In: Computational Methods for Drug Repurposing, pp. 115–127. Humana Press, New York, NY. [DOI] [PubMed] [Google Scholar]
- Zitnik M. et al. (2018) Modeling polypharmacy side effects with graph convolutional networks. Bioinformatics, 34, i457–i466. [DOI] [PMC free article] [PubMed] [Google Scholar]