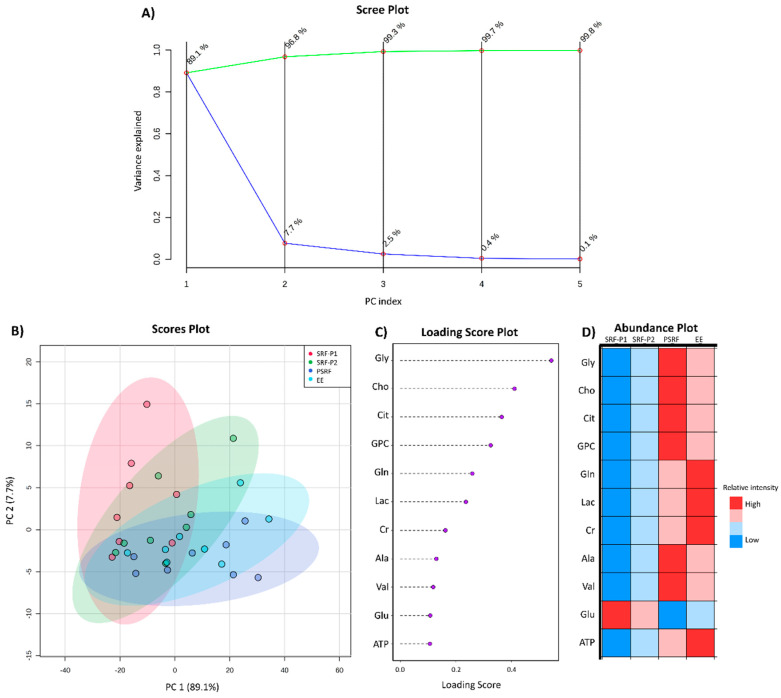
Figure 5.
Intra-ejaculate analysis of the variance of pig seminal plasma. (A) Scree plot showing the individual variance contribution for each principal component (PC) in blue and the cumulative variance explained along the PCs in green. (B) PCA scores plot showing the distribution of the samples in PC1 and PC2. The colored areas represent the 95% confidence interval, depicting which ejaculate-portion each sample belonged to (the first 10 mL from the sperm-rich fraction [SRF-P1], the rest of sperm rich fraction [SRF-P2], the post-sperm-rich fraction [PSRF] and the entire ejaculate [EE]). (C) Representation of the weighted sum of PCA loadings from the first three PCs. (D) Abundance plot representing the relative levels of each metabolite for every ejaculate portion. Color variation from red to blue correspond to high and low relative levels, respectively. Adenosine Triphosphate (ATP), Alanine (Ala), Choline (Cho), Citrate (Cit), Creatinine (Cr), Glutamic acid (Glu), Glutamine (Gln), Glycine (Gly), Glycerophosphocholine (GPC), Lactate (Lac) and Valine (Val).

