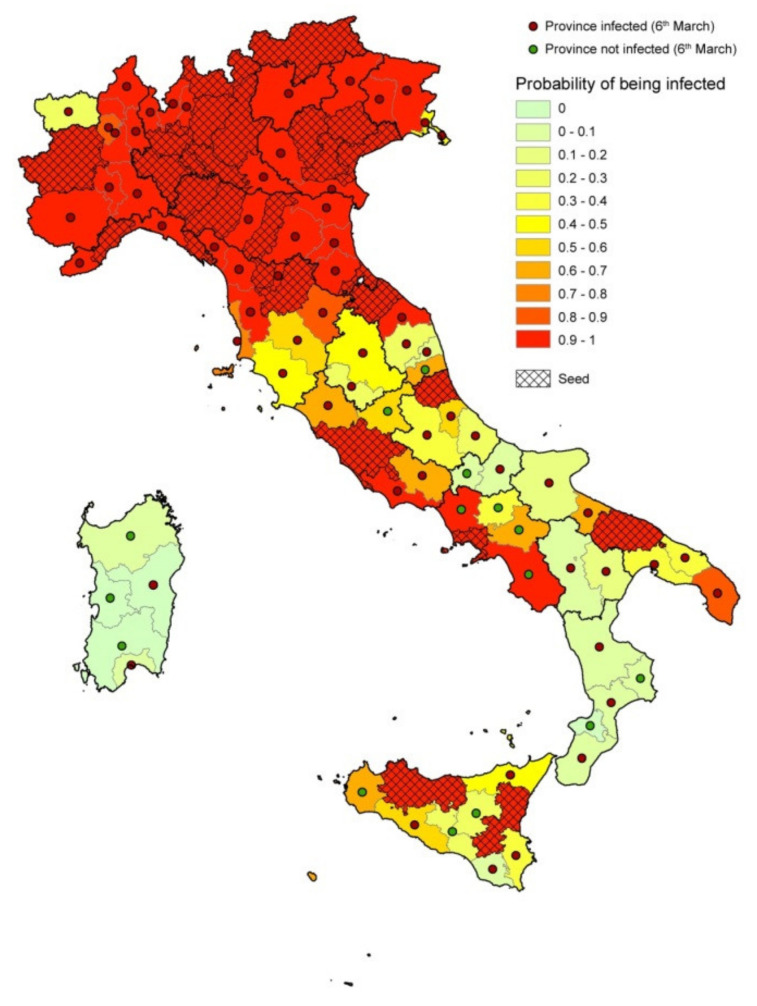
Figure 10.
Results of the model. Provinces are colored based on the estimated probability of being infected; red points show the observed infected provinces at the end of the period (February 26–March 6); the green points represent the noninfected provinces at the end of the period; dashed provinces represent the seeds at the beginning of the period (February 26).

