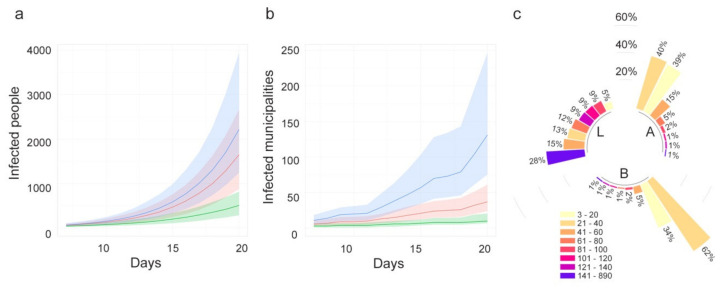
Figure 14.
(a) Number of estimated infected people (median values and 95%CI) and (b) estimated infected municipalities (median values and 95% confidence interval, CI) when the epidemic starts in one seed and lasts 21 days. (c). The blue line represents Lombardy, red line is Abruzzi region and green line, Basilicata region. Degree distribution in the three regions: L = Lombardy, A = Abruzzi, B = Basilicata. Bars are in class percentage descending order.

