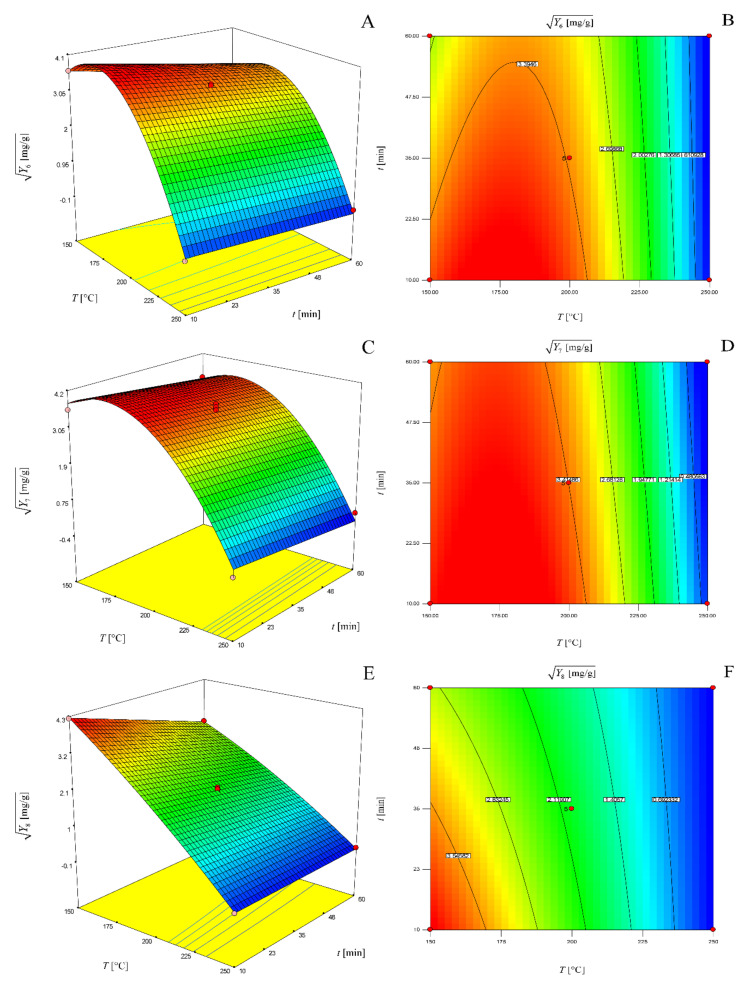
Figure 4.
Three-dimensional response surface (a) and two-dimensional contour plot (b) of the model for determination of glucose yield for a solvent–solid ratio of 20 mL/g; three-dimensional response surface (c) and two-dimensional contour plot (d) of the model for determination of fructose yield for a solvent–solid ratio of 20 mL/g; three-dimensional response surface (e) and two-dimensional contour plot (f) of the model for determination of maltose yield for a solvent–solid ratio of 20 mL/g.

