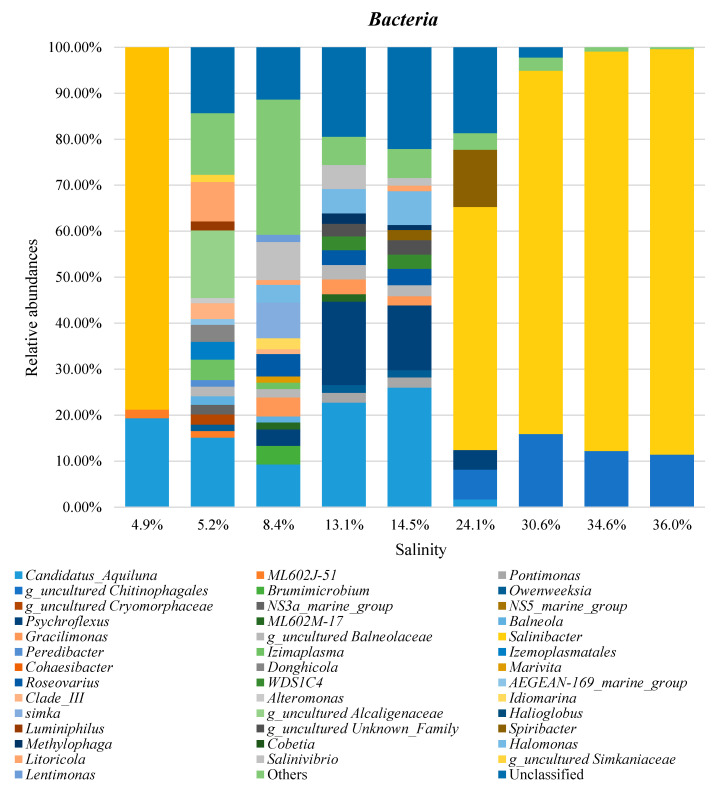
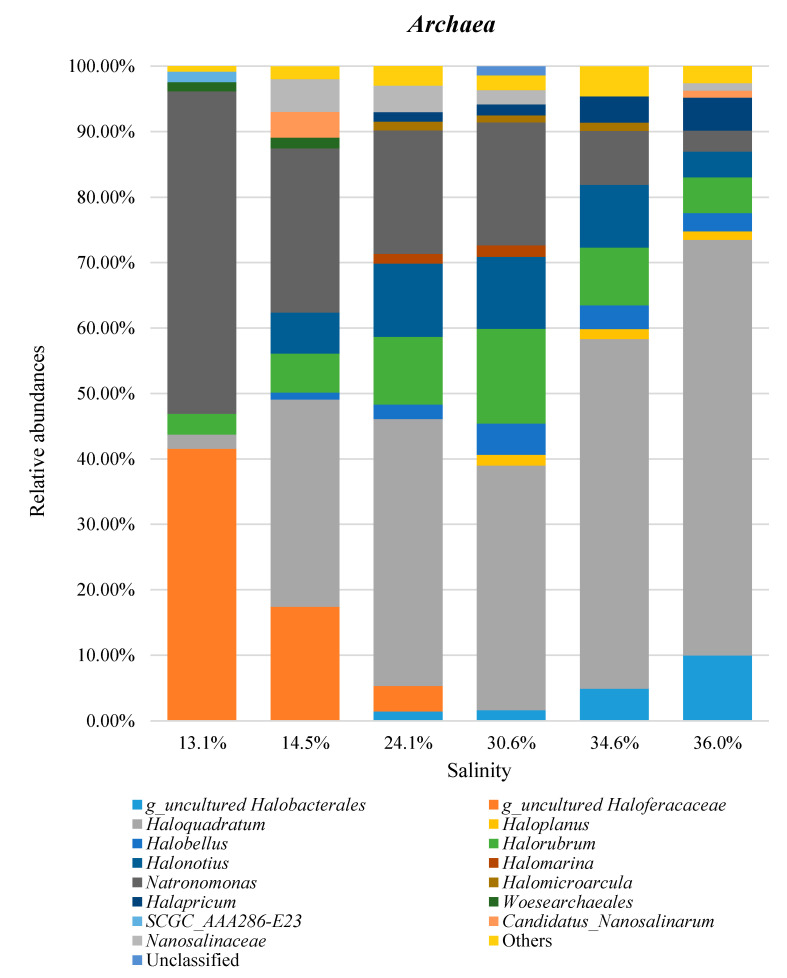
Figure 5.
Bar charts of Bacteria and Archaea genera identified at different salinities in MdS saltern. Groups with relative abundances <1.0% were joined as ‘Others’. Salinity is reported as salt percentage (w/v). ASVs which could not be resolved at the genus level were reported with the notation g_uncultured followed by the name of the closest known parental rank. A list of the identified genera and their relative abundances is reported in Table S5.


