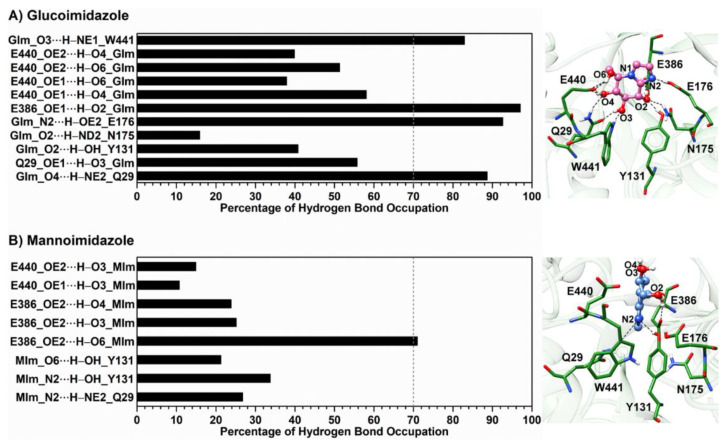
Figure 4.
Percentage of hydrogen bond occupation together with the representative structures of the Os3BGlu7 residues accounting for (A) glucoimidazole and (B) mannoimidazole binding over the last 400 ns of MD simulations. Hydrogen bonds mainly formed between Os3BGlu7 residues and each inhibitor are represented by black dashed lines.

