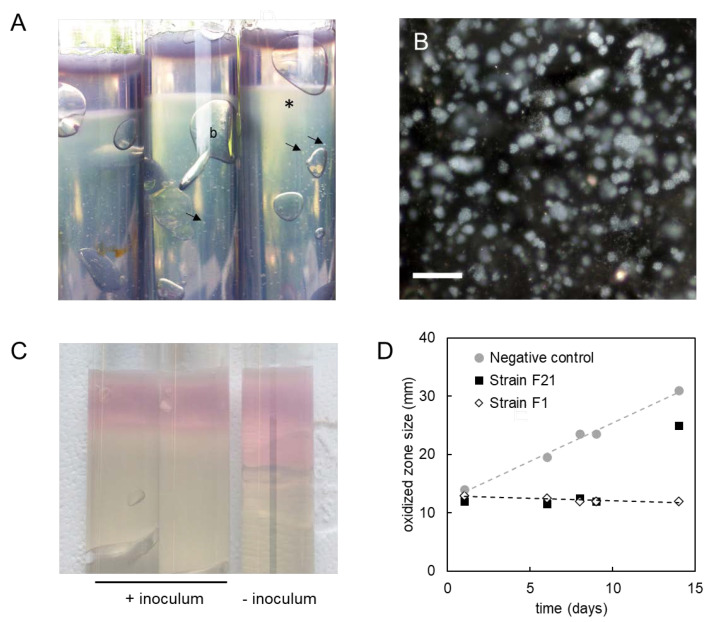
Figure 3.
Growth of strains F1T and F21T in oxygen gradient cultures. (A) Cysteine-reduced cultures of strain F1T after 19 days of incubation. Indicated are visible colonies (arrows), gas bubbles (b) and diffuse growth at the oxidized/reduced interface (*). (B) Micrograph showing the growth of microcolonies at the turbid oxidized/reduced interface. The scale bar represents a length of 100 µM. (C) Sulfide-reduced cultures after 8 days of incubation, of which two were inoculated with strain F21T (left) and one was left uninoculated as the negative control (right). (D) Size of the pink oxidized zone versus incubation time in cultures reduced with sulfide. The negative controls were uninoculated. Plotted values are averages of two replicate cultures, which behaved reproducibly.

