

Abstract
Background
Current risk assessment models (RAMs) for prediction of venous thromboembolism (VTE) risk in the outpatient cancer population have shown poor predictive value in many of the most common cancers. The Comparison of Methods for Thromboembolic Risk Assessment with Clinical Perceptions and AwareneSS in Real Life Patients‐Cancer Associated Thrombosis (COMPASS‐CAT) RAM was derived in this patient population and predicted patients at high risk for VTE even after initiation of chemotherapy. We sought to externally validate this RAM.
Materials and Methods
Patients aged ≥18 years who presented to a tertiary care center between January 1, 2014, and December 31, 2016, with invasive breast, ovarian, lung, or colorectal cancers were included. The COMPASS‐CAT RAM was applied using our health system's tumor registry and variables that were identified by International Statistical Classification of Diseases and Related Health Problems‐9 and ‐10 codes of the electronic health record and independent chart review. The primary endpoint at 6‐month study follow‐up was documented VTE.
Results
A total of 3,814 patients were included. Documented VTE at 6‐month follow‐up occurred in 5.85% of patients. Patients stratified into low/intermediate‐ and high‐risk groups had VTE rates of 2.27% and 6.31%, respectively. The sensitivity, specificity, and negative and positive predictive value of the RAM were 95%, 12%, 97.73%, and 6.31%, respectively. Diagnostic accuracy via receiver operating characteristic curve was calculated at 0.62 of the area under the curve.
Conclusion
In this large retrospective external validation study of the COMPASS‐CAT RAM for VTE in patients with cancer undergoing active treatment, model discrimination was moderate and calibration was poor. The model had good negative predictive value. Further prospective validation studies—especially within 6 months of cancer diagnosis—are needed before the model can be implemented into routine clinical practice for primary thromboprophylaxis of high‐VTE‐risk patients with cancer with solid tumors.
Implications for Practice
This study provides further guidance for researchers and clinicians in determining clinical and laboratory risk factors associated with development of venous thromboembolism among the ambulatory population of patients being treated for lung, breast, colorectal, or ovarian cancer. It validates the COMPASS‐CAT risk model that was developed in this cancer population and suggests that further prospective validation of the model, with more focus on patients within 6 months of their index cancer diagnosis, would likely enhance the accuracy and usefulness of this model as a clinical prediction tool.
Keywords: Risk assessment model, Cancer‐associated thrombosis, Lung cancer, Breast cancer , Colorectal cancer, Ovarian cancer, Venous thronboembolism
Short abstract
Routine assessment of venous thromboembolism risk for ambulatory cancer patients is recommended, but a reliable risk assessment model has not been optimized. This study aimed to validate results of the COMPASS‐CAT risk assessment model, which was first validated in European and Middle Eastern populations, in patients undergoing therapy for cancer in the United States.
Introduction
Venous thromboembolism (VTE) remains an important issue for ambulatory patients with cancer undergoing therapy 1. The overall incidence of symptomatic VTE in outpatients with cancer subtypes such as breast, colon, lung, or ovarian cancer is approximately 3% but increases sixfold in patients undergoing active chemotherapy or in advanced stages of disease 2, 3. Although routine assessment of VTE risk for ambulatory patients with cancer is recommended 4, a reliable VTE risk assessment model (RAM) that would direct primary thromboprophylaxis in high‐VTE‐risk patients has not yet been optimized 5.
The only current evidence‐derived, weighted, and scored VTE RAM for the outpatient population with cancer remains the Khorana VTE score and its extensions 6, 7. The Khorana VTE RAM is applicable for patients with solid tumors at the start of chemotherapy and has undergone extensive external validation 6, 8. It also has recently been incorporated with a cutoff of 2 or more into two recently published placebo‐controlled trials of direct oral anticoagulants (DOACs) in ambulatory patients with cancer 9, 10. However, the Khorana VTE RAM's ability to consistently discriminate high versus low VTE risk in specific cohorts of patients with cancer such as lung cancer—including a recent analysis in patients with lung cancer in the era of targeted therapy—and in subgroups of patients from randomized trials in ambulatory patients with cancer has been suboptimal, with the VTE RAM being unable to predict as much as 70% of a cohort in one randomized, placebo‐controlled trial 11, 12, 13. Thus, an accurate VTE RAM specific to the ambulatory patient with cancer with breast, colon, lung, and ovarian cancer that takes into account both clinical and biomarker‐based risk factors and all forms of chemotherapy continues to remain an unmet clinical need 5.
Recently, a multicenter, prospective, longitudinal, evidence‐derived, weighted, and scored VTE RAM, the prospective Comparison of Methods for Thromboembolic Risk Assessment with Clinical Perceptions and AwareneSS in Real Life Patients‐Cancer Associated Thrombosis (COMPASS‐CAT) RAM, was developed and internally validated in a European and Middle Eastern outpatient population of patients with cancer undergoing chemotherapy for breast, colon, lung, and ovarian cancer, with good discrimination and calibration characteristics 5. The objective of this study was to externally validate using a retrospective design the COMPASS‐CAT RAM in outpatients with cancer undergoing therapy for breast, colon, lung, and ovarian cancer in a large academic health system in the U.S.
Materials and Methods
Inclusion criteria consisted of outpatients with cancer aged ≥18 years who presented at the Monter Cancer Center between January 1, 2014, and December 31, 2016, with breast, colorectal, lung, and ovarian cancer. Patients entered the study at the date of tissue diagnosis per data gathered from the health system's tumor registry, a comprehensive catalog of each patient with cancer evaluated at the Monter Cancer Center and maintained by its treating physicians. The date of first contact with a physician at the Monter Cancer Center represented the starting point (Day 0) that could capture at least a 6‐month longitudinal study period. Patient data were collected up to 12 months from date of first contact and up until the time of death. Cancer stage at the time of first contact was documented in the tumor registry. Medication reconciliations prior to or on the date of first contact contained on the patient's electronic health record (EHR) was queried for the presence of treatment‐dose anticoagulation. Exclusion criteria consisted of all patients with carcinoma in situ (as they were in the derivation study) and patients determined to be on treatment doses of anticoagulation at the time of enrollment.
The COMPASS‐CAT RAM includes eight sections of clinical or laboratory variables as shown in supplemental online Appendix 1. Billing records and EHR data were reviewed, and further chart review was undergone to confirm the occurrence of each of these eight variables. The predisposing risk factors for VTE and VTE events were collected from the EHR using International Statistical Classification of Diseases and Related Health Problems (ICD)‐9 and ‐10 codes as shown in supplemental online Appendix 2. Obesity was determined via a documented body mass index (BMI) ≥30 on the patient's EHR at the time of enrollment. All VTE events collected via initial search of ICD‐9 and ‐10 codes were then confirmed through chart review by one study author (S.N.) using prespecified criteria. A VTE event was confirmed by chart review if two out of three of the following criteria were met: (a) the patient had a new documentation of an ICD‐9 or ‐10 code for VTE outlined in supplemental online Appendix 2; (b) the patient had a pharmacy record that they received treatment doses of anticoagulants (heparin, low‐molecular‐weight heparin, or warfarin); or (c) the patient had evidence of VTE on an objective exam (e.g., Doppler ultrasonography of the extremities, computed tomography scan of the chest with contrast, x‐ray venography, magnetic resonance venography). All remaining VTE events following chart review were confirmed via consensus following review of the chart by three independent study authors. For platelet counts ≥350,000 × 109/L, laboratory data from the patient's EHR was collected, and the highest number captured during the study time frame was used. A sensitivity analysis was also performed that captured platelet counts on the date of first contact (study entry). Recent hospitalization data for an acute medical illness was captured using a combination of billing records and EHR records dating to 6 months prior to date of first contact. A central venous catheter was documented as present if the phrase “midline catheter,” “central line,” “PICC,” and/or “central venous line” was identified on EHR query of nursing documentation between 60 days prior to and 60 days after the first contact date. In order to determine the presence of antihormonal therapy (including aromatase inhibitors [anastrozole, letrozole, exemestane] or tamoxifen) or anthracycline therapy, EHR medication reconciliations and oncology pharmacy records were reviewed for records of active prescriptions from study entry and throughout the study period. Death was captured by chart review and EHR query.
To perform our validation study of the COMPASS‐CAT RAM, expected VTE event rates were calculated using the risk score, and for individual risk factors along with their associated 95% confidence intervals (CIs). We aimed to have sufficient size of a population in order to obtain approximately 23 events per variable as an optimal measure of model validation 14, 15. A logistic regression model was calculated to evaluate the predictive ability of the model. We calculated a binary cutoff to define VTE risk groups into low/intermediate‐ and high‐VTE‐risk categories, and calculated sensitivity, specificity, and negative and positive predictive values (NPVs, PPVs) based on categorization. Receiver operating characteristic (ROC) curves were created to evaluate the overall diagnostic accuracy of our validation set. Area under the ROC curve and the corresponding 95% CI was calculated for model discrimination, and the Hosmer‐Lemeshow test was used for model calibration. All analyses were conducted using SAS software (version 9.4; SAS Institute, Cary, NC). We conducted sensitivity analyses capturing the platelet count on the date of first contact in addition to adjusting for pharmacologic thromboprophylaxis.
The procedures used were reviewed and approved as being in compliance with ethical standards of the responsible institutional review committee at the home institution of the authors. All research activities were in compliance with the World Medical Association Declaration of Helsinki on Ethical Principles for Medical Research Involving Human Subjects.
Results
A total of 6,700 patients were assessed between January 1, 2014, and December 31, 2016, with breast, colorectal, lung, and ovarian cancer, of whom 2,796 were excluded because of predefined exclusionary criteria, and a further 90 patients were excluded because of incomplete records. A total of 3,814 patients met the inclusion criteria as seen in Figure 1.
Figure 1.
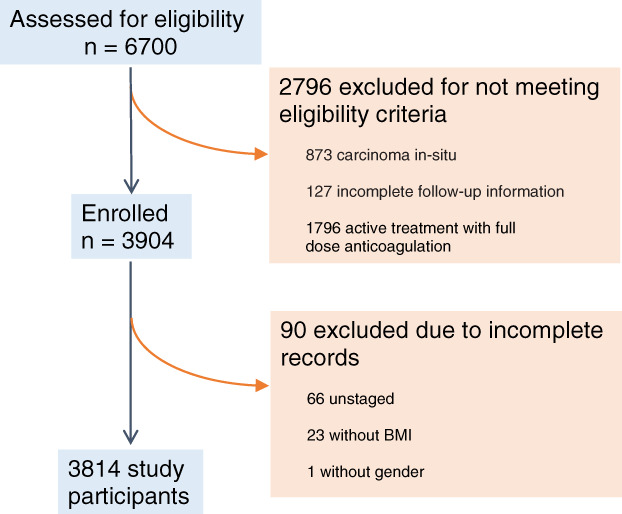
Flow chart of the patients enrolled in the COMPASS‐CAT external validation study.Abbreviation: BMI, body mass index.
As shown in Table 1, the mean age of participants was 64 years, 79% were females, and the mean BMI was 27.9. In terms of cancer type and stage, 48.9% had breast cancer, 17.1% had colon cancer, 29.0% had lung cancer, and 4.9% had ovarian cancer, with 52.1% of cancers being localized, 29.1% locally advanced, and 18.8% metastatic. In terms of time since first contact, the majority of patients (93.8%) were seen more than 6 months after their index cancer diagnosis. Fifteen percent of the study population received thromboprophylaxis with either low‐molecular‐weight heparin (enoxaparin 40 mg s.c. daily or 30 mg s.c. twice daily) or unfractionated heparin (5,000 IU s.c. twice daily). For anticancer treatment and devices, 1.55% had anthracycline therapy, 44.4% antihormonal therapy (62.8% with aromatase inhibitor therapy and 22.3% with tamoxifen), and 9.3% had a central venous catheter (CVC) present. Lastly, relevant percentages of comorbidities are included in Table 1.
Table 1.
Demographic data, cancer characteristics, and associated treatments and comorbidities related to cancer in the validation and derivation cohort of evaluable patients
| Characteristics | Validation cohort (n = 3,814) | COMPASS‐CAT derivation cohort (n = 1,023) |
|---|---|---|
| Age, mean ± SD, yrs | 64 ± 13.0 | 55 ± 12 |
| Gender | ||
| Male | 804 (21.1) | 191 (18.7) |
| Female | 3,010 (78.9) | 832 (81.3) |
| BMI, mean ± SD | 27.9 ± 6.4 | |
| Normal | 1,390 (36.4) | 427 (41.7) |
| Overweight | 1,261 (33.1) | 339 (33.1) |
| Obesity | 1,163 (30.5) | 258 (25.2) |
| Type of cancer | ||
| Breast | 1,867 (48.95) | 629 (61.5) |
| Colon | 654 (17.15) | 170 (16.6) |
| Lung | 1,108 (29.05) | 136 (13.3) |
| Ovarian | 185 (4.85) | 88 (8.6) |
| Cancer stage | ||
| Localized | 1,988 (52.1) | 307 (30.0) |
| Locally advanced | 1,111 (29.1) | 311 (30.4) |
| Metastatic | 715 (18.8) | 405 (39.6) |
| Time since diagnosis, months | ||
| 0–6 | 237 (6.2) | 653 (63.8) |
| >6 | 3,577 (93.8) | 370 (36.2) |
| Anticancer treatment and devices | ||
| Anthracycline | 59 (1.55) | 356 (34.8) |
| Antihormonal | 1,694 (44.4) | 265 (25.9) |
| Anastrozole, letrozole, exemestane only | 1,064 (27.9) | |
| Tamoxifen only | 376 (9.9) | |
| Other antihormonal therapya | 283 (7.4) | |
| CVC presence | 354 (9.3) | 326 (31.9) |
| Comorbidities | ||
| Peripheral vascular disease | 2,150 (56.4) | 25 (2.4) |
| Ischemic stroke | 222 (5.8) | 15 (1.5) |
| Coronary artery disease | 612 (16.1) | 52 (5.1) |
| Hypertension | 2,206 (57.8) | 280 (27.4) |
| Hyperlipidemia | 1,740 (45.6) | 229 (22.4) |
| Diabetes mellitus | 732 (19.2) | 123 (12.0) |
| Obesity | 1,163 (30.5) | 258 (25.2) |
Data are presented as n (%) unless otherwise noted.
Includes fulvestrant, goserelin, leuprolide, and toremifene. Some patients had multiple antihormonal therapies.
Abbreviations: BMI, body mass index; CVC, central venous catheter.
VTE Outcomes
An outcome of deep vein thrombosis or pulmonary embolism occurred in 5.8% of the entire study population at 6 months. In terms of VTE risk factors as used in the COMPASS‐CAT score, Table 2 shows the following risk factors were significantly associated with a VTE outcome: a personal history of VTE (17.4% vs. 5.0%, p = .0001), medical hospitalization (11.6% vs. 4.9%, p = .0001), advanced stage of cancer (10.6% vs. 1.5%, p = .0001), the presence of a central venous catheter (12.2% vs. 5.2%, p = .0001), platelet count ≥350,000 × 109/L (10.9% vs. 3.4%, p = .0001). However, none of the cardiovascular risk factors in the model, either individually or in a tandem of at least two risk factors, were significantly associated with a VTE outcome, and a personal history of peripheral arterial disease was significantly associated with an absence of a VTE outcome (5.0% vs. 7.0%, p = .01). In addition, other factors such as an earlier time of diagnosis of cancer (within 6 months) was not significantly associated with a VTE outcome (5.9% vs. 5.5%, p = .81). Finally and paradoxically, the presence of antihormonal therapy was significantly associated with an absence of a VTE outcome (3.8% vs. 7.5%, p = .0001), whereas the presence of anthracycline‐containing therapy was not significantly associated with a VTE outcome (10.2% vs. 5.8%, p = .16).
Table 2.
VTE risk factor incidence in the cohort group who developed VTE versus those who did not develop VTE
| VTE risk factors | VTE (n = 223) | No VTE (n = 3,591) | p value |
|---|---|---|---|
| Antihormonal therapy or anthracycline‐containing therapy | .0001 | ||
| Yes | 68 (3.97%) | 1,645 (96.03%) | |
| No | 155 (7.38%) | 1,946 (92.62%) | |
| Antihormonal therapy | .0001 | ||
| Yes | 65 (3.84%) | 1,629 (96.16%) | |
| No |
158 (7.45%) |
1,962 (92.55%) | |
| Anthracycline‐containing therapy | .16 | ||
| Yes | 6 (10.17%) | 53 (89.83%) | |
| No | 217 (5.78%) | 3,538 (94.22%) | |
| Hospitalization | .0001 | ||
| Yes | 62 (11.59%) | 473 (88.41%) | |
| No | 161 (4.91%) | 3,118 (95.09%) | |
| Cardiovascular risk factors and comorbidities (composed by at least two of the following predictors: personal history of peripheral artery disease, ischemic stroke, coronary artery disease, hypertension, hyperlipidemia, diabetes, obesity) | .69 | ||
| Yes | 143 (5.74%) | 2,350 (94.26%) | |
| No | 80 (6.06%) | 1,241 (93.94%) | |
| Personal history of peripheral artery disease | .01 | ||
| Yes | 107 (4.98%) | 2,043 (95.02%) | |
| No | 116 (6.97%) | 1,548 (93.03%) | |
| CVA (ischemic stroke) | .99 | ||
| Yes |
13 (5.86%) |
209 (94.14%) |
|
| No |
210 (5.85%) |
3,382 (94.15%) |
|
| Coronary artery disease | .054 | ||
| Yes |
46 (7.52%) |
566 (92.48%) |
|
| No |
177 (5.53%) |
3,025 (94.47%) |
|
| Hypertension | .09 | ||
| Yes |
141 (6.39%) |
2,065 (93.61%) |
|
| No |
82 (5.10%) |
1,526 (94.90%) |
|
| Hyperlipidemia | .81 | ||
| Yes |
100 (5.75%) |
1,640 (94.25%) |
|
| No |
123 (5.93%) |
1,951 (94.07%) |
|
| Diabetes | .11 | ||
| Yes |
52 (7.10%) |
680 (92.90%) |
|
| No |
171 (5.55%) |
2,911 (94.45%) |
|
| Obesity | .88 | ||
| Yes |
67 (5.76%) |
1,096 (94.24%) |
|
| No |
156 (5.88%) |
2,495 (94.12%) |
|
| Time since cancer diagnosis ≤6 months | .81 | ||
| Yes | 210 (5.87%) | 3,367 (94.13%) | |
| No | 13 (5.49%) | 224 (94.51%) | |
| CVC | .0001 | ||
| Yes | 43 (12.15%) | 311 (87.85%) | |
| No | 180 (5.20%) | 3,280 (94.80%) | |
| Platelets count ≥350 × 109/L | .0001 | ||
| Yes | 136 (10.85%) | 1,117 (89.15%) | |
| No | 87 (3.40%) | 2,474 (96.60%) | |
| Advanced stage of cancer | |||
| Yes | 194 (10.62%) | 1,632 (89.38%) | .0001 |
| No | 29 (1.46%) | 1,959 (98.54%) | |
| Personal history of VTE | .0001 | ||
| Yes | 44 (17.39%) | 209 (82.61%) | |
| No | 179 (5.03%) | 3,382 (94.97%) |
Bolded p values are statistically significant.
Abbreviations: CVA, cerebral vascular accident; CVC, central venous catheter; VTE, venous thromboembolism.
Model Discrimination, Calibration, and Qualitative Characteristics
In terms of model discrimination, Figure 2 shows that the area under the ROC curve for the validation sample for risk of VTE was 0.62, indicating moderate discrimination capacity. According to the Hosmer‐Lemeshow test, a p < 2.2e‐16 showed that the model was not well calibrated. Plotting the expected VTE events, according to the model, against the observed VTE events, as well as against the expected observed number of patients without any VTE event, confirmed the poor calibration of the model (Fig. 3). Using the original derivation model's cutoff scores of 0–6 for low/intermediate VTE risk and > 7 for high VTE risk, model characteristics showed an incidence of VTE of 2.3% in low‐VTE‐risk populations versus 6.3% in high‐VTE‐risk populations as shown in Table 3. Model sensitivity, specificity, and negative and positive predictive values with 95% confidence intervals are shown in Table 4. Model sensitivity to rule out VTE was 95.5%, and the specificity and negative predictive values were 12.0% and 97.7%, respectively. Capturing the platelet count on the date of first contact and adjusting for pharmacologic thromboprophylaxis did not appreciably alter any of the performance characteristics of the model, including discrimination, calibration, NPV, PPV, sensitivity, and specificity (data not shown).
Figure 2.
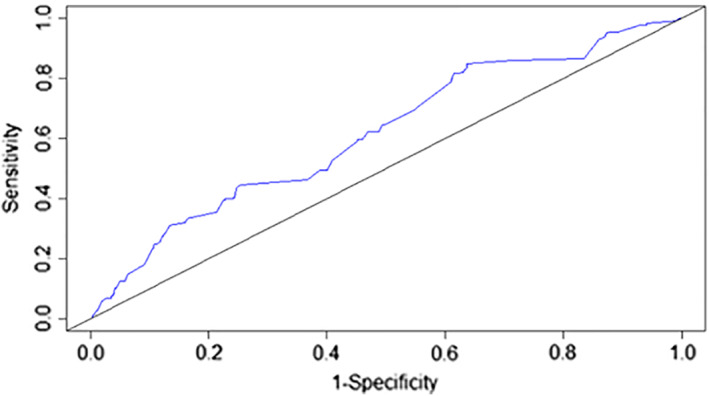
Receiver operating characteristic curve for the COMPASS‐CAT venous thromboembolism (VTE) risk assessment model validation cohort for risk of VTE. Area under the curve is 0.62%.
Figure 3.
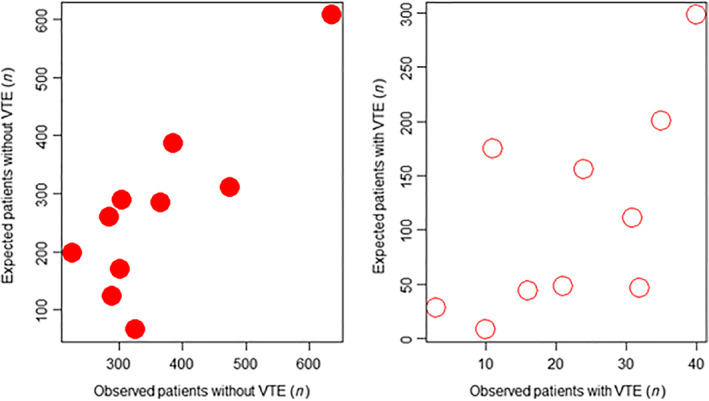
Scatter plot comparing the expected VTE events, according to the risk assessment model, against the observed VTE events in patients both with (white) and without (red) any VTE event.Abbreviation: VTE, venous thromboembolism.
Table 3.
Incidence of VTE according to the stratification of patients to high or low/intermediate risk levels using the COMPASS‐CAT risk assessment model
| VTE risk | VTE events, n (%) | ||
|---|---|---|---|
| No VTE | VTE | Total | |
| High risk (score 7 or more) |
3,161 (93.69%) Breast cancer: 1,604 (97.62%) Colorectal cancer: 516 (91.00%) Lung cancer: 894 (89.22%) Ovarian cancer: 147 (90.74%) |
213 (6.31%) Breast cancer: 39 (2.37%) Colorectal cancer: 51 (8.99%) Lung cancer: 108 (10.78%) Ovarian cancer: 15 (9.26%) |
3,374 (88.4%) |
|
Low/intermediate risk (score 0–6) |
430 (97.73%) Breast cancer: 223 (99.55%) Colorectal cancer: 85 (97.70%) Lung cancer: 99 (93.40%) Ovarian cancer: 23 (100.00%) |
10 (2.27%) Breast cancer: 1 (0.45%) Colorectal cancer: 2 (2.30%) Lung cancer: 7 (6.60%) Ovarian cancer: 0 (0.00%) |
440 (11.5%) |
| Total | 3,591 | 223 | 3,814 |
The number of VTE events per type of cancer in each level of risk is also shown. The type of cancer was unknown for eight patients with documented VTE.
Abbreviation: VTE, venous thromboembolism.
Table 4.
COMPASS‐CAT risk assessment model sensitivity, specificity, and negative and positive predictive values with 95% confidence intervals
| Sensitivity | 95.52% (95% CI: 91.91–97.83) |
| Specificity | 11.97% (95% CI: 10.93–13.08) |
| NPV | 97.73% (95% CI: 95.89–98.75) |
| PPV | 6.31% (95% CI: 6.13–6.50) |
Abbreviations: CI, confidence interval; NPV, negative predictive value; PPV, positive predictive value; RAM, risk assessment model.
Discussion
Predicting the risk of VTE in outpatients with solid tumors remains a difficult clinical issue. The COMPASS‐CAT RAM was derived prospectively using a multinational design and evidence from clinical as well as laboratory variables 5. Although in theory it could be applied to outpatients with solid tumors at any time after treatment initiation, our large external validation of the COMPASS‐CAT RAM, where the majority of patients were seen in our tertiary cancer center after 6 months of treatment initiation, suggests that the model performed less optimistically when this time element lapse was introduced. However, the reasonable discrimination capacity as well as a strong negative predictive value of the model is in line with previous external validation efforts of VTE risk models in patients with cancer, especially outpatients 11, 16, 17, 18. These findings imply that the COMPASS‐CAT RAM will require further prospective validation prior to having meaningful use in clinical practice.
The COMPASS‐CAT RAM joins other models in the prediction of VTE in the outpatient cancer population 7, 18, 19. Among the other risk prediction models developed, the Khorana score has been the most widely studied and validated 7. Recently, placebo‐controlled, randomized studies evaluating thromboprophylaxis with DOACs in patients with elevated risk of VTE per the Khorana score have shown overall benefit in reduction of VTE events along with low incidence of major bleeding 9, 10. However, the generalizability of these studies has been called into question because of the low incidence in these trials of some the most common types of cancer, such as breast, colorectal, and prostate cancers 20. The Khorana prediction score has also been shown to perform poorly in lung cancer, further limiting its generalizability in a large proportion of the solid‐tumor population 11. In an external prospective validation cohort of 819 patients with various solid tumors, NPV, PPV, and sensitivity and specificity of the Khorana VTE RAM were 94.9%, 22.1%, 31.9%, and 91.9%, respectively 6. VTE incidence ranged from 1.5% in the low‐risk group to 17.7% in the high‐VTE‐risk group. A systematic review and meta‐analysis of the Khorana VTE score with 55 cohorts enrolling 34,555 ambulatory patients with cancer determined a 5.0% risk of VTE within the first 6 months in the low‐risk group, with 6.6% risk in the intermediate‐risk group and 11.0% risk in the high‐risk group 21. These studies, among others, emphasize the specificity of the Khorana VTE RAM in predicting ambulatory patients with cancer at high risk of VTE, with the caveat that most VTE events did not occur in patients in the high‐risk group. In comparison with our validation of the COMPASS‐CAT VTE RAM, the negative and positive predictive values are similar, with a greater sensitivity and lower specificity than the Khorana VTE RAM.
The COMPASS‐CAT VTE RAM derivation study specifically addressed these lapses in the Khorana score by focusing on lung, breast, ovarian, and colorectal cancers as well as its potential use not only during treatment initiation (as used by the Khorana score) but at any time after beginning cancer‐directed therapy 5. The COMPASS‐CAT VTE RAM identified novel predictive variables, such as recent hospitalization and cardiovascular risk factors, that identified heightened VTE risk in addition to more classically recognized VTE risk factors, such as time since cancer diagnosis, stage of cancer, use of antihormonal therapy or anthracycline treatment, personal history of VTE, and thrombocythemia 5. Our external validation study identified history of VTE, recent medical hospitalization, cancer stage, presence of CVC, and thrombocythemia as independent variables predicting VTE risk. However, others risk factors in the original model such as use of antihormonal therapy, the presence of cardiovascular risk factors such as stroke, obesity, and hyperlipidemia, and time since cancer diagnosis were not predictive in our validation study. Possible explanations for this include confounding by unadjusted factors; the different demographics of the validation versus derivation populations (the validation population was older and with a greater prevalence of cardiovascular risk factors and comorbidities); the potentially different types of antihormonal regimens used in the two populations, as a majority of our validation cohort were on aromatase inhibitors as their antihormonal therapy, which is less thrombogenic than tamoxifen used for the derivation cohort 22; and importantly, a time bias in the validation versus derivation cohort (6.2% vs. 63.8% within 6 months of cancer diagnosis), which may have led to a lower than expected incidence of VTE, as the majority of VTE events tend to occur within 3 months of the index cancer diagnosis 23.
In terms of model characteristics, the area under the ROC curve of 0.62 found in our external validation study is less optimistic than the original ROC analysis with an area under the curve of 0.85 but is very much in line with previous validation efforts of cardiovascular models using external populations 24. Derivation models tend to be overoptimistic and overfitted compared with later validation efforts of these models, but the moderate discrimination of the model found in our study should give reassurance to clinicians that the model would behave in line with other VTE risk models 25. Indeed, the NPV of 97.7% for the model found in our validation study reveals the potential for the COMPASS‐CAT VTE RAM to identify low‐VTE‐risk patients that potentially would not benefit from an aggressive strategy of primary thromboprophylaxis.
Our study found that model calibration for the COMPASS‐CAT VTE RAM was poor. The initial derivation study for the COMPASS‐CAT VTE RAM found an annual VTE incidence of 8.6%. Patients stratified into a high VTE risk using a cutoff of 7 or more points had a VTE rate of 13%, whereas those in low/intermediate VTE risk using a cutoff of 0–6 points had a VTE rate of 1.7%. In our external validation study, the 6‐month rate of VTE was 5.8%. We found that by using model cutoffs of 0–6 or ≥ 7 points, patients stratified into low/intermediate‐ and high‐VTE‐risk groups had VTE rates of 2.27% and 6.31%, respectively. These observations are also consistent with the poor PPV of 6.3% of the model found in our study. As a threshold rate of 10% or greater at 6 months for symptomatic VTE appears to be of clinical value in separating high‐ versus non–high‐VTE‐risk groups based on VTE risk models in outpatients with cancer 10, 19, the COMPASS‐CAT VTE RAM may require further prospective validation in thromboprophylactic studies with more focus on patients within 6 months of their index cancer diagnosis.
Limitations of our study include its retrospective nature, limitations of variables derived from claims codes in terms of their specificity, the potential for missing data, the potential for time bias in terms of entry of the patient into our study versus actual time of diagnosis of index cancer, and the potential to have underrepresented VTE events. In order to mitigate the risk of missing data from EHR records, we performed careful chart review of all possible VTE events initially flagged by either presence of an ICD‐9 or ‐10 code or anticoagulation, and maintained a strict criteria of confirming VTE events as outlined. However, our study represented a large and diverse patient population of 3,814 outpatients with solid tumors entering a tertiary academic cancer center, with 223 confirmed VTE events. For VTE events, a potential limitation stems from the inclusion of catheter‐related VTE in the model, as thromboprophylaxis does not appear to alter their natural history, but the number of these events was small. In terms of our model validation efforts, our study achieved 23 events per variable, which was more robust than the 10 events per variable of the derivation trial. The numbers of patients with ovarian cancer in our cohort were small, and limitation of the COMPASS‐CAT RAM in this population highlights the need to further study this patient group.
Conclusion
Our retrospective external validation of the COMPASS‐CAT VTE RAM using a large cohort of outpatients with breast, lung, colorectal, and ovarian cancer revealed that the model had moderate discrimination and good NPV but poor calibration using the defined cutoffs of 0–6 versus 7 or more points as well as poor specificity. Further work on prospective validation of the model, with more focus on patients within 6 months of their index cancer diagnosis, is needed.
Author Contributions
Conception/design: Alex C. Spyropoulos, Joanna B. Eldredge, Lalitha N. Anand, David J. Rosenberg
Collection and/or assembly of data: Joanna B. Eldredge, Lalitha N. Anand, Michael Qiu, Soheila Nourabadi
Data analysis and interpretation: Meng Zhang
Manuscript writing: Alex C. Spyropoulos, Joanna B. Eldredge, Meng Zhang, Michael Qiu
Final approval of manuscript: Alex C. Spyropoulos, Joanna B. Eldredge, Lalitha N. Anand, Meng Zhang, Michael Qiu, Soheila Nourabadi, David J. Rosenberg
Disclosures
Alex C. Spyropoulos: Janssen, Boehringer Ingelheim (H, RF), Bayer, ATLAS ARO (C/A). The other authors indicated no financial relationships.
(C/A) Consulting/advisory relationship; (RF) Research funding; (E) Employment; (ET) Expert testimony; (H) Honoraria received; (OI) Ownership interests; (IP) Intellectual property rights/inventor/patent holder; (SAB) Scientific advisory board
Supporting information
See http://www.TheOncologist.com for supplemental material available online.
Supplemental Appendices
Acknowledgments
We acknowledge Thomas Chararel and Sonia Krishankumar for their assistance with the data set.
Disclosures of potential conflicts of interest may be found at the end of this article.
No part of this article may be reproduced, stored, or transmitted in any form or for any means without the prior permission in writing from the copyright holder. For information on purchasing reprints contact Commercialreprints@wiley.com. For permission information contact permissions@wiley.com.
References
- 1. Lyman GH, Khorana AA, Falanga A. Thrombosis and cancer: Emerging data for the practicing oncologist. Am Soc Clin Oncol Educ Book 2013. [DOI] [PubMed] [Google Scholar]
- 2. Moore RA, Adel N, Riedel E et al. High incidence of thromboembolic events in patients treated with cisplatin‐based chemotherapy: A large retrospective analysis. J Clin Oncol 2011;29:3466–3473. [DOI] [PMC free article] [PubMed] [Google Scholar]
- 3. Tran BH, Nguyen TJ, Hwang BH et al. Risk factors associated with venous thromboembolism in 49,028 mastectomy patients. Breast 2013;22:444–448. [DOI] [PubMed] [Google Scholar]
- 4. Kahn SR, Lim W, Dunn AS et al. Prevention of VTE in nonsurgical patients: Antithrombotic Therapy and Prevention of Thrombosis, 9th ed: American College of Chest Physicians Evidence‐Based Clinical Practice Guidelines. Chest 2012;141(suppl 2):e195S–e226S. [DOI] [PMC free article] [PubMed] [Google Scholar]
- 5. Gerotziafas GT, Taher A, Abdel‐Razeq H et al. A predictive score for thrombosis associated with breast, colorectal, lung, or ovarian cancer: The prospective COMPASS‐cancer‐associated thrombosis study. The Oncologist 2017;22:1222–1231. [DOI] [PMC free article] [PubMed] [Google Scholar]
- 6. Ay C, Dunkler D, Marosi C et al. Prediction of venous thromboembolism in cancer patients. Blood 2010;116:5377–5382. [DOI] [PubMed] [Google Scholar]
- 7. Khorana AA, Kuderer NM, Culakova E et al. Development and validation of a predictive model for chemotherapy‐associated thrombosis. Blood 2008;111:4902–4907. [DOI] [PMC free article] [PubMed] [Google Scholar]
- 8. Verso M, Agnelli G, Barni S et al. A modified Khorana risk assessment score for venous thromboembolism in cancer patients receiving chemotherapy: The Protecht score. Intern Emerg Med 2012;7:291–292. [DOI] [PubMed] [Google Scholar]
- 9. Khorana AA, Soff GA, Kakkar AK et al. Rivaroxaban for thromboprophylaxis in high‐risk ambulatory patients with cancer. N Engl J Med 2019;380:720–728. [DOI] [PubMed] [Google Scholar]
- 10. Carrier M, Abou‐Nassar K, Mallick R et al. Apixaban to prevent venous thromboembolism in patients with cancer. N Engl J Med 2019;380:711–719. [DOI] [PubMed] [Google Scholar]
- 11. Kuderer NM, Poniewierski MS, Culakova E et al. Predictors of venous thromboembolism and early mortality in lung cancer: Results from a global prospective study (CANTARISK). The Oncologist 2018;23:247–255. [DOI] [PMC free article] [PubMed] [Google Scholar]
- 12. Agnelli G, George DJ, Kakkar AK et al. Semuloparin for thromboprophylaxis in patients receiving chemotherapy for cancer. N Engl J Med 2012;366:601–609. [DOI] [PubMed] [Google Scholar]
- 13. Mansfield AS, Tafur AJ, Wang CE et al. Predictors of active cancer thromboembolic outcomes: Validation of the Khorana score among patients with lung cancer. J Thromb Haemost 2016;14:1773–1778. [DOI] [PMC free article] [PubMed] [Google Scholar]
- 14. Peduzzi P, Concato J, Kemper E et al. A simulation study of the number of events per variable in logistic regression analysis. J Clin Epidemiol 1996;49:1373–1379. [DOI] [PubMed] [Google Scholar]
- 15. Wasson JH, Sox HC, Neff RK et al. Clinical prediction rules. Applications and methodological standards. N Engl J Med 1985;313:793–799. [DOI] [PubMed] [Google Scholar]
- 16. Alexander M, Ball D, Solomon B et al. Dynamic thromboembolic risk modelling to target appropriate preventative strategies for patients with non‐small cell lung cancer. Cancers (Basel) 2019;11. [DOI] [PMC free article] [PubMed] [Google Scholar]
- 17. Hachey KJ, Hewes PD, Porter LP et al. Caprini venous thromboembolism risk assessment permits selection for postdischarge prophylactic anticoagulation in patients with resectable lung cancer. J Thorac Cardiovasc Surg 2016;151:37–44.e31. [DOI] [PubMed] [Google Scholar]
- 18. Ahn S, Lim KS, Lee YS et al. Validation of the clinical prediction rule for recurrent venous thromboembolism in cancer patients: The Ottawa score. Support Care Cancer 2013;21:2309–2313. [DOI] [PubMed] [Google Scholar]
- 19. Ay C, Dunkler D, Simanek R et al. Prediction of venous thromboembolism in patients with cancer by measuring thrombin generation: Results from the Vienna Cancer and Thrombosis Study. J Clin Oncol 2011;29:2099–2103. [DOI] [PubMed] [Google Scholar]
- 20. Agnelli G. Direct oral anticoagulants for thromboprophylaxis in ambulatory patients with cancer. N Engl J Med 2019;380:781–783. [DOI] [PubMed] [Google Scholar]
- 21. Mulder FI, Candeloro M, Kamphuisen PW et al. The Khorana score for prediction of venous thromboembolism in cancer patients: A systematic review and meta‐analysis. Haematologica 2019;104:1277–1287. [DOI] [PMC free article] [PubMed] [Google Scholar]
- 22. Walker AJ, West J, Card TR et al. When are breast cancer patients at highest risk of venous thromboembolism? A cohort study using English health care data. Blood 2016;127:849–857; quiz 953. [DOI] [PMC free article] [PubMed] [Google Scholar]
- 23. Blom JW, Doggen CJ, Osanto S et al. Malignancies, prothrombotic mutations, and the risk of venous thrombosis. JAMA 2005;293:715–722. [DOI] [PubMed] [Google Scholar]
- 24. Stuck AK, Spirk D, Schaudt J et al. Risk assessment models for venous thromboembolism in acutely ill medical patients. A systematic review. Thromb Haemost 2017;117:801–808. [DOI] [PubMed] [Google Scholar]
- 25. Rosenberg D, Eichorn A, Alarcon M et al. External validation of the risk assessment model of the International Medical Prevention Registry on Venous Thromboembolism (IMPROVE) for medical patients in a tertiary health system. J Am Heart Assoc 2014;3:e001152. [DOI] [PMC free article] [PubMed] [Google Scholar]
Associated Data
This section collects any data citations, data availability statements, or supplementary materials included in this article.
Supplementary Materials
See http://www.TheOncologist.com for supplemental material available online.
Supplemental Appendices