

Abstract
Background
The calculation of the tumor burden score (TBS) is not perfect because the bilobar spread of colorectal liver metastasis (CRLM) is neglected. The identification of an ideal prognostic scoring system for CRLM remains controversial.
Materials and Methods
Patients who underwent curative intent liver resection for CRLM from one medical center were enrolled in cohort 1 (787 patients) and cohort 2 (162 patients). Tumor relapse‐free survival (RFS) was the main outcome. A Cox regression model was used to identify independent predictors of prognosis. The time‐dependent area under the curve, calibration curve, and C‐index were employed to validate the predictive ability of the survival model.
Results
Modified TBS (mTBS) was established by a mathematical equation with parameters including CRLM size, CRLM number, and unilobar or bilobar metastasis. Five preoperative predictors of worse RFS were identified in cohort 1 and incorporated into the Comprehensive Evaluation of Relapse Risk (CERR) score: KRAS/NRAS/BRAF‐mutated tumor (1 point); node‐positive primary (1 point); extrahepatic disease (1 point); carcinoembryonic antigen level > 200 ng/mL or carbohydrate antigen 19‐9 (CA19‐9) >200 U/mL (1 point); and mTBS between 5 and 11 (1 point) or 12 and over (2 points). Patients in cohort 1 were stratified by their CERR score into risk groups: the high‐risk group (CERR score 4 or more), the medium‐risk group (CERR score 2–3), and the low‐risk group (CERR score 0–1). Importantly, internal validation in cohort 1 and further validation in cohort 2 both showed the superior discriminatory capacity of the CERR score.
Conclusion
mTBS should be promoted. The CERR score is a powerful prognostic tool that can help determine optimal clinical management strategies.
Implications for Practice
This work resulted in the successful modification of the tumor burden score and development of a comprehensive and practical prognostic scoring system—the Comprehensive Evaluation of Relapse Risk (CERR) score. The CERR score, with a better prognostic discriminatory ability, outperformed the Fong score. Perhaps more importantly, the CERR score is a powerful prognostic tool because it unified the most consistently reported prognostic factors. Therefore, the CERR score can assist doctors in determining optimal clinical management strategies.
Keywords: Colorectal cancer, Metastasis, Relapse, Prognosis, Hepatectomy
Short abstract
The tumor burden score (TBS) is a prognostic indicator of the cumulative effect of tumor size and tumor number on survival; however, the score is not perfect because bilobar spread of colorectal liver metastases (CRLM) is neglected. This article reports a modified TBS that unifies three parameters (CRLM size, CRLM number, and unilobar/bilobar metastasis) and development of a more comprehensive and practical prognostic scoring system—the Comprehensive Evaluation of Relapse Risk (CERR) score.
Introduction
Colorectal cancer (CRC) was estimated to affect 1.8 million individuals globally in 2018 1, and approximately 50% of these patients developed liver metastases 2. Although hepatic resection of colorectal liver metastasis (CRLM) offers the best chance for a cure and long‐term survival 2, the postoperative recurrence rate is still greater than 50% within the first 2 posthepatectomy years 3. Various studies have identified prognostic factors for postoperative recurrence and survival. To stratify patients with CRLM into different risk groups, some key prognostic factors have been consolidated into prognostic scoring systems, such as the Nordlinger score 4, the Fong score 5, and the GAME score (summarized in supplemental online Table 1) 6. To determine the optimal clinical management strategies, the prognostic scoring systems could be useful in selecting patients who would benefit from liver resection, neoadjuvant chemotherapy, or adjuvant chemotherapy.
The first prognostic scoring system was proposed by Nordlinger and colleagues in 1996 4. Based on the analysis of 1,568 patients from multiple centers, Nordlinger et al. identified seven independent prognostic factors: age, serosal invasion of primary tumor, resection margin, interval between CRC surgery and diagnosis of CRLM, lymph node‐positive primary, number of CRLMs, and maximum size of CRLMs (supplemental online Table 1). The latter four factors, together with serum carcinoembryonic antigen (CEA) level, constitute the Fong prognostic scoring system (supplemental online Table 1) 5. The Fong prognostic scoring system 5, proposed in 1999, has been widely used to stratify patients based on their likelihood of recurrence. However, the Nordlinger and Fong scores were based on patients who underwent surgery during the 1980s and 1990s. The selection of patients for hepatic resection was previously stringent, so the Nordlinger and Fong scores may not be suitable for the era of the “modern aggressive approach to CRLM.” Furthermore, the Nordlinger and Fong scores have been criticized for their reliance on traditional clinicopathological variables at a time when the importance of tumor biology is increasingly being recognized 6.
Recently, the Genetic and Morphological Evaluation (GAME) scoring system was developed by Margonis and colleagues 6. GAME is the first prognostic scoring system to incorporate a composite variable (tumor burden score) and genetic information (KRAS mutation status; supplemental online Table 1). However, there are still several flaws in the GAME scoring system. First, although the tumor burden score (TBS) is a prognostic indicator that reflects the cumulative impact of tumor size and tumor number on survival 7, TBS does not take spatial factor—unilobar or bilobar metastasis—into account. Second, in addition to KRAS, the NRAS and BRAF genes are considered important biomarkers and prognostic factors for predicting outcomes after CRLM resection 8. Only KRAS mutational status was included in the GAME scoring system. Third, other factors, such as serum carbohydrate antigen 19‐9 (CA19‐9) and location of primary tumor, have been confirmed to be associated with prognosis, but few studies have included them in scoring system analysis. In addition, few prognostic scoring systems have been established among Chinese patients. Some prognostic‐scoring studies, including patients primarily from America or Europe, might not be applicable for Chinese patients because of racial or genetic differences. Thus, this study was designed to modify the TBS and to develop a comprehensive prognostic scoring system among Chinese patients.
Materials and Methods
Study Population
All adult patients who underwent curative‐intent liver resection for CRLM at Zhongshan Hospital in Shanghai and had available data on KRAS/NRAS/BRAF mutation status, were eligible for inclusion in the retrospective cohort study. Patients from June 2010 to January 10, 2018, were included in the data cohort 1; patients from January 11, 2018, to September 2018 were included in the data cohort 2. The following exclusion criteria were applied: (a) the histologic type of tumor was not called adenocarcinoma, (b) peritoneal metastasis, (c) R2 resection, (d) history of previous hepatectomy, and (e) incomplete data. All detailed data including demography, characteristics of primary tumor and liver metastases, clinical information, and follow‐up data of patients were documented in the electronic medical database. This study was approved by the Ethics Committee of Zhongshan Hospital in accordance with the Declaration of Helsinki.
Determination of CEA and CA19‐9 Cut‐Off Level, and KRAS/NRAS/BRAF Mutations
Serum CEA cut‐off level value was 200 ng/mL, the same as that of Fong score; serum CA19‐9 cut‐off level value, determined by X‐tile software, was 200U/mL 9; As previously described 10, KRAS/NRAS/BRAF mutational analysis was performed, based on amplification refractory mutation system technology in a certified laboratory (supplemental online Table 2).
Calculation of the Modified Tumor Burden Score
The modified tumor burden score (mTBS) model was developed, validated, and compared in cohort 1. As Sasaki et al. previously proposed 7, TBS2 = (maximum CRLM diameter)2 + (number of CRLM)2. mTBS model introduced unilobar and/or bilobar metastasis on the basis of TBS model (Fig. 1A–C): mTBS2 = eχ × [(maximum CRLM diameter)2 + (number of CRLM)2], if unilobar metastasis, χ = 0; if bilobar metastasis, χ = 1; e (natural constant) = 2.71828. Here, mTBS cut‐off value was also determined by X‐tile software 9. The reason why and how tumor burden score was modified is discussed in the Discussion section.
Figure 1.
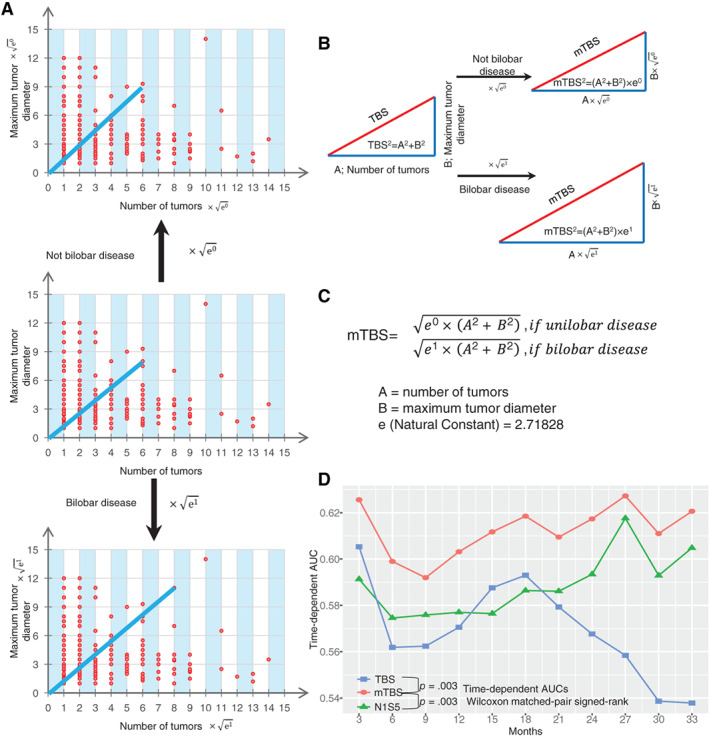
Establishment of mTBS. (A, B): Pattern diagrams of mTBS. (C): Calculation of mTBS: mTBS2 = eχ × [(maximum colorectal liver metastasis [CRLM] diameter)2 + (number of CRLM)2], if unilobar metastasis, χ = 0; if bilobar metastasis, χ = 1; e (natural constant) = 2.71828. (D): Time‐dependent AUCs of mTBS in Cohort 1; mTBS, modified tumor burden score, three categories: score <5, score 5–12, and score >12; TBS, tumor burden score, 3 categories: score <3, score 3–9, and score >9; N1S5, number of CRLM >1 and/or size of CRLM ≥5 cm, 3 categories: number = 1 and size <5 cm, number >1 only or size ≥5 cm only, number >1 and size ≥5 cm.Abbreviations: AUC, area under the curve; mTBS, modified tumor burden score; TBS, tumor burden score
Definition of the “N1S5” Model
According to the Fong score, patients with CRLM can be divided into three categories by combining the two factors: number of CRLM and size of CRLM. Therefore, the “N1S5” model was established to classify patients into three categories (supplemental online Table 1): number of CRLM = 1 and size <5 cm; number >1 only or size ≥5 cm only; and number >1 and size ≥5 cm.
Calculations of GAME Score and Fong Score
The GAME scores were as follows 6: KRAS mutation (1 point); CEA level ≥20 ng/mL (1 point); primary lymph node positive (1 point); TBS between 3 and 8 (1 point) or ≥9 (2 points); and extrahepatic disease (2 points; supplemental online Table 1).
The Fong scores were as follows 5: number of CRLM more than 1 (1 point); maximum CRLM diameter more than 5 cm (1 point); CEA level >200 ng/mL (1 point); primary lymph node positive (1 point); a disease‐free interval of less than 12 months after the diagnosis of primary colorectal cancer (1 point; supplemental online Table 1).
Follow‐up
Patients were followed up mainly through outpatient clinic visits every 2–3 months for the first 2 years after operation, every 6 months for the next 3 years, and once per year thereafter. Physical examination, serum CEA and CA19‐9 tests, chest computed tomography (CT) scan, and abdominal CT and magnetic resonance imaging were performed at each follow‐up, as well as colonoscopy once per year after the surgery. The starting point of follow‐up was the initial liver resection, and the endpoint of follow‐up was the evidence of tumor relapse or death.
Model Establishment and Validation
The CERR scoring model was developed in cohort 1. The Kaplan‐Meier method was applied in relapse‐free survival (RFS) analysis to assess the oncologic outcome. Factors with a value of p < .10 in univariable analysis were included in the multivariable analysis. The Cox proportional hazards regression model was used to identify independent predictors of prognosis in multivariable analysis. Hazard ratios (HRs) and 95% confidence intervals (CIs) were calculated using the Cox proportional hazards model. Factors with a value of p < .05 in multivariable analysis were included in the CERR score.
Internal validation was performed in cohort 1, and further validation was performed in cohort 2. The discriminatory ability of the model was evaluated by time‐dependent area under the curve (AUC). The accuracy of model was further verified by bootstrap validation using computer resampling for 1,000 repetitions. The calibration curve was employed to detect the concentricity between the model probability curve and the ideal curve. The index of concordance (C‐index) was also employed to validate the predictive ability of a survival model.
Statistical Analysis
The difference between groups was assessed by t tests, Mann‐Whitney U tests, chi‐square tests, or Fisher's exact tests when appropriate. Wilcoxon matched‐pair signed‐rank tests were applied in the overall comparison of time‐dependent AUC between two groups. Two‐tailed tests were used, and a p value less than .05 was considered statistically significant. IBM SPSS software version 24 and R software (IBM, Armonk, NJ; https://www.r-project.org) were used for statistical analysis. The survival curve was plotted with the survminer package (version 0.4.4; CRAN.R‐project.org/package=survminer). Time‐dependent AUC was calculated with the timeROC package (version 0.3; CRAN.R-project.org/package=timeROC). The calibration curve was plotted, and the C‐index was calculated with the rms package (version 5.1–3.1; CRAN.R-project.org/package=rms).
Results
Characteristics of the Patients and Lesions in Cohort 1
The demographic and clinicopathological characteristics of the patients in cohort 1 are summarized in Table 1. From June 2010 to January 2018, a total of 787 patients who underwent hepatic resection of CRLM were included. The patients included 541 men and 246 women with an age of 59.4 ± 10.5 years. A total of 558 (70.9%) patients had primary lymph node metastasis. Preoperative CEA >200 ng/mL was found in 73 (9.3%) patients, and CA19‐9 > 200 U/mL was found in 108 (13.7%) patients. A total of 345 (43.8%) patients had KRAS/NRAS/BRAF‐mutated tumors. Eighty‐two (10.4%) patients suffered from extrahepatic disease (EHD).
Table 1.
Characteristics of patients and lesions in cohort 1
| Characteristics | Total (n = 787) |
|---|---|
| Patient characteristics | |
| Age, mean (SD), yr | 59.4 ± 10.5 |
| Female sex, n (%) | 246 (31.3) |
| Primary tumor characteristics, n (%) | |
| Right‐sided colon | 152 (19.3) |
| Left‐sided colon | 322 (40.9) |
| Rectum | 313 (39.8) |
| T stage: T1–T2 | 72 (9.1) |
| T stage: T3–T4 | 715 (90.9) |
| N stage: node positive | 558 (70.9) |
| Preoperative factors, n (%) | |
| Preoperative CEA >200 ng/mL | 73 (9.3) |
| Preoperative CA19‐9 > 200 U/mL | 108 (13.7) |
| Preoperative CEA >200 ng/mL or CA19‐9 > 200 U/mL | 154 (19.6) |
| Preoperative CEA >200 ng/mL and CA19‐9 > 200U/mL | 27 (3.4) |
| KRAS/NRAS/BRAF mutated, n (%) | 345 (43.8) |
| KRAS mutated | 303 (38.5) |
| NRAS mutated | 27 (3.4) |
| BRAF mutated | 17 (2.2) |
| CRLM characteristics, n (%) | |
| Synchronous CRLM | 621 (78.9) |
| Number of CRLM | |
| 1 | 306 (38.9) |
| 2–3 | 246 (31.3) |
| 4–5 | 105 (13.3) |
| >5 | 130 (16.5) |
| Size of largest CRLM ≥5 cm | 204 (25.9) |
| Bilobar disease | 337 (42.8) |
| TBS | |
| <3 | 176 (22.4) |
| 3‐9 | 552 (66.3) |
| >9 | 89 (11.3) |
| mTBS | |
| <5 | 311 (39.5) |
| 5‐12 | 355 (45.1) |
| >12 | 121 (15.4) |
| Extrahepatic disease, n (%) | 82 (10.4) |
| Fong score, n (%) | |
| 0–1 | 140 (17.8) |
| 2–3 | 547 (69.5) |
| 4–5 | 100 (12.7) |
| GAME score, n (%) | |
| 0–1 | 135 (17.2) |
| 2–3 | 499 (63.4) |
| 4–7 | 153 (19.4) |
| Surgical procedure, n (%) | |
| Resection only | 695 (88.3) |
| Resection plus ablation | 92 (11.7) |
Abbreviations: CEA, carcinoembryonic antigen; CRLM, colorectal liver metastasis; GAME, Genetic and Morphological Evaluation; mTBS, modified tumor burden score; TBS, tumor burden score.
mTBS
The calculation of mTBS was based on the mathematical equation shown in Figure 1C. The continuous variable mTBS was divided into three “intervals” (Table 1): mTBS less than 5 (interval 1), 311 (39.5%) patients; mTBS 5–12 (interval 2), 355 (45.1%) patients; and mTBS 12 or higher (interval 3), 121 (15.4%) patients. The three intervals were associated with progressively worse RFS (supplemental online Fig. 1A). Furthermore, the mTBS model had better prognostic accuracy than the TBS model and N1S5 model (Fig. 1D; supplemental online Fig. 1; supplemental online Table 3). The time‐dependent AUCs of the mTBS model were larger than those of the TBS model and the N1S5 model at a series of time points (Fig. 1D; supplemental online Table 3). In addition, the mTBS model should be more informative than only considering number or size of CRLMs because the time‐dependent AUCs of the mTBS model were also larger than those of the CRLM number only and those of CRLM size only at a series of time points (supplemental online Fig. 2).
Identification of Risk Factors and Establishment of the CERR Score in Cohort 1
The results of univariate and multivariable analyses to reveal the relationship between variables and RFS are listed in Table 2. Because of collinearity, the number of CRLM, the size of CRLM, bilobar disease, single CEA level, and single CA19‐9 level were not included in the univariate and multivariable Cox regression models. Finally, five independent predictors of poor RFS were identified and were incorporated into the CERR score: node positive primary (1 point), preoperative CEA >200 ng/mL or CA19‐9 > 200 U/mL (1 point), presence of KRAS/NRAS/BRAF mutation (1 point), extrahepatic disease (1 point), and mTBS 5–12 (1 point) or at least 12 (2 points). The Kaplan‐Meier analysis of RFS for different values of the CERR score in cohort 1 is shown in Figure 2A. Then, the patients were stratified by their CERR score into risk groups: the high‐risk group (CERR score 4 or more) had a 3‐year RFS rate of 9.77%, with a median survival of 7.3 month; the medium‐risk group (CERR score 2–3) had a 3‐year RFS rate of 21.96%, with a median survival of 12.7 month; and the low‐risk group (CERR score 0–1) had a 3‐year RFS rate of 39.90%, with a median survival of 23.7 month (Fig. 2D).
Table 2.
Uni‐ and multivariable predictors of relapse‐free survival in cohort 1
| Univariable | Multivariable | |||
|---|---|---|---|---|
| Factors | HR (95% CI) | p value | HR (95% CI) | p value |
| Age ≥ 60 | 0.834 (0.701–0.994) | .043 | 0.842 (0.705–1.006) | .059 |
| Female sex | 1.148 (0.954–1.382) | .145 | ||
| Location | ||||
| Right‐sided colon | 1.234 (0.967–1.575) | .091 | 1.130 (0.879–1.452) | .342 |
| Left‐sided colon | 1.153 (0.948–1.402) | .154 | 1.155 (0.948–1.408) | .153 |
| Rectum | 1.000 (reference) | 1.000 (reference) | ||
| Primary T3 or T4 | 0.912 (0.675–1.23)1 | .548 | ||
| Node positive primary | 1.460 (1.192–1.787) | <.001 | 1.457 (1.185–1.790) | <.001 |
| Preoperative CEA >200 ng/mL or CA19‐9 > 200 U/mL | 1.509 (1.222–1.862) | <.001 | 1.328 (1.072–1.646) | .010 |
| KRAS/NRAS/BRAF mutated | 1.482 (1.244–1.766) | <.001 | 1.582 (1.318–1.898) | <.001 |
| Synchronous CRLM | 1.256 (1.007–1.568) | .044 | 1.076 (0.855–1.355) | .531 |
| mTBS | ||||
| 0–5 | 1.000 (reference) | 1.000 (reference) | ||
| 6–12 | 1.463 (1.201–1.781) | <.001 | 1.490 (1.215–1.827) | <.001 |
| >12 | 2.200 (1.715–2.821) | <.001 | 2.095 (1.600–2.744) | <.001 |
| Extrahepatic disease | 1.547 (1.188–2.015) | .001 | 1.518 (1.161–1.985) | .002 |
| Ablation | 1.373 (1.061–1.777) | .016 | 0.842 (0.705–1.006) | .421 |
Abbreviations: CEA, carcinoembryonic antigen; CRLM, colorectal liver metastasis; HR, hazard ratio.
Figure 2.
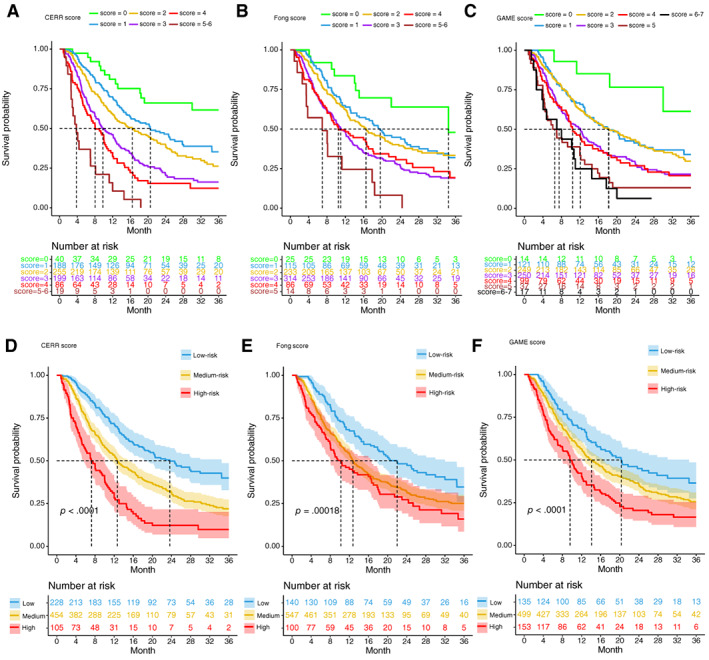
Kaplan‐Meier estimates of relapse‐free survival stratified by score values and risk groups of CERR, Fong, and GAME score in cohort 1. (A–C): Relapse‐free survival curves for different values of the CERR, GAME, and Fong score. (D–F): Kaplan‐Meier estimates of relapse‐free survival stratified by risk groups of CERR, Fong, and GAME score. The shaded part of survival curve represents 95% confidence interval.Abbreviations: CERR, Comprehensive Evaluation of Relapse Risk; GAME, Genetic and Morphological Evaluation.
Model Internal Validation and Comparison of the CERR Score with the GAME and Fong Scores in Cohort 1
The time‐dependent AUC of the CERR score model was 0.69 (95% CI, 0.65–0.73) at 24 months and 0.65 (95% CI, 0.59–0.72) at 33 months (Fig. 3A; supplemental online Table 4). The internal validation calibration curve (bootstrap for 1,000 repetitions) demonstrated that at a probability between 0 and 0.23, the CERR score model may slightly overestimate the risk for RFS; when the probability was higher than 0.23, the model may slightly underestimate the probability (Fig. 3B). Generally, the CERR score model showed good fit and calibration with the ideal curve (Fig. 3B). In the internal validation, the C‐index of the CERR score was 0.630 ± 0.025, which was also significantly larger than that of the Fong score (0.586 ± 0.026; p < .05) and the GAME score (0.602 ± 0.027; p < .05). The six survival curves for the different values of the CERR score did not intersect (Fig. 2A), whereas those of the Fong and GAME score models intersected (Fig. 2B, C). The shaded part of the survival curve in Figure 2D–F represents the 95% confidence interval. The 95% confidence intervals of three curves for the different risk groups did not overlap in CERR score model (Fig. 2D), whereas those of the Fong and GAME score models overlapped more or less (Fig. 2E, F). The time‐dependent AUCs of the CERR score model were significantly larger than those of the Fong and GAME score models at a series of time points (Fig. 3A; supplemental online Table 4). Therefore, the CERR score, with a better prognostic discriminatory ability, outperformed the Fong score and the GAME score.
Figure 3.

Comparison and validation of CERR score. (A): Time‐dependent AUCs of the CERR, GAME, and Fong score in cohort 1. (B): Internal validation of the CERR score using the bootstrap sampling method in cohort 1. (C): Time‐dependent AUCs of the CERR, GAME, and Fong score in cohort 2. (D): Further validation of the CERR score using the bootstrap sampling method in cohort 2.Abbreviations: AUC, area under curve; B, bootstrap; CERR, Comprehensive Evaluation of Relapse Risk; GAME, Genetic and Morphological Evaluation; RFS, relapse‐free survival.
Model Further Validation and Comparison of the CERR Score with the GAME and Fong Scores in Cohort 2
From January 2018 to September 2018, a total of 162 patients who underwent hepatic resection of CRLM were included in cohort 2. The variables related to the CERR score of the patients are summarized in Table 3. The Kaplan‐Meier analysis of RFS for different values of the CERR score in cohort 2 is shown in Figure 4A. Then, the patients were stratified by their CERR score into risk groups: the median survivals were 5.32 month in the high‐risk group (CERR score 4 or more), 12.5 month in the medium‐risk group (CERR score 2–3), and 22.5 month in the low‐risk group (CERR score 0–1; Fig. 4D).
Table 3.
Characteristics of patients and lesions in cohort 2
| Characteristics | Total (n = 162) |
|---|---|
| N stage: node positive, n (%) | 111 (68.5) |
| Preoperative factors, n (%) | |
| Preoperative CEA >200 ng/mL | 12 (7.4) |
| Preoperative CA19‐9 > 200 U/mL | 26 (16.0) |
| Preoperative CEA >200 ng/mL or CA19‐9 > 200 U/mL | 31 (19.1) |
| Preoperative CEA >200 ng/mL and CA19‐9 > 200 U/mL | 7 (4.3) |
| KRAS/NRAS/BRAF mutated, n (%) | 82 (50.6) |
| KRAS mutated | 71 (43.8.5) |
| NRAS mutated | 7 (4.3) |
| BRAF mutated | 4 (2.5) |
| CRLM characteristics, n (%) | |
| Synchronous CRLM | 134 (82.7) |
| Number of CRLM | |
| 1 | 48 (29.6) |
| 2‐3 | 38 (23.5) |
| 4‐5 | 24 (14.8) |
| >5 | 52 (32.1) |
| Size of largest CRLM ≥5 cm | 37 (22.8) |
| Bilobar disease | 95 (58.6) |
| TBS | |
| <3 | 32 (19.8) |
| 3–9 | 94 (58.0) |
| >9 | 36 (22.2) |
| mTBS | |
| <5 | 56 (34.6) |
| 5–12 | 58 (35.8) |
| >12 | 48 (29.6) |
| Extrahepatic disease, n (%) | 23 (14.2) |
| Fong score, n (%) | |
| 0–1 | 29 (17.9) |
| 2–3 | 110 (67.9) |
| 4–5 | 23 (14.2) |
| GAME score, n (%) | |
| 0–1 | 26 (16.0) |
| 2–3 | 93 (57.4) |
| 4–7 | 43 (26.5) |
| CERR score, n (%) | |
| 0–1 | 37 (22.8) |
| 2–3 | 94 (58.0) |
| 4–6 | 31 (19.1) |
Abbreviations: CEA, carcinoembryonic antigen; CRLM, colorectal liver metastasis; GAME, Genetic and Morphological Evaluation; mTBS, modified tumor burden score; TBS, tumor burden score.
Figure 4.
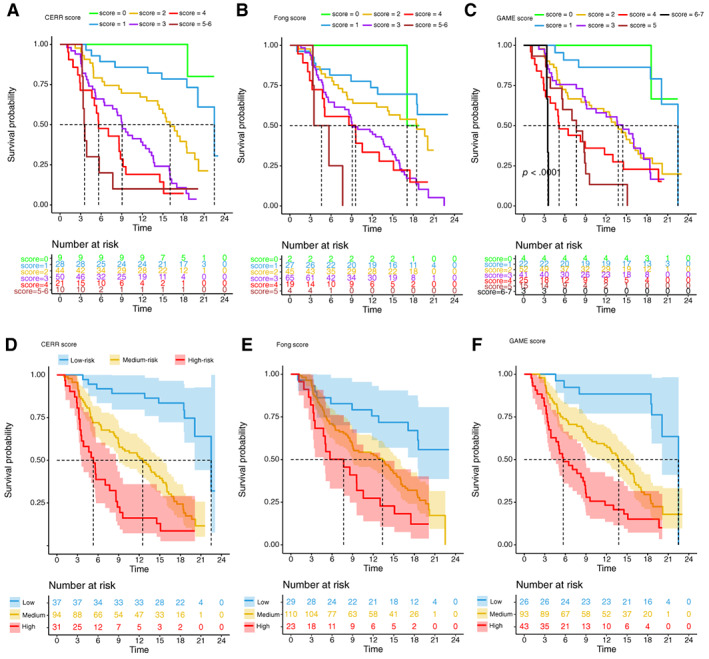
Kaplan‐Meier estimates of relapse‐free survival stratified by score values and risk groups of CERR, Fong, and GAME score in cohort 2. (A–C): Relapse‐free survival curves for different values of the CERR, GAME, and Fong score. (D–F): Kaplan‐Meier estimates of relapse‐free survival stratified by risk groups of CERR, Fong, and GAME score. The shaded part of survival curve represents 95% confidence interval.Abbreviations: CERR, Comprehensive Evaluation of Relapse Risk; GAME, Genetic and Morphological Evaluation.
The time‐dependent AUC of the CERR score model in cohort 2 was 0.81 (95% CI, 73.89‐ 87.38) at 15 months (Fig. 3C; supplemental online Table 5). The validation calibration curve (bootstrap for 1,000 repetitions) demonstrated that the CERR score model showed good fit and calibration with the ideal curve generally (Fig. 3D). In the further validation of Cohort 2, the C‐index of the CERR score was 0.736 ± 0.024, which was also significantly larger than that of the Fong score (0.644 ± 0.028, p < .05) and the GAME score (0.691 ± 0.026, p < .05). The six survival curves for the different values of the CERR score did not intersect (Fig. 4A), whereas those of the Fong and GAME score models intersected (Fig. 4B, C). The time‐dependent AUCs of the CERR score model were significantly larger than those of the Fong and GAME score models at a series of time points (Fig. 3C; supplemental online Table 5). Therefore, the further validation in cohort 2 demonstrated that the CERR score showed a better prognostic discriminatory ability.
Discussion
In our current study, the mTBS model was established by a mathematical equation with parameters including CRLM size, CRLM number, and unilobar and/or bilobar metastasis. The mTBS model, reflecting the integrative impact of macropathology on RFS, had better prognostic accuracy than the TBS model. Next, mTBS, KRAS/NRAS/BRAF‐mutated tumor, node‐positive primary, extrahepatic disease, and CEA and/or CA19‐9 level—the five preoperative predictors of worse RFS—were identified and incorporated into the CERR scoring system. The CERR score, with a better prognostic discriminatory ability, outperformed the Fong score and the GAME score. Perhaps more importantly, the CERR score is a powerful prognostic tool because it integrates the most consistently reported prognostic factors.
One innovative idea of our study may be that the mTBS model introduced unilobar and bilobar metastasis on the basis of the TBS model. The TBS model is a reference to the hepatocellular carcinoma (HCC) “Metroticket” prognostic tool 11. Compared with the “Milan criteria” 12 (single tumor with diameter ≤5 cm or up to three tumors each with diameter ≤3 cm, and no macrovascular invasion), the “Metroticket” system could better assess the suitability of patients with HCC for liver transplantation 11. The Metroticket Calculator (available online, www.hcc-olt-metroticket.org) integrated HCC number and HCC size and represented “a paradigm shift from a dichotomous to continuous prognostic stratification of patients with HCC” 7. Next, the result of the Metroticket Calculator should be refined online by choosing the presence or absence of microvascular invasion. Therefore, the Metroticket model included three parameters (tumor size, tumor number, and presence of vascular invasion), but the TBS model only considered two parameters (the size and the number of CRLMs). Unlike primary HCC, CRLM is a metastatic disease. The presence of liver vascular invasion was associated with the aggressive nature of HCC but was not a prognostic factor applicable for the CRLM scoring system. Actually, metastatic bilobar spread could intuitively embody the metastatic nature of CRLM. Metastatic bilobar spread should be a valuable prognostic factor for CRLM. A meta‐analysis of 34 studies comprising 3,039 patients showed that the presence of bilobar disease (HR, 1.62; 95% CI, 1.19–2.20) was significantly associated with poor survival 13. Two prognostic scoring studies of 1,477 and 305 patients both considered metastatic bilobar spread as a poor prognostic factor 14, 15, but the Fong score and GAME score did not 5, 6. We believe that single or multiple CRLMs and large CRLMs concealed the oncologic effect of bilobar metastasis in a multivariable analysis. Based on this, we performed propensity score matching (PSM) analysis to control differences in TBS between patients with bilobar metastasis and those with unilobar metastasis (supplemental online Table 6). As we expected, among patients who shared similar TBSs, those with bilobar metastasis had worse outcomes than those with unilobar metastasis (supplemental online Table 7; supplemental online Fig. 3). In the multivariable analysis of the after‐PSM cohort (supplemental online Table 7), compared with patients with unilobar metastasis, patients with bilobar metastasis had an HR of 1.63 (95% CI, 1.31–2.02) for disease relapse. The HR of 1.63 was close to the quadratic root value of the natural constant (√e = √2.7183 = 1.6487). Hence, we established a piecewise function to describe the characteristics of tumor burden for CRLM (Fig. 1C). In the piecewise function, TBS would be modified by multiplying “√e” when presence of bilobar disease was recognized. In the end, we showed that mTBS model had better prognostic accuracy to describe the characteristic of tumor burden than TBS model (Fig. 1D; supplemental online Fig. 1; supplemental online Table 3).
In clinical practice, serum CEA and CA19‐9 are frequently measured together in patients with CRC, but most prognostic scoring studies incorporated CEA into the survival analysis rather than CA19‐9. Unlike CEA, “CA19‐9 lacked sufficient data to be recommend for screening, diagnosis, staging, surveillance, or monitoring treatment of patients with colorectal cancer,” as mentioned in the ASCO 2006 Recommendations for use of CA19‐9 16. The European Group on Tumor Markers (EGTM) guidelines concluded that CA19‐9 cannot be recommended for the early diagnosis of CRC 17. However, “elevated preoperative levels of CA19‐9 have been found to correlate with adverse patient outcome,” the EGTM mentioned, “and may provide independent prognostic information.” 17 Interestingly, “CA19‐9 was even a stronger prognostic factor than CEA and predicted outcome in the Dukes’ B/C subgroup.” 17, 18 For CRLM, numerous studies have demonstrated that CA19‐9 was an important prognostic factor. In a Japanese study of 17,833 patients with pathological stage I–III CRC, patients with elevations in both CA19‐9 and CEA levels had worse outcomes after recurrence than those with an elevation in CEA alone; patients with elevations in CA19‐9 had worse outcomes after recurrence than those without elevations in either CA19‐9 or CEA 19. Furthermore, approximately 10 studies, by performing multivariate analysis, found that patients with CRLM with an elevation in prehepatectomy CA19‐9 were associated with poor oncological outcomes 20, 21, 22, 23, 24, 25, 26, 27, 28, 29. In our study, an elevation in CA19‐9 had statistical significance in the multivariate analysis (supplemental online Table 8). Therefore, an elevation in CA19‐9 should be incorporated into the prognostic prediction of patients. However, an elevation in CEA had no statistical significance in the Cox multivariate analysis (supplemental online Table 8). Here, we are not confined to “statistical significance” but should consider “clinical significance.” Several studies based on large cohorts of patients 4, 5, 6, 14, 30, 31, such as the Fong score and GAME score, pointed to the preoperative elevation in CEA as a negative prognostic factor. Furthermore, the preoperative routine CEA testing in CRC patient care is recommended globally, but the CA19‐9 testing is not used in some regions. To make the CERR score generalizable to a global population, we tried to eliminate the CA19‐9 variable, only include CEA, and reanalyze the CERR score. We found that the prognostic accuracy of the CERR score persisted when CA19‐9 was eliminated (supplemental online Fig. 4; supplemental online Tables 9–10). In view of this result, we combined these two serum indicators—an elevation of CEA or CA19‐9 should have more clinical practicality compared with an elevation of a single serum indicator.
KRAS, NRAS, and BRAF, kinases in the RAS‐RAF‐MAPK signaling pathway, are considered important biomarkers that determine tumor biology. KRAS/NRAS/BRAF mutation status is used to predict long‐term outcomes after CRLM resection 8. Although only 2.2% of patients in our study harbored BRAF mutations and 3.4% harbored NRAS mutations, the KRAS/NRAS/BRAF mutation status noticeably had better prognostic accuracy than the KRAS mutation status alone (supplemental online Fig. 5). This finding may be another reason why the CERR score is better than the GAME score, which only includes the KRAS mutational status.
EHD and node‐positive primary tumors, reflecting the metastatic nature of tumors, were also poor prognostic factors. In the majority of prognostic scoring studies, patients with EHD were excluded from the analysis, as many researchers considered EHD as a contraindication for hepatic resection. Recently, the “modern aggressive approach” to CRLM proposed that pulmonary metastases when surgically resectable were no longer an absolute contraindication for surgery, and long‐term survival could be achieved with complete resection 32. As hepatic resection for CRLM in the presence of concurrent EHD is gradually being accepted, the CERR score should be promoted as the scoring system because it takes patients with EHD into account. In addition, all analyses were performed repeatedly in patients with and without EHD, and the essentially unchanged results demonstrate the applicability of the CERR score (results not shown).
The CERR is a promising scoring system, not only because it has a better prognostic discriminatory ability but also because it has characteristics such as comprehensiveness and practicality. Matias and colleagues compared 19 prognostic scoring studies in a review 33. All previous prognostic scoring studies used the Cox proportional hazards model for multivariable analysis to identify statistically significant variables as scoring points. Some variables (such as the number of CRLM, the size of CRLM, bilobar spread, and preoperative elevation in CEA) were identified as negative factors in some studies but not in other studies 33. For example, the number of CRLM was the most cited factor 33, but four prognostic scoring studies did not consider it as a negative prognostic factor 34, 35, 36, 37. Therefore, the identification of the ideal scoring system remains controversial. Remarkably, we successfully consolidated the most consistently reported prognostic factors into the CERR scoring system. Furthermore, all variables in the CERR score are preoperatively available. Therefore, the CERR score can assist doctors in determining optimal clinical management strategies.
Of course, there are certain limitations to this study. First, this is a retrospective study and selection bias may exist. Second, The CERR score may still require external validations from cohorts from other medical centers or from a prospective study, although it has been validated in cohort 2. Third, the follow‐up time might be relatively short, but we considered it acceptable for a recurrence rate of more than 50% within 2 years. Despite these limitations, the CERR score is a powerful prognostic tool because it predicts the survival differences extremely well.
Conclusion
mTBS should be promoted. The CERR score is a powerful prognostic tool that can help determine optimal clinical management strategies.
Author Contributions
Conception/design: Yijiao Chen, Wenju Chang, Li Ren, Ye Wei, Jianmin Xu
Provision of study material or patients: Yijiao Chen, Wenju Chang, Li Ren, Ye Wei, Jianmin Xu
Collection and/or assembly of data: Yijiao Chen, Wenju Chang, Li Ren, Jingwen Chen, Wentao Tang
Data analysis and interpretation: Yijiao Chen, Jingwen Chen, Wentao Tang, Tianyu Liu, Mi Jian, Yu Liu
Manuscript writing: Yijiao Chen, Wenju Chang, Li Ren
Final approval of manuscript: Yijiao Chen, Wenju Chang, Li Ren, Jingwen Chen, Wentao Tang, Tianyu Liu, Mi Jian, Yu Liu, Ye Wei, Jianmin Xu
Disclosures
The authors indicated no financial relationships.
Supporting information
See http://www.TheOncologist.com for supplemental material available online.
Supplemental Figures
Supplemental Tables
Acknowledgments
Yijiao Chen would like to show deepest gratitude to his teachers, Dr. Xu, Dr. Wei, and Dr. Ren, three respectable and responsible scholars, who have provided him with valuable guidance in this thesis. Dr. Chen also extends his thanks to Dr. Chang for all his kindness and help.
This study was Supported by The National Key R&D Program of China (2017YFC0908200); The National Natural Science Foundation of China (81602035, 81472228); The Shanghai Municipal Health Commission: (Q2017‐059); Clinical Science and Technology Innovation Project of Shanghai (SHDC12016104). Shanghai Engineering Research Center of Colorectal Cancer Minimally Invasive (17DZ2252600).
Disclosures of potential conflicts of interest may be found at the end of this article.
No part of this article may be reproduced, stored, or transmitted in any form or for any means without the prior permission in writing from the copyright holder. For information on purchasing reprints contact Commercialreprints@wiley.com. For permission information contact permissions@wiley.com.
Contributor Information
Ye Wei, Email: wei.ye@zs-hospital.sh.cn.
Jianmin Xu, Email: xujmin@aliyun.com.
References
- 1. Bray F, Ferlay J, Soerjomataram I et al. Global cancer statistics 2018: GLOBOCAN estimates of incidence and mortality worldwide for 36 cancers in 185 countries. CA Cancer J Clin 2018;68:394–424. [DOI] [PubMed] [Google Scholar]
- 2. Van Cutsem E, Nordlinger B, Cervantes A; ESMO Guidelines Working Group. Advanced colorectal cancer: ESMO Clinical Practice Guidelines for treatment. Ann Oncol 2010;(Suppl 5):v93–v97. [DOI] [PubMed] [Google Scholar]
- 3. de Jong MC, Pulitano C, Ribero D et al. Rates and patterns of recurrence following curative intent surgery for colorectal liver metastasis: An international multi‐institutional analysis of 1669 patients. Ann Surg 2009;250:440–448. [DOI] [PubMed] [Google Scholar]
- 4. Nordlinger B, Guiguet M, Vaillant JC et al. Surgical resection of colorectal carcinoma metastases to the liver. A prognostic scoring system to improve case selection, based on 1568 patients. Association Francaise de Chirurgie. Cancer 1996;77:1254–1262. [PubMed] [Google Scholar]
- 5. Fong Y, Fortner J, Sun RL et al. Clinical score for predicting recurrence after hepatic resection for metastatic colorectal cancer: Analysis of 1001 consecutive cases. Ann Surg 1999;230:309–318; discussion 18–21. [DOI] [PMC free article] [PubMed] [Google Scholar]
- 6. Margonis GA, Sasaki K, Gholami S et al. Genetic And Morphological Evaluation (GAME) score for patients with colorectal liver metastases. Br J Surg 2018;105:1210–1220. [DOI] [PMC free article] [PubMed] [Google Scholar]
- 7. Sasaki K, Morioka D, Conci S et al. The Tumor Burden Score: A new “metro‐ticket” prognostic tool for colorectal liver metastases based on tumor size and number of tumors. Ann Surg 2018;267:132–141. [DOI] [PubMed] [Google Scholar]
- 8. Yamashita S, Chun YS, Kopetz SE et al. Biomarkers in colorectal liver metastases. Br J Surg 2018;105:618–627. [DOI] [PubMed] [Google Scholar]
- 9. Camp RL, Dolled‐Filhart M, Rimm DL. X‐tile: A new bio‐informatics tool for biomarker assessment and outcome‐based cut‐point optimization. Clin Cancer Res 2004;10:7252–7259. [DOI] [PubMed] [Google Scholar]
- 10. Zheng P, Ren L, Feng Q et al. Patients with RAS wild‐type right‐sided unresectable liver‐confined mCRC also benefit from cetuximab plus chemotherapy in first‐line treatment. Am J Cancer Res 2018;8:2337–2345. [PMC free article] [PubMed] [Google Scholar]
- 11. Mazzaferro V, Llovet JM, Miceli R et al; Metroticket Investigator Study Group . Predicting survival after liver transplantation in patients with hepatocellular carcinoma beyond the Milan criteria: A retrospective, exploratory analysis. Lancet Oncol 2009;10:35–43. [DOI] [PubMed] [Google Scholar]
- 12. Mazzaferro V, Regalia E, Doci R et al. Liver transplantation for the treatment of small hepatocellular carcinomas in patients with cirrhosis. N Engl J Med 1996;334:693–699. [DOI] [PubMed] [Google Scholar]
- 13. Wang SJ, Si XY, Cai ZB et al. Survival after repeat hepatectomy for recurrent colorectal liver metastasis: A review and meta‐analysis of prognostic factors. Hepatobiliary Pancreat Dis Int 2019;18:313–320. [DOI] [PubMed] [Google Scholar]
- 14. Kattan MW, Gönen M, Jarnagin WR et al. A nomogram for predicting disease‐specific survival after hepatic resection for metastatic colorectal cancer. Ann Surg 2008;247:282–287. [DOI] [PubMed] [Google Scholar]
- 15. Iwatsuki S, Dvorchik I, Madariaga JR et al. Hepatic resection for metastatic colorectal adenocarcinoma: A proposal of a prognostic scoring system. J Am Coll Surg 1999;189:291–299. [DOI] [PMC free article] [PubMed] [Google Scholar]
- 16. Locker GY, Hamilton S, Harris J et al. ASCO 2006 update of recommendations for the use of tumor markers in gastrointestinal cancer. J Clin Oncol 2006;24:5313–5327. [DOI] [PubMed] [Google Scholar]
- 17. Duffy MJ, van Dalen A, Haglund C et al. Clinical utility of biochemical markers in colorectal cancer: European Group on Tumour Markers (EGTM) guidelines. Eur J Cancer 2003;39:718–727. [DOI] [PubMed] [Google Scholar]
- 18. Reiter W, Stieber P, Reuter C et al. Preoperative serum levels of CEA and CA19‐9 and their prognostic significance in colorectal carcinoma. Anticancer Res 1997;17:2935–2938. [PubMed] [Google Scholar]
- 19. Okamura R, Hasegawa S, Hida K et al. The role of periodic serum CA19‐9 test in surveillance after colorectal cancer surgery. Int J Clin Oncol 2017;22:96–101. [DOI] [PubMed] [Google Scholar]
- 20. Lu Z, Peng J, Wang Z et al. High preoperative serum CA19‐9 level is predictive of poor prognosis for patients with colorectal liver oligometastases undergoing hepatic resection. Med Oncol 2016;33:121. [DOI] [PubMed] [Google Scholar]
- 21. Dexiang Z, Li R, Ye W et al. Outcome of patients with colorectal liver metastasis: Analysis of 1,613 consecutive cases. Ann Surg Oncol 2012;19:2860–2868. [DOI] [PubMed] [Google Scholar]
- 22. Sakamoto Y, Miyamoto Y, Beppu T et al. Post‐chemotherapeutic CEA and CA19‐9 are prognostic factors in patients with colorectal liver metastases treated with hepatic resection after oxaliplatin‐based chemotherapy. Anticancer Res 2015;35:2359–2368. [PubMed] [Google Scholar]
- 23. Imai K, Castro Benitez C, Allard MA et al. Potential of a cure in patients with colorectal liver metastases and concomitant extrahepatic disease. J Surg Oncol 2017;115:488–496. [DOI] [PubMed] [Google Scholar]
- 24. Ito T, Sugiura T, Okamura Y et al. The impact of posthepatectomy liver failure on long‐term survival after hepatectomy for colorectal liver metastasis. HPB (Oxford) 2019;21:1185–1193. [DOI] [PubMed] [Google Scholar]
- 25. Inoue Y, Hayashi M, Komeda K et al. Resection margin with anatomic or nonanatomic hepatectomy for liver metastasis from colorectal cancer. J Gastrointest Surg. 2012;16:1171–1180. [DOI] [PubMed] [Google Scholar]
- 26. Sasaki A, Kawano K, Inomata M et al. Value of serum carbohydrate antigen 19‐9 for predicting extrahepatic metastasis in patients with liver metastasis from colorectal carcinoma. Hepatogastroenterology. 2005;52:1814–1819. [PubMed] [Google Scholar]
- 27. Adam R, Pascal G, Castaing D et al. Tumor progression while on chemotherapy: A contraindication to liver resection for multiple colorectal metastases? Ann Surg 2004;240:1052–1061; discussion 61–64. [DOI] [PMC free article] [PubMed] [Google Scholar]
- 28. Ahn SW, Na AS, Yang JD et al. Scoring of prognostic factors that influence long‐term survival in patients with hepatic metastasis of colorectal cancer. Korean J Hepatobiliary Pancreat Surg 2011;15:146–151. [DOI] [PMC free article] [PubMed] [Google Scholar]
- 29. Ishizuka D, Shirai Y, Sakai Y, Hatakeyama K. Colorectal carcinoma liver metastases: Clinical significance of preoperative measurement of serum carcinoembryonic antigen and carbohydrate antigen 19‐9 levels. Int J Colorectal Dis 2001;16:32–37. [DOI] [PubMed] [Google Scholar]
- 30. Adam R, de Haas RJ, Wicherts DA et al. Concomitant extrahepatic disease in patients with colorectal liver metastases: When is there a place for surgery? Ann Surg 2011;253:349–359. [DOI] [PubMed] [Google Scholar]
- 31. Rees M, Tekkis PP, Welsh FK et al. Evaluation of long‐term survival after hepatic resection for metastatic colorectal cancer: A multifactorial model of 929 patients. Ann Surg 2008;247:125–135. [DOI] [PubMed] [Google Scholar]
- 32. Khatri VP, Petrelli NJ, Belghiti J. Extending the frontiers of surgical therapy for hepatic colorectal metastases: Is there a limit? J Clin Oncol 2005;23:8490–8499. [DOI] [PubMed] [Google Scholar]
- 33. Matias M, Casa‐Nova M, Faria M et al. Prognostic factors after liver resection for colorectal liver metastasis. Acta Med Port 2015;28:357–369. [DOI] [PubMed] [Google Scholar]
- 34. Tan MC, Castaldo ET, Gao F et al. A prognostic system applicable to patients with resectable liver metastasis from colorectal carcinoma staged by positron emission tomography with [18F]fluoro‐2‐deoxy‐D‐glucose: Role of primary tumor variables. J Am Coll Surg 2008;206:857‐868; discussion 68‐9. [DOI] [PubMed] [Google Scholar]
- 35. Hill CR, Chagpar RB, Callender GG et al. Recurrence following hepatectomy for metastatic colorectal cancer: Development of a model that predicts patterns of recurrence and survival. Ann Surg Oncol 2012;19:139–144. [DOI] [PubMed] [Google Scholar]
- 36. Zakaria S, Donohue JH, Que FG et al. Hepatic resection for colorectal metastases: Value for risk scoring systems? Ann Surg 2007;246:183–191. [DOI] [PMC free article] [PubMed] [Google Scholar]
- 37. Tanaka K, Shimada H, Fujii Y et al. Pre‐hepatectomy prognostic staging to determine treatment strategy for colorectal cancer metastases to the liver. Langenbecks Arch Surg 2004;389:371–379. [DOI] [PubMed] [Google Scholar]
Associated Data
This section collects any data citations, data availability statements, or supplementary materials included in this article.
Supplementary Materials
See http://www.TheOncologist.com for supplemental material available online.
Supplemental Figures
Supplemental Tables