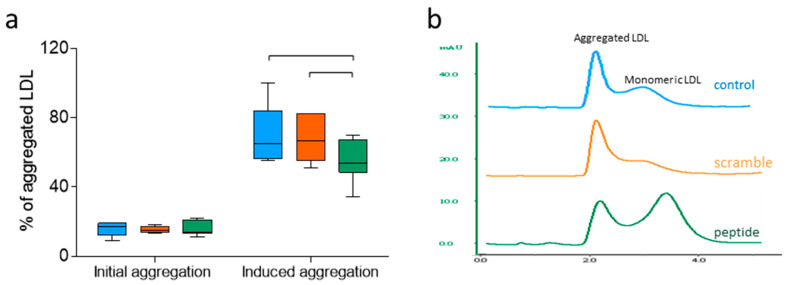
Figure 5.
LDL susceptibility to aggregation. Susceptibility to aggregation experiments were conducted as indicated in the Methods. The degree of aggregation was estimated by size exclusion chromatography in a Superose 6 column, and the percentage of aggregated LDL particles was determined by quantifying the area of the eluted peaks corresponding to aggregated and non-aggregated LDL subfractions. (a) Percentage of aggregated LDL. Data are shown as box-plot graphs, n = 7 in control and scramble groups, n = 10 in the peptide group. Bars indicate p < 0.05 vs. other groups. (b) Representative chromatograms of LDLs from each group after aggregation.

