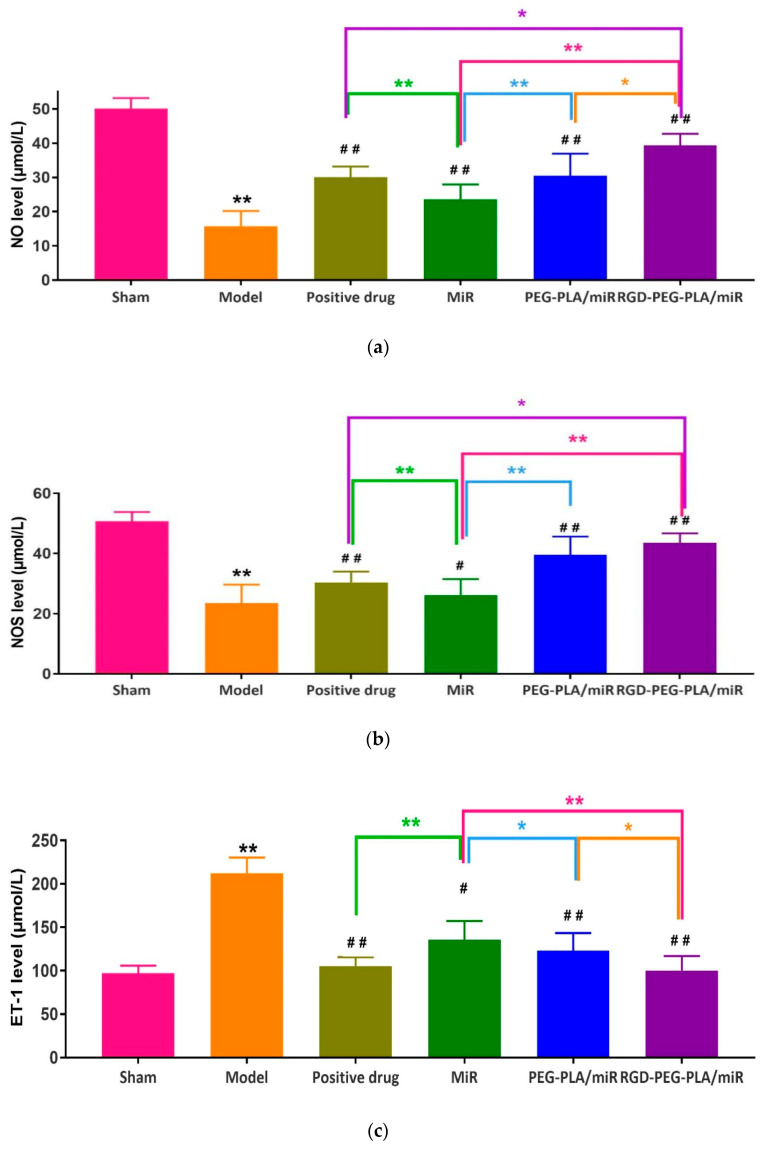
Figure 10.
The levels of (a) nitric oxide (NO), (b) nitric oxide synthase (NOS), and (c) endothelin-1 (ET-1) in six groups of rats (mean ± SD, n = 6). Compared with the sham group, the difference was statistically significant (** p < 0.01). Compared with the model group, the difference was statistically significant (# p < 0.05, ## p < 0.01). The color asterisks indicate significant differences between the two groups, * p < 0.05 and ** p < 0.01.

