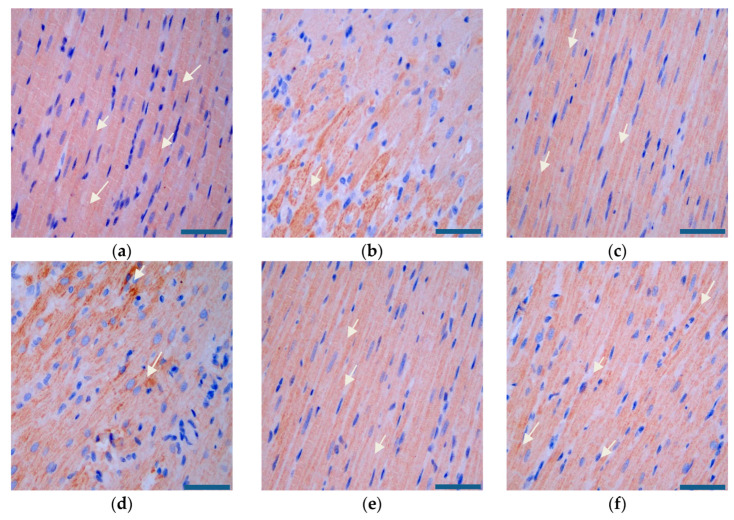
Figure 15.
SIRT3 expression in the rat heart tissues (×400, scale bar = 200 µm) of (a) the sham group, (b) the model group, (c) the positive drug group, (d) the miR-133 group, (e) the PEG-PLA/miR-133 group, and (f) the RGD-PEG-PLA/miR-133 group. Blue: nucleus, brown: SIRT3-positive stain. White arrows indicate the regions of strongly positive SIRT3 expression.

