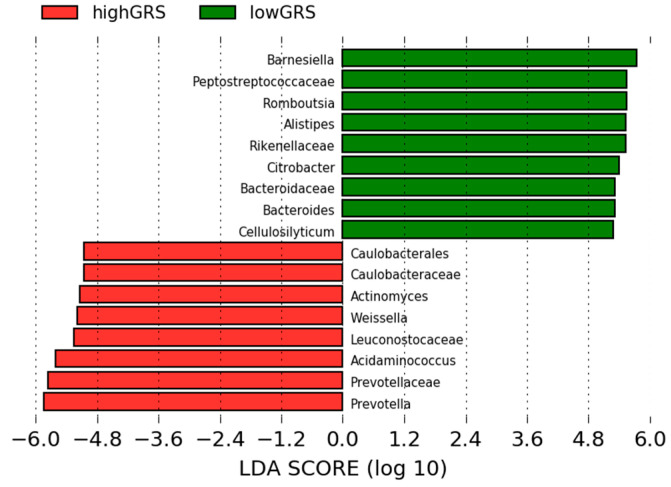
Figure 2.
Linear discriminant analysis effect size between subjects with high Genetic Risk Score and subjects with low Genetic Risk Score Red, bacterial taxa statistically overrepresented in high Genetic Risk Score participants; green, bacterial taxa overrepresented in low Genetic Risk Score participants.

