

Abstract
The aryl hydrocarbon receptor (AHR) mediates developmental toxicity of several xenobiotic classes including polycyclic aromatic hydrocarbons. Using embryonic zebrafish, we previously identified 4 polycyclic aromatic hydrocarbons that caused a novel phenotype among AHR ligands—growth of a lateral, duplicate caudal fin fold. The window of sensitivity to the most potent inducer of this phenotype, benzo[k]fluoranthene (BkF), was prior to 36 h postfertilization (hpf), although the phenotype was not manifest until 60 hpf. AHR dependency via Ahr2 was demonstrated using morpholino knockdown. Hepatocyte ablation demonstrated that hepatic metabolism of BkF was not required for the phenotype, nor was it responsible for the window of sensitivity. RNA sequencing performed on caudal trunk tissue from BkF-exposed animals collected at 48, 60, 72, and 96 hpf showed upregulation of genes associated with AHR activation, appendage development, and tissue patterning. Genes encoding fibroblast growth factor and bone morphogenic protein ligands, along with retinaldehyde dehydrogenase, were prominently upregulated. Gene Ontology term analysis revealed that upregulated genes were enriched for mesoderm development and fin regeneration, whereas downregulated genes were enriched for Wnt signaling and neuronal development. MetaCore (Clarivate Analytics) systems analysis of orthologous human genes predicted that R-SMADs, AP-1, and LEF1 regulated the expression of an enriched number of gene targets across all time points. Our results demonstrate a novel aspect of AHR activity with implications for developmental processes conserved across vertebrate species.
Keywords: benzo[k]fluoranthene, appendage, RNA sequencing
The aryl hydrocarbon receptor (AHR) is a ligand-activated basic helix-loop-helix transcription factor (TF) that is highly conserved among vertebrates. Many xenobiotics derived from both natural and anthropogenic sources activate AHR (Nebert, 2017). A wide range of environmental chemicals interact with the AHR including dioxins, furans, dioxin-like polychlorinated biphenyls, polycyclic aromatic hydrocarbons (PAHs), flavonoids, and organochlorines (Giesy and Kannan, 1998; Ng et al., 2010; Wahl et al., 2008). Once a ligand has bound to the AHR, its respective chaperone proteins dissociate and the AHR translocates to the nucleus where it dimerizes with the AHR nuclear translocator (ARNT). Here, the ligand-AHR-ARNT complex binds to xenobiotic response elements leading to the up- or downregulation of numerous target genes (eg, cyp1a). These target genes can facilitate the modulation of downstream signaling pathways (Schmidt and Bradfield, 1996) that affect cardiovascular systems, reproduction, immune regulation, oxidative stress responses, and development (Carney et al., 2006; Kerkvliet, 2009; Mulero-Navarro and Fernandez-Salguero, 2016; Puga et al., 2009; Sauzeau et al., 2011). The repertoire of known biological effects downstream of AHR activation is diverse. How diverse xenobiotic ligands similarly activate the same AHR with diverse outcomes is not well understood.
AHR-mediated developmental toxicity has largely been characterized for the prototypical ligand 2,3,7,8-tetrachlorodibenzo-p-dioxin (TCDD) and includes phenotypic craniofacial malformations and cardiovascular dysfunction (Andreasen et al., 2002; Olson and Mcgarrigle, 1992). Many effects and resulting phenotypes are often similar for other AHR ligands, including PAHs, which elicit developmental toxicity (Barron et al., 2004; Billiard et al., 2006; Goodale et al., 2013; Incardona et al., 2005; Jayasundara et al., 2015; Scott et al., 2011). PAHs are common environmental pollutants comprised of 2 or more fused aromatic rings, and they can be petrogenic (formed in petroleum) and/or pyrogenic (formed through incomplete combustion of organic material). Exposure to PAHs during development has been correlated with an increase in neurobehavioral disorders (Genkinger et al., 2015; Jedrychowski et al., 2015; Perera et al., 2014), obesity (Jung et al., 2014; Rundle et al., 2012), decreased intelligence (Jedrychowski et al., 2015; Perera et al., 2009), reproductive effects (Coutts et al., 2007), and decreased birth weight and size (Perera et al., 1998, 2005; Suzuki et al., 2010). Similar to other AHR ligands, developmental PAH exposure can result in a multitude of effects, though toxicity is similar to the developmental effects of TCDD, including cardiovascular toxicity and oxidative stress (Chlebowski et al., 2017a; Incardona et al., 2011; Knecht et al., 2013; Scott et al., 2011). Thus, PAHs provide an environmentally salient opportunity to explore a large range of ligand-AHR bioactivities and to identify the transcriptional and translational patterns that underlie them.
The zebrafish is an ideal model for rapidly evaluating developmental toxicity of environmental toxicants. A strength of the model is the ability to link adverse outcomes and unique phenotypes with initiating molecular events to define chemical bioactivity and mechanisms of effect (Bugel et al., 2014). Zebrafish have been used extensively to study AHR-related mechanisms for developmental effects of TCDD (Olson and Mcgarrigle, 1992; Prasch et al., 2003), and the ability of adult and larval zebrafish to regenerate removed caudal fin tissue has been useful for interrogating downstream pathways mediated by the AHR (Andreasen et al., 2006; Mathew et al., 2006). Higher vertebrates have a single AHR gene, whereas a genome-wide duplication event in zebrafish resulted in 3 co-orthologs: Ahr1a, Ahr1b, and Ahr2. The latter is primarily associated with TCDD-induced developmental toxicity and mediates toxicity of several PAHs similar to the mammalian AHR (Billiard et al., 2006; Hahn, 2002; Jayasundara et al., 2015). The function of Ahr1b is unknown, though its binding affinities are similar to Ahr2 (Karchner et al., 2005). AHR-dependent developmental toxicity in zebrafish is canonically characterized by pericardial and yolk sac edemas and craniofacial malformations.
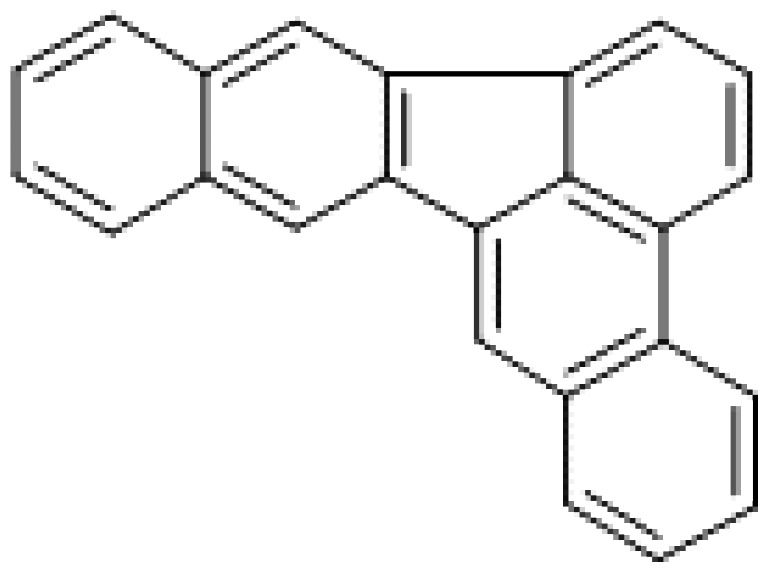
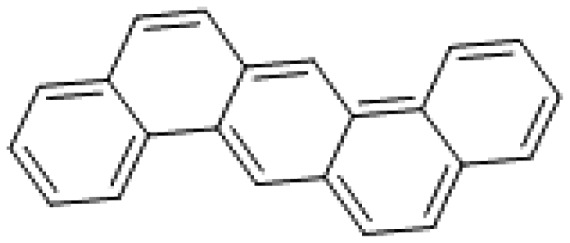
Previously, we performed a large comparative study of developmental toxicity associated with 123 PAHs and derivatives (Geier et al., 2018). Unexpectedly, exposure to 4 PAHs resulted in development of an ectopic caudal fin fold perpendicular to the normal caudal fin fold, a phenotype which we nicknamed “X-fin.” These 4 PAHs were (in order of most to least potent nominal EC20 values): benzo[k]fluoranthene (BkF), dibenzo[b, k]fluoranthene, dibenzo[a,h]anthracene, and benzo[j]fluoranthene (Table 1) (Yano and Tamura, 2013). Fins share a conserved developmental signaling program with tetrapod limbs. Caudal fin duplication has been previously reported in zebrafish mutants with dysfunctional protein antagonists of Wnt and bone morphogenic protein (BMP) signaling (Hammerschmidt et al., 1996), whereas exogenous addition of retinoic acid (RA) is sufficient to induce ectopic limb formation in other vertebrates (Niederreither et al., 1996).
Table 1.
Structures and EC20 Values of 4 PAHs Identified With X-fin Phenotype
| PAH | Structure | EC20 (µM) |
|---|---|---|
| Dibenzo[b,k]fluoranthene |
|
3.5 |
| Dibenzo[a,h]anthracene |
|
3.6 |
| Benzo[j]fluoranthene |
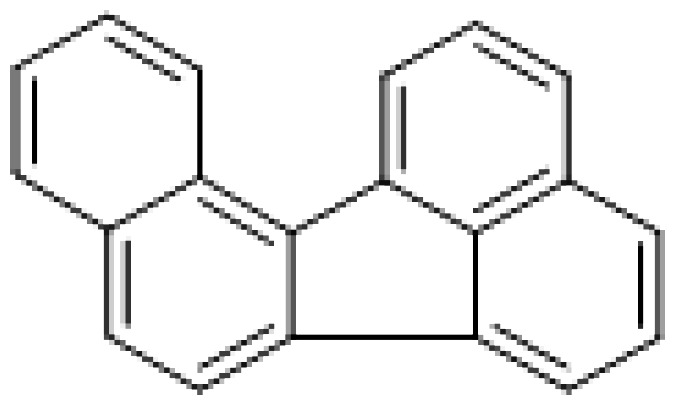
|
7.3 |
| Benzo[k]fluoranthene |
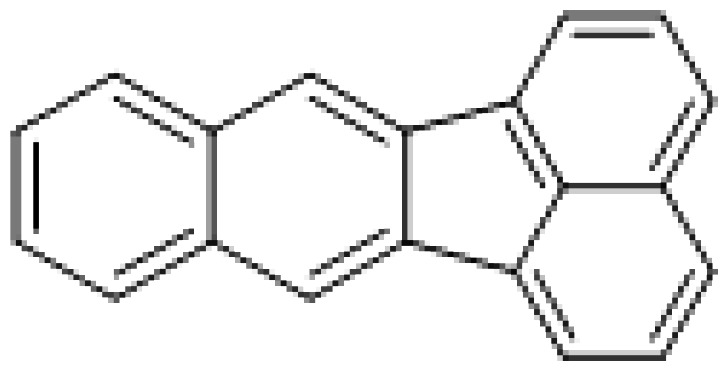
|
0.5 |
Abbreviation: PAH, polycyclic aromatic hydrocarbon.
We focused our investigation on BkF, the most potent inducer of X-fin. We addressed 2 hypotheses: (1) the X-fin phenotype is AHR-dependent; and (2) exposure to BkF misregulates 1 or more developmental pathways involved in limb induction. We demonstrated that: (1) BkF exposure prior to 36 h postfertilization (hpf) is required for the X-fin phenotype; (2) BkF-induced X-fin is Ahr2-dependent; and (3) BkF alters the expression of several genes involved in limb (fin) bud formation.
MATERIALS AND METHODS
Chemicals
PAH chemical structures are shown in Table 1. Analytical grade standards of benzo[j]fluoranthene (98.1%, CAS No. 205-82-3), BkF (100%, CAS No. 207-08-9), and dibenzo[a, h]anthracene (99%, CAS No. 53-70-3) were obtained from AccuStandard (New Haven, Connecticut). Dibenzo[b,k]fluoranthene (99.6%, CAS No. 205-97-0) was obtained from Chiron AS (Trondheim, Norway). Stock solutions of benzo[j]fluoranthene and BkF were prepared in 100% dimethyl sulfoxide (DMSO) at 10 mM, whereas solubility limits required dibenzo[b,k]fluoranthene and dibenzo[a,h]anthracene to be prepared at 1 mM. Tricaine mesylate (MS-222, 95%, CAS No. 886-86-2) was obtained from Tocris Biosciences (Minneapolis, Minnesota). DMSO (99.9%, CAS No. 67-68-5) was obtained from Avantor Performance Materials (Center Valley, Pennsylvania). Metronidazole (analytical grade, CAS No. 443-48-1) was obtained from Sigma-Aldrich (St. Louis, Missouri).
Zebrafish husbandry and developmental exposures
Tropical 5D zebrafish were maintained at the Sinnhuber Aquatic Research Laboratory (SARL) at Oregon State University (Corvallis, Oregon) according to Institutional Animal Care and Use Committee (IACUC) protocols. Adult zebrafish were raised in densities of approximately 500 animals/50-gallon tank at 28 ± 1°C under a 14:10-h light/dark cycle in recirculating filtered water supplemented with Instant Ocean salts. Spawning funnels were placed in tanks the night prior, and the following morning, embryos were collected, staged, and maintained in an incubator at 28 ± 1°C (Kimmel et al., 1995). Embryonic and larval zebrafish to be euthanized were overdosed with tricaine at concentrations exceeding 300–400 mg/l.
Chorions were enzymatically removed with pronase at 4 hpf using a custom automated dechorionator as previously described, and at 6 hpf, embryos were placed 1 per well in round bottom 96-well plates prefilled with 100 µl embryo medium using an automated embryo placement system (Mandrell et al., 2012). A Hewlett Packard D300e chemical dispenser was used to dispense 100% DMSO-dissolved stocks into 2 replicate exposure plates. Final DMSO concentrations were normalized to 1% (vol/vol), and gently shaken by the chemical dispenser running a custom soft shake script during dispensing. Plates were sealed with Parafilm to minimize evaporation, wrapped in foil to minimize light exposure, and shaken overnight at 235 rpm on an orbital shaker at 28 ± 1°C to enhance solution uniformity (Truong et al., 2016). Embryos were kept in a 28 ± 1°C incubator for the duration of the 5-day study.
Aqueous exposures were either static throughout development or staggered to determine the developmental window of susceptibility (Figure 1A). For static exposures, embryos were exposed from 6 hpf until 120 hpf. For window of sensitivity and morpholino studies, a single concentration of 3 µM BkF was used. The window of sensitivity study utilized 3 separate egg clutches for the following exposure windows: (1) 6–120, 24–120, and 48–120 hpf; (2) 6–24, 24–36, and 36–48 hpf; and (3) 6–36 and 12–36 hpf. Clutches were derived from multiple parents in separate spawning tanks. For the RNA-seq studies, the exposure concentration was 12 µM, which ensured robust induction of the phenotype in 100% of the animals.
Figure 1.

Exposure study paradigm and representative images of X-fin caudal fin phenotype. A, Study paradigm. B, Examples of the X-fin phenotype. The red dashed lines indicate the boundary of ectopic fin growth. In the first 2 panels, the X-fin starts to emerge at 96 hpf (i) with visible lateral outgrowth in animals exposed to 12 μM benzo[k]fluoranthene (BkF). Outgrowth is also visible from a ventral angle (ii). The last 2 panels represent 120 hpf animals that were treated with either 1% dimethyl sulfoxide (DMSO) (iii) or 12 μM BkF (iv). C, Artist’s rendering of dorsal and posterior views of X-fin phenotype. Abbreviations: hpf, hours postfertilization; IHC, immunohistochemistry.
Morpholino microinjections
Embryos were injected at the single cell stage with a fluorescein-tagged translation-blocking morpholino targeting Ahr2, splice-blocking morpholinos targeting Ahr1a or Ahr1b, or a standard nonsense control purchased from Gene Tools (Philomath, Oregon; Table 2). Injection volume was approximately 2 nl. Fertilized, normally developing embryos were screened for morpholino incorporation at 4 hpf by fluorescence microscopy and dechorionated by hand. Embryos with evenly incorporated morpholino were exposed to BkF as described above.
Table 2.
Morpholino Sequences and Injection Concentrations
| Morpholino | Sequence | Concentration (mM) |
|---|---|---|
| Control | 5′-CCTCTTACCTCAGTTACAATTTATA-3′ | 1 |
| ahr2 | 5′-TGTACCGATACCCGCCGACATGGTT-3′ | 1 |
| ahr1a | 5′-CTTTTGAAGTGACTTTTGGCCCGCA-3′ | 1.5 |
| ahr1b | 5′-ACACAGTCGTCCATGATTACTTTGC-3′ | 0.75 |
Immunohistochemistry
Immunohistochemistry (IHC) of cytochrome P450, family 1, subfamily A (Cyp1A) protein localization was performed as previously described (Mathew et al., 2006). Two replicates of 8 larvae at 120 hpf each were euthanized with tricaine and fixed overnight in 4% paraformaldehyde at 4°C. Fixed embryos were permeabilized 10 min on ice in 0.005% trypsin, rinsed with phosphate buffered saline (PBS)+Tween 20 (PBST) and postfixed in 4% paraformaldehyde for 10 min. Larvae were blocked with 10% normal goat serum (NGS) in PBS + 0.5% Triton X-100 (PBSTx) for 1 h at room temperature and incubated overnight in the mouse anti-fish Cyp1A monoclonal primary antibody (1:500; Biosense Laboratories, Bergen, Norway) in 1% NGS. Larvae were washed in PBST and incubated for 2 h in secondary antibody (Fluor 594 goat anti-mouse, IgG). Eight embryos per treatment group were assessed by epifluorescence microscopy using a Zeiss Axiovert 200 M or Keyence BZ-X700 microscope with ×10 and ×20 objectives for the presence or absence of fluorescence in specific tissues.
Hepatic ablation
Hepatocyte ablation studies were conducted using Tg(l-fabp: CFP-NTR)s891 (background strain TL) (Curado et al., 2007). Transgenic embryos from in-crossed homozygous adults were collected from small group spawns. At 6 hpf, dechorionated embryos were hand-loaded into 96-well plates containing either 2 mM metronidazole (MTZ) or vehicle (0.2% DMSO). Immediately after loading, half of all MTZ- and vehicle-exposed animals were exposed to 12 µM BkF, and all wells were normalized to a final concentration of 1% DMSO using a Hewlett-Packard Digital Dispenser. At 5 days postfertilization (dpf), animals were screened for hepatic ablation by presence/absence of hepatic tissue fluorescence using a Zeiss ASDF fluorescence microscope with a green fluorescent protein (GFP) filter. Animals were then evaluated for mortality and ectopic caudal fin phenotype. Hepatic fluorescence imaging was performed using a Keyence BZ-X700 fluorescence microscope with a GFP filter.
Tissue isolation
To collect caudal fin tissue, larval zebrafish were euthanized in tricaine and the trunk was removed at the proximal end of the ventral pigment gap using a glass microdissection blade. Trunk tissue was collected at 48, 60, 72, and 96 hpf, pooling 50 animals per replicate at each time point. Collected tissue was immediately placed into RNAzol RT (Molecular Research Center, Inc, Cincinnati, Ohio) and frozen at −80°C until isolation.
RNA isolation and sequencing
Four biological replicates per treatment of total RNA were isolated from fin tissue samples using the Zymo Direct-zol RNA MiniPrep kit (Irvine, California). Embryos were homogenized in 500 μl RNAzol RT with 0.5 mm zirconium oxide beads using a bullet blender (Next Advance, Averill Park, New York) for 3 min at speed 8. Samples were stored at −80°C until RNA isolation. Total RNA was extracted according to the manufacturer’s protocols. The optional in-column DNase I digestion step was performed for the RNA-seq samples. Total RNA concentration was determined on a SynergyMX spectrophotometer using a Gen5 Take3 sample holder (BioTek Instruments, Inc, Winooski, Vermont).
RNA samples were placed in a 96-well RT-PCR plate and shipped overnight on dry ice to the University of Wisconsin-Madison Biotechnology Center (Madison, Wisconsin) for library preparation and sequencing. RNA integrity was determined using the Agilent 2100 Bioanalyzer. Samples were prepared using the Illumina TruSeq Stranded mRNA Library Prep Kit. Libraries were randomized across 4 lanes and sequenced with 100-bp single-end reads using the Illumina HiSeq 2500. Sequence files were transferred to the Pacific Northwest National Laboratory for analysis.
RNA-seq analysis
Sequences were filtered based on Illumina quality scores and analyzed for quality using FastQC analytical software (Babraham Bioinformatics). Read ends were trimmed using Trimmomatic (Bolger et al., 2014) to exclude low-quality sequences. Salmon’s quasi-mapping alignment method (Patro et al., 2017) was used to map reads to Danio rerio Zv9 Ensembl transcripts. Transcript abundances were aggregated to gene level counts using tximport (Soneson et al., 2015). Normalization and differential expression across statistical contrasts was performed using DESeq2 (Love et al., 2014) on genes with at least 10 counts in at least 3 samples. The raw and processed data are available on the National Center for Biotechnology Information’s Gene Expression Omnibus (GEO accession: GSE143945).
Ensembl BioMart (Durinck et al., 2005) was used to create the transcript-to-gene mapping key required for tximport to estimate gene expression levels (http://mar2015.archive.ensembl.org/biomart/martview, last accessed January 14, 2020; Ensembl Genes 79, Zv9 via Bioconductor [Huber et al., 2015] package biomaRt [Durinck et al., 2009]). For clustering analyses, regular-log transformation was applied to the relative gene counts to correct for the heteroscedasticity inherent in RNA-seq data (Love et al. 2016). Principle components analysis was performed in RStudio (RStudio Team, 2016) using the base R (R Core Team, 2017) package, stat, and visualized with ggplot2 (Wickham, 2016), ggthemes (Arnold, 2017), and ggrepel (Slowikowski, 2017). MatrixStats (Bengtsson, 2017) was used to identify genes that varied most in their expression across samples. Transformed count values of selected genes were scaled by z-score, and heatmaps with bidirectional, hierarchical clustering were produced using ComplexHeatmap (Gu et al., 2016). For images of the top 100 significant differentially expressed genes (DEGs), a DEG list for each comparison (p ≤ .05) was sorted based on either the Benjamini-Hochberg method of false discovery rate (FDR) at 5% or absolute log2FC (log2-fold change), and the top 100 genes (or all DEGs in cases with fewer than 100) from each ordered gene list were combined to create a master list of top combined DEGs.
All statistical analyses were performed using custom code developed in R (R Core Team, 2017). Gene Ontology (GO) term enrichment analysis was performed on separate upregulated and downregulated gene sets using topGO (Alexa and Rahnenfuhrer, 2010). Excluding terms with fewer than 30 significantly differentially expressed transcripts (FDR-adjusted p ≤ .05), the 15 terms with the lowest p value were selected from each time point and cross referenced to identify other time points for which that term was significant. The GO term and categorical gene heatmaps were generated using the Broad Institute’s online tool Morpheus (https://software.broadinstitute.org/morpheus, last accessed September 22, 2019). Gene heatmaps were hierarchically clustered by Euclidean distance. Venn diagrams were created using Venny 2.1.0 (Oliveros, 2016).
For the MetaCore enrichment analysis, D. rerio Ensembl gene IDs were converted to their orthologous human Ensembl IDs and gene symbols using the Bioinformatics Resource Manager v2.3 (BRM) with Ensembl release 91 (Tilton et al., 2012). TF target enrichment analysis was performed for each time point using genes that having a log2FC > 1. Gene targets were identified using MetaCore’s network building tool based on direct interactions. Interactome figures were generated by importing the direct interactions data into Cytoscape v3.7.1 (Shannon et al., 2003).
RESULTS
Characterization of BkF-mediated Caudal Fin Duplication
We performed static developmental exposures of dechorionated zebrafish embryos to BkF from 6 to 120 hpf (Figure 1). A concentration between 3 and 12 μM BkF (1% DMSO) was sufficient to induce the ectopic caudal fin (X-fin) phenotype in all animals with the exception of infrequent outliers (ie, sometimes 1 larva in a standard exposure might not exhibit the phenotype). Aside from exhibiting X-fin, BkF-exposed animals appeared morphologically normal (Figure 2A). We did not observe adverse effects of BkF exposure until 60–72 hpf, at which point the caudal fin fold was misshapen (Figure 2). Malformations varied by size and shape of the fin fold with additional variation in localized pigmentation (Figure 2C-i and C-ii). In some cases, the notochord was bent at the caudal tip. Despite these variations, by 96 hpf all animals exhibited an ectopic fin fold (X-fin) along the lateral edge of the caudal trunk perpendicular to the normal fin fold (Figs. 1B, 1C, and 2B). This structure extended proximodistally and rostrocaudally over time. By 120 hpf, the base of X-fin extended from the region of the notochord tip to the rostral edge of the pigment gap and was accompanied by localized hyperpigmentation in the same region (Figure 2B). At this time point, X-fin varied in size between individuals (Figs. 2B and 2C-iii) and in some cases extended rostrally beyond the pigment gap. Exposures of up to 50 μM BkF did not produce additional effects aside from minor pectoral fin protrusion (not shown).
Figure 2.

Manifestation and progression of the X-fin phenotype during benzo[k]fluoranthene (BkF) exposure. A, Triplicate animals from different time stages (48, 60, 72, 96, and 120 hpf) exposed to either 1% dimethyl sulfoxide (DMSO) or 12 μM BkF in a standard embryonic exposure. Animals exposed to BkF are phenotypically normal except for caudal fin fold malformations and hyperpigmentation localized to the caudal region of the trunk. B, Magnified images showing caudal trunks of animals exposed to either 1% DMSO or 12 μM BkF. Fin fold malformations and hyperpigmentation during BkF exposure are apparent at 60 and 72 h postfertilization (hpf). X-fin had emerged by 96 hpf and continued to grow through 120 hpf. C, Variation in the progression of the X-fin phenotype. At intermediate stages of development, the fin fold and pigmentation malformations were variable as represented by 72 hpf animals in panels (i) and (ii). At 120 hpf, all animals exhibited X-fin, which varied in size. Panel (iii) represents the lower extreme in X-fin growth, whereas the above panel represents the higher extreme. Red dashed lines indicate the approximate boundary of X-fin.
Critical Window of Sensitivity to BkF and AHR Dependency
To characterize the window of sensitivity, we exposed larvae to 3 μM BkF during specific windows of development (Figure 3). Exposure to BkF within the 12–36 hpf window maximally elicited the X-fin phenotype. The greatest percent effect (93%) was observed in a static exposure between 6 and 120 hpf. Exposures that started after 36 hpf did not elicit the phenotype, and shorter exposure durations did not fully recapitulate the percent effect observed in our static 6–120 hpf screening protocol.
Figure 3.

Critical window of sensitivity for static zebrafish embryo exposure to 3 μM benzo[k]fluoranthene versus 1% dimethyl sulfoxide. Percent effect (out of n = 16) indicates the prevalence of the X-fin phenotype for the windowed exposure period indicated by the black bars. Gray box indicates when the visible phenotype emerged.
As previously reported (Geier et al., 2018), exposure to BkF induced unusual skin and neuromast expression of Cyp1a at 120 hpf, which indicated elevated AHR signaling in these tissues. We interrogated AHR dependency of caudal fin duplication via transient antisense knockdown of each zebrafish AHR isoform (Ahr1a, Ahr1b, and Ahr2) using morpholino oligos (MOs). Control morphants exposed to 3 μM BkF exhibited 100% prevalence of the X-fin phenotype, knockdown of Ahr1a resulted in 91.7% prevalence (Figure 4), knockdown of Ahr1b resulted in 66.7% prevalence, and knockdown of Ahr2 completely prevented development of the X-fin phenotype (0% prevalence). Concordant with these results, knockdown of Ahr1a and Ahr1b did not alter the pattern of Cyp1a expression in response to BkF, but knockdown of Ahr2 eliminated expression of Cyp1A in skin, but not the neuromasts (Figure 5).
Figure 4.

Representative brightfield images of caudal fins of 3 μM benzo[k]fluoranthene (BkF)- or 1% dimethyl sulfoxide (DMSO)-treated animals at 120 h postfertilization. Pictured are control, ahr1a, ahr1b, and ahr2 morphants (n = 16 per treatment). Abbreviations: CO MO, control morpholino; MO, morpholino oligo.
Figure 5.

Cyp1a expression patterns related to 3 μM benzo[k]fluoranthene (BkF) or 1% dimethyl sulfoxide (DMSO) exposure (n = 16 per treatment). Skin expression was Ahr2 dependent but expression in neuromasts was not dependent on any AHR isoform. Abbreviation: MO, morpholino oligo.
No Hepatic Dependency of BkF-mediated Caudal Fin Duplication
AHR activation induces transcription of phase I metabolic enzymes, and for PAHs in particular, this often leads to bioactivation (Crowell et al., 2011). The differentiation of hepatic tissue approximates the window of sensitivity to BkF (Ober et al., 2003). Given the AHR dependency of the X-fin phenotype, we sought to determine whether hepatic function was necessary. One approach to test this involves knocking in a bacterial nitroreductase gene with a tissue-specific promoter for conditional ablation (Curado et al., 2007). Embryos from these animals can be exposed to the prodrug MTZ, which nitroreductase metabolizes into a bioactive cytotoxin, for specific tissue ablation.
Using homozygous Tg(l-fabp: CFP-NTR)s891 embryos, we conditionally ablated hepatocytes by static exposure to 2 mM MTZ from 6 to 120 hpf in 2 separate experiments. Consistent with previous work, no background adverse effects were detected as a result of MTZ treatment. Hepatic ablation of MTZ-treated animals was confirmed at 5 dpf using fluorescence microscopy. Animals not treated with BkF did not exhibit the X-fin phenotype, regardless of MTZ treatment (Figure 6). Conversely, all animals treated with BkF had the X-fin phenotype except for 1 MTZ-treated animal in the Plate 1 experiment (Table 3).
Figure 6.

Hepatic ablation of Tg(l-fabp: CFP-NTR)s891 larvae at 120 h postfertilization (hpf) following static embryonic exposure to 12 μM benzo[k]fluoranthene (BkF), 2 mM metronidazole (MTZ), both, or neither (1% dimethyl sulfoxide). Panels show caudal fin phenotype, anterior brightfield, anterior green fluorescent protein (GFP) channel, and overlay. The trunk and anterior belong to the same individual for each respective treatment. The X-fin phenotype was detected in BkF-treated animals regardless of MTZ treatment.
Table 3.
Mortality and X-fin Prevalence Observed in Tg(l-fabp: CFP-NTR)s891 Larvae at 120 hpf Following a Static Embryonic Exposure to Either 12 μM BkF, 2 mM Metronidazole, Both, or Neither (1% DMSO)
| Plate 1 |
Plate 2 |
|||
|---|---|---|---|---|
| Treatment | Mortality | X-fin | Mortality | X-fin |
| (−) MTZ, (−) BkF | 0/24 | 0/24 | 1/24 | 0/24 |
| (−) MTZ, (+) BkF | 2/24 | 22/24 | 2/24 | 22/24 |
| (+) MTZ, (−) BkF | 1/24 | 0/24 | 1/24 | 0/24 |
| (+) MTZ, (+) BkF | 0/24 | 23/24 | 1/24 | 23/24 |
Hepatic ablation (+MTZ treatments) had no discernable effect on the induction of X-fin following BkF exposure, nor on overall mortality.
Abbreviations: BkF, benzo[k]fluoranthene; DMSO, dimethyl sulfoxide; MTZ, metronidazole.
Transcriptomics Summary
To investigate global changes in the transcriptome that corresponded to development of the X-fin phenotype, we collected tissue samples of the caudal trunk region, just below the pigment gap, in animals exposed to BkF (12 μM to ensure 100% prevalence) or vehicle (1% DMSO). To capture the changes in gene expression prior to and during emergence of the phenotype, we collected tissue at 4 time points: prior to visual emergence of X-fin (48 hpf), when the caudal fin fold is visibly malformed (60 and 72 hpf), and after X-fin emergence (96 hpf; Figure 2B). Principal components analysis indicated strong separation between BkF- and vehicle-treated animals along PC1 (x-axis, 37%). Separation between time points occurred along PC2 (y-axis, 26%) with a clearer separation in BkF-treated animals compared with vehicle-treated animals (Supplementary Figure 1).
A total of 11 215 unique DEGs (FDR-adjusted p < .05) were identified across all time points. The number of DEGs increased as each time point progressed (Table 4). A 20.3% of all identified DEGs were shared across all time points (Figure 7). The 60 and 72 hpf time points shared the greatest number of DEGs and 48 and 96 hpf shared the fewest. Each pairwise comparison had at least 30% of their DEGs in common.
Table 4.
Number of Differentially Expressed Genes in Caudal Trunk Tissue Following Static Exposure to 12 μm Benzo[k]Fluoranthene Versus 1% Dimethyl Sulfoxide Across All Time Points
| Number of Differentially Expressed Genes |
||||
|---|---|---|---|---|
| 48 hpf | 60 hpf | 72 hpf | 96 hpf | |
| Increased expression | 1774 | 2808 | 3551 | 3795 |
| Decreased expression | 1979 | 2750 | 3501 | 4196 |
| Total | 3753 | 5558 | 7052 | 7991 |
Figure 7.

Venn diagrams of differentially expressed genes (adjusted p value < .05) in animals exposed to 12 μM benzo[k]fluoranthene or 1% dimethyl sulfoxide. A, Across all 4 time points. B, Pairwise comparisons. Abbreviation: hpf, hours postfertilization.
Hierarchical clustering of the top 100 DEGs indicated clear separation between BkF- and vehicle-treated animals (Figure 8). Across all time points, the most upregulated DEGs in response to BkF were cytochromes associated with canonical AHR activation (cyp1a, cyp1b1, cyp1b2, cyp1c2, cyb5a), with log2FC > 7 at each time point. The most downregulated genes were related to keratin filament construction (zgc: 158846, krtt1c19e), with log2FC > 2 at each time point. Other canonical AHR activation responses included upregulation of phase I and II metabolic genes and AHR repressors (eg, ugt1b1, cyb5a, foxq1a, gstp2, and ahrrb), and downregulation of sox9b (Garcia et al., 2018).
Figure 8.

Heatmap of the top 100 differentially expressed genes with highest fold changes in caudal trunk tissue following exposure to benzo[k]fluoranthene (BkF) versus 1% dimethyl sulfoxide across 4 time points, bi-hierarchically clustered according to treatment, age, and gene. Color indicates distance from average regular log-transformed gene counts across all samples, with blue indicating lower than average expression and red indicating higher than average expression. Abbreviation: hpf, hours postfertilization.
GO Term Pathway Analysis
GO enrichment analysis was used to identify the 15 most upregulated and downregulated processes in each time point, which were then cross referenced for significance at the other time points (Figure 9). The most significantly enriched upregulated GO term across all time points was cellular response to xenobiotic stimulus, which mostly contained cytochrome P450s and other phase I metabolism enzymes. Several other GO terms related to xenobiotic response were also significantly altered across all 4 time points, including upregulation of response to stress and response to external stimulus, and downregulation of oxidation-reduction processes. Processes related to cell redox homeostasis were upregulated in all but the 48 hpf time point.
Figure 9.

Heatmap of significant (p ≤ .05) Gene Ontology term enrichments across 4 time points in caudal trunk tissue following exposure to 12 μM benzo[k]fluoranthene versus 1% dimethyl sulfoxide . Red indicates significantly enriched processes among upregulated genes, blue indicates significantly enriched processes among downregulated genes, and white indicates processes that were not significantly enriched at the given time point. Abbreviation: hpf, hours postfertilization.
Several GO terms related to DNA and RNA functional processes were downregulated in the caudal fin with exposure to BkF, primarily at 72 and 96 hpf. Translation was downregulated at 72 hpf, including elongation and formation of the translation preinitiation complex. As might be expected with BkF, a long-known mutagen (Weyand et al., 1988), the mitotic DNA damage checkpoint, which helps ensure DNA damage has been adequately repaired before cell division, was downregulated. In addition, DNA biosynthesis was downregulated in all time points except 48 hpf.
Several other processes that have previously been identified as downstream effects of the AHR were differentially expressed. As previously reported for other PAHs that activate the AHR (Goodale et al., 2013), ion transport was differentially regulated when exposed to BkF. ATP hydrolysis coupled proton transport and zinc II ion transmembrane transport were significantly upregulated processes in all 4 time points, whereas cellular calcium ion homeostasis was significantly downregulated at 96 hpf. As would be expected due to the observed increased pigmentation at the caudal peduncle at 120 hpf, the cellular pigmentation GO term was significantly upregulated at 60 and 72 hpf.
Multiple signaling pathways were significantly downregulated in response to BkF exposure, all with known roles in axis formation, cell differentiation, apoptosis, or cell growth regulation. Wnt signaling, which has documented roles in vertebrate anterior-posterior and dorsoventral axes formation, was downregulated in all 4 time points (Hikasa and Sokol, 2013; Ten Berge et al., 2011). The integrin-mediated signaling pathway, which regulates cell survival, apoptosis, proliferation, and differentiation (Moreno-Layseca and Streuli, 2014), was also downregulated across all 4 time points. At 48 hpf, the adenylate cyclase-modulating G-protein coupled receptor signaling pathway was downregulated. The JNK cascade, which is modulated by G-protein coupled receptors (Gutkind, 1998), was also downregulated at 48, 60, and 96 hpf. These pathways together control apoptosis and cell growth that could contribute to development of the X-fin phenotype. Finally, Notch signaling, which controls anterior-posterior polarity during somitogenesis (Galceran et al., 2004), embryo polarity, mesoderm, cell fate, and left-right asymmetry determination (Levin, 2005), was significantly downregulated at 96 hpf. Fin regeneration processes were observed to be significantly upregulated in all 4 time points, particularly processes involving cell fate, adhesion, and migration. Regulation of cell fate specification and cell-cell adhesion was upregulated across all 4 time points, as was cell fate commitment involved in formation of primary germ layer.
Several processes related to neuronal development in general, and lateral line development specifically, were enriched in the GO term analysis. Hair cell differentiation was downregulated across all 4 time points along with the sensory hair cell development involved in the formation of posterior lateral line neuromasts. Cilium assembly, required for development of cilia on hair cells, was upregulated at 60 and 72 hpf. Embryonic camera-type eye morphogenesis was downregulated across all 4 time points, whereas retina morphogenesis was upregulated across all 4 time points. Other, more general neuronal processes were differentially regulated with exposure to BkF, including the downregulation of axonogenesis, brain development, and neuron fate specification.
Gene Expression Survey
Based on the GO term analysis and appendage-like characterization of the phenotype, we broadly surveyed the differential expression of genes associated with developmental and regenerative signaling, limb induction, and tissue patterning. Genes were placed into 1 of 3 categories (developmental signaling, transcriptional regulation, and extracellular matrix dynamics) based on annotations from the GeneCards library (Stelzer et al., 2016). For hierarchical clustering in each category, we selected genes that met 2 criteria: differential expression by at least 1 log2FC in 1 time point and significant differential expression in at least 3 time points. TFs underwent more stringent selection due to their abundance. DEGs were clustered based on their log2FC. Full DEG profiles for each time point are presented in Supplementary Table 1. In the following sections, all reported fold changes refer to log2FC.
Developmental signaling
We identified differential expression of genes encoding signaling ligands (and ligand-encoding enzymes), receptors, and modulators associated with several major developmental pathways. Our focus was on upstream pathways such as fibroblast growth factor (FGF), Wnt, BMP, transforming growth factor beta (TGF-β)/Activin, epidermal growth factor (EGF), Notch, Hedgehog, RA, stromal cell-derived factor (SDF), insulin-like growth factor (IGF), and ephrin signaling (Figs. 10A–C). Genes involved in other pathways were categorized as miscellaneous (Figure 10D).
Figure 10.

Heatmaps of differentially expressed genes involved in developmental signaling across 4 time points following exposure to 12 μM benzo[k]fluoranthene versus 1% dimethyl sulfoxide. Hierarchical clustering is based on log2-fold changes across each time point. Only genes with significantly changed expression at 3 time points and by greater than 1.0-fold (absolute change) in at least 1 time point were considered. A, Genes encoding signaling ligands or ligand-generating enzymes. B, Genes encoding signaling receptors. C, Genes encoding signaling modulators. D, Genes encoding miscellaneous signaling genes. Abbreviation: hpf, hours postfertilization.
Five genes that facilitate FGF, BMP, and RA signaling had high and sustained expression (Figure 10A) in response to BkF exposure and formed 2 hierarchical clusters. fgf7 (Cluster 1) was consistently among the top 10 upregulated genes across all time points, ranging from 5.3-fold (48 hpf) to 5.8-fold (96 hpf). Cluster 2 included another FGF (fgf20a) and a BMP (bmp8a) ligand, the latter of which has been shown to act through both TGF-β and BMP receptors in germ cells (Wu et al., 2017). These also responded strongly with 3.5- and 3.4-fold upregulation at 48 hpf, respectively. Genes encoding 2 enzymes that synthesize RA, aldh1a2 and aldh1a3, were upregulated 2.0- and 3.3-fold, respectively by 48 hpf. By 96 hpf, aldh1a2 expression had been upregulated by 3.2-fold. Cluster 3 contained genes upregulated to a lesser degree than Clusters 1 and 2. This included 2 Wnt (wnt5a, wnt2ba), 3 FGF (fgf10a, fgf16, 2 fgf22 variants), 2 BMP (gdf6a, bmp16), 2 EGF (hbegfa, areg), and 3 TGF-β/Activin (tgfb1, inhbaa, inhbb) ligands. In Cluster 4, expression of 7 Wnt ligands was downregulated along with ligands of Hedgehog (shhb), Notch (dlk2), and SDF (cxcl12a).
Receptor expression separated into up- and downregulated clusters (Figure 10B). In Cluster 1, 2 frizzled paralogs (fzd8a, fzd8b) decreased expression along with cxcr4a (cognate receptor of cxcl12a) and fgfr3. Cluster 2 included increased expression of fzd9b along with 2 ephrin receptors, epha2a and ephb3.
Among developmental signaling modulators (Figure 10C), the Wnt-promoting R-spondin (rspo1) and BMP-antagonizing grem2a had the largest expression increases, 2.4- and 2.9-fold, respectively by 48 hpf, and 3.6- and 4.2-fold by 96 hpf. Cluster 2, which also represented upregulated transcripts, included another R-spondin (rspo2) and a grem2 paralog. Two Wnt antagonists (dkk1a, dkk3b) were upregulated by 60 hpf whereas 2 Activin antagonists (fstb, bambia) were upregulated by 48 hpf. Also in Cluster 2 were a gene encoding an IGF-binding protein (igfbp6b), an antagonist of hedgehog signaling (ptchd4), and a negative feedback inhibitor of EGF signaling (errfi). In Cluster 3, downregulated genes included antagonists of hedgehog (hhip), BMP (grem1), and Wnt (notum2) signaling. Of 2 paralogs encoding IGF-binding proteins, igfbp2b was in Cluster 3 whereas igfbp2a was so strongly downregulated (2.7-fold at 24 hpf and 3.5-fold at 96 hpf) that it formed its own cluster.
Miscellaneous signaling (Figure 10D) included 3 clusters of genes (Clusters 1–3) with increased expression and 1 cluster (Cluster 4) with decreased expression. The most prominent upregulated transcript in Cluster 1 encoded the endothelin ligand precursor edn3 (4.8-fold). Cluster 2 included 2 genes associated with appendage regeneration (il11a, lepb) along with a metastasis suppressor (kiss1). Cluster 3 included genes encoding a facilitator of IL-11 signaling (il6st), connective tissue growth factor (ctgfb), fin bud initiation factor (fibinb), parathyroid hormone-like hormone (pthlha), and another endothelin (edn1). Cluster 4, composed of genes with decreased expression, included a paralog to edn3 (edn3b). An oxidative stress-responsive gene that regulates cell death (osgn1) had maximal decreased expression at 60 hpf (2.7-fold).
Transcriptional regulation
Because many TFs had significantly altered expression, we clustered only those that were present in all 4 time points with increased expression in at least 1 time point by 1.5-fold (this stringent approach was applied only to TFs). Four clusters emerged using this approach, 2 of which comprised a single TF (Figure 11A). prdm14 (Cluster 1), required for maintaining embryonic stem cell pluripotency and regulating the primordial germ cell (PGC) lineage (Yamaji et al., 2008, 2013), had increased expression ranging from 2.5-fold (48 hpf) up to 4.3-fold (72 hpf). Other TFs with increased expression (Cluster 2) included those having a well-established association with development and regeneration (Garland, Franzosa, Dunham, Sullivan, Wendler, Brown, and Tanguay, in preparation). Of note were limb-related genes (lef1, sall1b, sox14, hand2, tbx2, prdm1, sp9) as well as homeotic genes (dlx4b, msxd) and AP-1 subunits (junbb, fosl2, junba, fosl1a). In addition, vox and nkx1-3 are involved in dorsoventral patterning and epithelial growth (Fabian et al., 2016; Tanaka et al., 2000), respectively, whereas foxq1a is a known AHR target. There were other TFs associated with limb bud formation that had increased expression but did not pass stringent filtering for hierarchical clustering (Supplementary Table 1). One of these was dlx3b, which is involved in hair follicle cell development and regeneration (Hwang et al., 2008).
Figure 11.

Heatmaps of differentially expressed genes involved in transcriptional regulation across 4 time points following exposure to 12 μM benzo[k]fluoranthene versus 1% dimethyl sulfoxide . Hierarchical clustering is based on log2-fold changes across each time point. For transcription factors, only genes with significantly changed expression in all 4 time points and by greater than 1.5-fold (absolute change) in at least 1 time point were considered. For chromatin modifiers, only genes with significantly changed expression in 3 time points and by greater than 1.0-fold (absolute change) in at least 1 time point were considered. A, Genes encoding transcription factors. B, Genes encoding chromatin modifiers. Abbreviation: hpf, hours postfertilization.
Several developmental TFs were also decreased in expression. sox9b (Cluster 3), whose AHR-responsiveness is controlled by AHR-dependent expression of a lncRNA (Garcia et al., 2018), decreased in expression by 2.5-fold at 96 hpf. Those having a greater decrease in expression at 48 hpf (vs 96 hpf) included the putative tumor suppressor tp76 and the sine oculus homeobox factor six2a, which mediates organogenesis (Yamamoto-Shiraishi and Kuroiwa, 2013). TFs having a greater decrease at 96 hpf (vs 48 hpf) included a limb-related gene (osr2), another tumor suppressor (klf6b), a regulator of lung epithelium (foxp2), and 3 regulators of neural development (dlx1a, foxg1a, sox1a).
Using the less-stringent filtering approach, 6 chromatin modifiers separated into 2 clusters with increased versus decreased expression (Figure 11B). Of note was the increased expression of cbx7a (Cluster 1), which encodes a Polycomb group factor required for pectoral fin development and caudal fin regeneration (unpublished data). Its expression increased from 1.9-fold (48 hpf) to 2.2-fold (60 hpf), and subsequently decreased to 1.2-fold by 96 hpf. Cluster 2 included a chromatin-modifier of immune-related genes (eya4) whose expression is known to decrease at the initiation of caudal fin regeneration (Garland, Franzosa, Dunham, Sullivan, Wendler, Brown, and Tanguay, in preparation).
Matrix dynamics
Increased expression of AP-1 subunits and developmental signaling ligands suggested differential expression of downstream genes involved in tissue remodeling. We examined differential expression of extracellular matrix (ECM) components and enzymes that regulate its structure. Among ECM components (Figure 12A), several integrin α- and β-subunits showed decreased expression (Cluster 1). ECM components with the highest increased expression (Cluster 2) included fibronectin (fn1b), a basement membrane component (frem3), an innate immunity regulator (cd200), and a mesenchymal stem cell marker (cd248). itga11 was not expressed at 48 hpf but was upregulated by 3.3-fold at 96 hpf. Other ECM components with increased expression (Cluster 3) included epidermal adhesion regulators (frem1, frem2), along with genes associated with fin regeneration such as cd44a and mvp.
Figure 12.
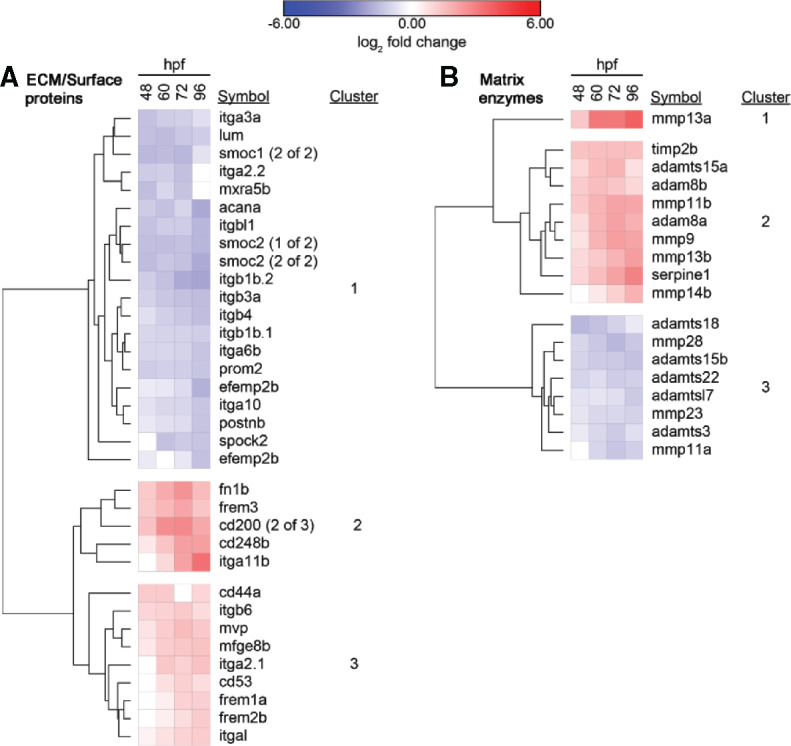
Heatmaps of differentially expressed genes involved in extracellular matrix dynamics across 4 time points following exposure to 12 μM benzo[k]fluoranthene versus 1% dimethyl sulfoxide . Hierarchical clustering is based on log2-fold changes across each time point. Only genes with significantly changed expression at 3 time points and by greater than 1.0-fold (absolute change) in at least 1 time point were considered. A, Genes encoding ECM and structural proteins. B, Genes encoding matrix-related enzymes. Abbreviations: ECM, extracellular matrix; hpf, hours postfertilization.
Among matrix-modifying enzymes (Figure 12B), the matrix metallopeptidase (MMP) mmp13a formed its own cluster (Cluster 1). It had a modest increase in expression at 48 hpf (1.3-fold) followed by an increase in 3.7-fold at 96 hpf. mmp13a is associated with embryonic development and wound healing. In Cluster 2, another facilitator of wound healing and keratinocyte migration (serpine1) followed a similar expression pattern (Simone et al., 2014). Cluster 2 also included 4 additional MMPs, timp2b, adamts15, and 2 adam8 paralogs. The enzyme with the greatest decreased expression at 48 hpf was adamts18 (Cluster 3), associated with several processes including tumor suppression.
MetaCore Transcription Factor Target Analysis
We sought to identify which TFs played an important role in the response to BkF exposure using an in silico approach. MetaCore software (Clarivate Analytics) provides analytical tools for biological systems data using manually curated information from the literature. We used MetaCore to predict TF activity and build a network of predicted direct gene interactions. To make the data compatible with MetaCore, zebrafish Ensembl gene IDs were converted to their orthologous human Ensembl IDs and gene symbols using the BRM (Tilton et al., 2012). Of all 21 604 unique DEGs, BRM converted 12 765 (59%) to human orthologs to generate the background gene list. At each time point, BRM converted the following numbers of DEGs to their human orthologs: at 48 hpf, 2939/3753 (78%) genes; at 60 hpf, 4434/5663 (80%); at 72 hpf, 5663/7052 (80%); and at 96 hpf, 6339/7991 (79%). We refined these lists to only include DEGs with an absolute log2FC > 1.
We used MetaCore’s TF enrichment tool to identify TFs whose number of target genes was enriched in our differential expression data (hereafter referred to as enriched TFs). Across all time points, MetaCore identified 52 unique TFs that were significantly (p ≤ .05) enriched, including 23 with increased expression and 29 with decreased expression (Table 5). Overall, enriched TFs with increased expression were primarily associated with developmental processes and inflammation. Consistent with AHR activation, the negative feedback regulator AHRR was enriched at all time points. Similarly, the developmental TFs FOSL1, LEF1, JUNB, and FOSL2 had early and sustained target enrichment. By 96 hpf, several developmental TFs had target enrichment including those involved in limb morphogenesis (HAND2, TBX2, SHOX2, and DLX3) (Bobick and Cobb, 2012; Gibson-Brown et al., 1998; Mullen et al., 1996; Osterwalder et al., 2014). BCL6, which controls T follicular helper cell development (Nurieva et al., 2009), along with the proinflammatory NFATC2, were both enriched at 60 and 72 hpf. A marker of neuronal injury, ATF3, was enriched at 72 and 96 hpf (Seijffers et al., 2006).
Table 5.
MetaCore Transcription Factor (TF) Target Enrichment Analysis of Differentially Expressed Genes in Larvae Exposed to 12 μM Benzo[k]Fluoranthene Versus 1% Dimethyl Sulfoxide
| Enriched | z-score | p Value | Enriched | z-score | p Value |
|---|---|---|---|---|---|
| (a) 48 hpf | (d) 96 hpf | ||||
| AHRR | 8.0 | 1.39E−04 | FOSL2 | 9.3 | 3.27E−12 |
| FOSL2 | 3.6 | 3.44E−03 | LEF1 | 8.3 | 1.54E−11 |
| FOSL1 | 4.3 | 4.44E−04 | FOSL1 | 8.1 | 7.80E−11 |
| JUNB | 3.7 | 1.94E−03 | CEBPB | 7.6 | 1.21E−11 |
| LEF1 | 4.1 | 5.14E−04 | FOS | 7.0 | 1.13E−09 |
| PPARA | 3.5 | 2.32E−03 | AHRR | 6.6 | 5.05E−05 |
| JUNB | 6.2 | 2.22E−07 | |||
| (b) 60 hpf | ASCL1 | 5.9 | 4.85E−07 | ||
| AHRR | 8.9 | 5.32E−06 | PPARG | 5.5 | 8.76E−07 |
| JUNB | 7.0 | 6.76E−08 | JUND | 5.4 | 1.23E−06 |
| TCF4 | 3.3 | 8.50E−03 | GATA4 | 5.1 | 4.29E−06 |
| FOSL2 | 4.9 | 1.17E−04 | FOXQ1 | 5.1 | 1.74E−04 |
| NFATC2 | 5.3 | 1.87E−05 | HOXB8 | 4.8 | 2.25E−03 |
| FOSL1 | 5.2 | 2.13E−05 | SIX2 | 4.7 | 9.57E−05 |
| LEF1 | 5.5 | 6.90E−06 | OLIG2 | 4.6 | 4.47E−05 |
| PPARA | 2.7 | 9.76E−03 | ISL1 | 4.5 | 6.12E−05 |
| BCL6 | 3.3 | 2.05E−03 | LMX1B | 4.4 | 1.27E−03 |
| TCF4 | 2.6 | 8.63E−03 | KLF2 | 4.4 | 3.53E−04 |
| FOXF1 | 4.3 | 4.57E−04 | |||
| (c) 72 hpf | ZIC1 | 4.2 | 2.68E−03 | ||
| AHRR | 7.4 | 2.09E−05 | PAX6 | 4.2 | 1.25E−04 |
| FOSL2 | 6.1 | 1.52E−06 | FOXA1 | 4.1 | 1.33E−04 |
| NFAT5 | 3.4 | 7.37E−03 | MAL | 3.9 | 1.65E−03 |
| TCF4 | 4.0 | 1.71E−03 | IRX3 | 3.9 | 3.07E−03 |
| JUNB | 7.2 | 1.20E−08 | FOSB | 3.7 | 1.51E−03 |
| FOSL1 | 5.7 | 2.69E−06 | MYOD1 | 3.7 | 7.15E−04 |
| FOXF1 | 3.1 | 8.07E−03 | BCL11B | 3.7 | 1.21E−03 |
| NFATC2 | 4.9 | 3.07E−05 | KLF13 | 3.7 | 9.88E−03 |
| LEF1 | 5.5 | 3.57E−06 | SHOX2 | 3.7 | 9.88E−03 |
| ZBTB16 | 3.4 | 3.47E−03 | MEOX1 | 3.6 | 2.02E−02 |
| PBX1 | 3.3 | 2.10E−03 | HOXA1 | 3.6 | 2.02E−02 |
| BCL6 | 4.6 | 2.62E−05 | ATOH1 | 3.6 | 1.39E−03 |
| PPARA | 2.9 | 5.37E−03 | MAFB | 3.5 | 1.88E−03 |
| ATF3 | 3.0 | 3.90E−03 | MYT1 | 3.3 | 1.03E−02 |
| TCF4 | 2.9 | 3.27E−03 | NR4A1 | 3.3 | 3.55E−03 |
| TLX3 | 3.3 | 1.62E−02 | |||
| TBX2 | 3.2 | 8.19E−03 | |||
| MYB | 3.2 | 2.81E−03 | |||
| ATF3 | 3.0 | 3.51E−03 | |||
| HOXA2 | 3.0 | 2.91E−03 | |||
| POU3F3 | 2.9 | 1.28E−02 | |||
| FOXP2 | 2.8 | 5.42E−03 | |||
| HAND2 | 2.7 | 1.34E−02 | |||
| DLX3 | 2.7 | 1.89E−02 | |||
| PROX1 | 2.5 | 1.67E−02 | |||
| VIT | 2.4 | 1.71E−02 |
TFs were subject to a log2FC > 1.0 cut-off. Analysis was performed at each of the 4 time points: (a) 48 hpf, (b) 60 hpf, (c) 72 hpf, and (d) 96 hpf. The z-score is a measure of how saturated the number of connections is for a particular TF.
Abbreviation: hpf, hours postfertilization.
Enriched TFs with decreased expression were similarly associated with development and inflammation, but there were several others having roles in neuronal development or axis specification. The metabolic regulator PPARA had an enrichment of targets at 48 and 60 hpf. Starting at 60 hpf, enriched TFs involved in neuronal development were identified among those with decreased expression. TCF4, which initiates neuronal differentiation (Forrest et al., 2013), was enriched at 60 and 72 hpf. By 96 hpf, several TFs involved in neuronal development were enriched including POU3F3, ASCL1, ZIC1, PAX6, PROX1, TLX3, IRX3, ISL1, OLIG2, MYT1, ATOH1, and FOXP2. There were also enriched TFs involved in anteroposterior axis specification (HOXA2, HOXB8, and HOXA1), mesoderm development (MEOX1 and MYOD1), and limb patterning (LMX1 and SIX2).
TF network analysis
We sought to integrate the above data into a visual network and identify possible pathways leading to fin duplication. We focused on the 48 hpf interactome to identify the upstream interactions potentially leading to the X-fin phenotype (Figure 13). MetaCore identified a direct interaction between AHR and ALDH1A3. AHR was also predicted to interact with the prostaglandin synthesizing gene PTGS2, associated with inflammation and the downstream synthesis of the proregeneration prostanoid, prostaglandin E2 (Park et al., 2006). Because bmp8a was prominently upregulated and can potentially activate both TGF-β and BMP receptors, we included SMAD2/3 and SMAD1/5/8 in our analysis. SMAD2/3 and SMAD1/5/8 were predicted to interact with several notable genes in our data including TFs involved in limb development (LEF1, DLX3) and the cellular stemness promoter PRDM14. FGF7 was predicted to be regulated by both JUNB and SMAD1/5/8. We identified 2 degrees of separation between AHR and SMAD2/3, SMAD1/5/8, and LEF1 through the chemokine receptor CXCR4. AP-1 subunits were predicted to be involved in PRDM1 induction (Bikoff et al., 2009).
Figure 13.

MetaCore interactome of enriched and predicted active transcription factors (TFs) and their target interactions at 48 h postfertilization following exposure to 12 μM benzo[k]fluoranthene versus 1% dimethyl sulfoxide . Log2-fold change (log2FC) is displayed as a gradient increasing from blue to yellow. The upstream activated TF (aryl hydrocarbon receptor) is red and the TFs hypothesized to be activated (SMAD2/3 and SMAD1/5/8) are teal. The size of each node reflects the number of interactions.
DISCUSSION
We are only beginning to unravel the complex role of the AHR in development and physiology. Developmental exposure of zebrafish to a small class of PAHs, represented in this study by BkF, lead to AHR-dependent duplication of the caudal fin. This phenotype, “X-fin,” is unique to this particular class of AHR ligands (Geier et al., 2018). The phenotype implied significant disruption of upstream developmental pathways, which we confirmed using RNA sequencing.
Because X-fin is absolutely dependent on Ahr2, the most orthologous form to the human AHR, it may also represent a conserved structure-activity relationship (SAR) among vertebrates. Our knockdown approach using MOs also showed that Ahr1b influenced severity and penetrance of the phenotype, suggesting BkF additionally interacted with Ahr1b. Notably, Ahr1b has been shown to act as a functional receptor of some AHR ligands and can bind dioxin response elements, leading to transcriptional activity. If the downstream activity of Ahr1b contributed to X-fin, we would also expect that ahr2 morphants would exhibit some level of phenotypic penetrance. None of the ahr2 morphants exhibited any degree of X-fin, demonstrating that the downstream consequences of Ahr1b binding are insufficient to induce X-fin without the presence of Ahr2. Furthermore, the immunofluorescence results suggest that the Ahr1b pathway is not activated, yet the MO results indicated some BkF-Ahr1b interaction. The biological implications of this are unclear, but the results demonstrate that Ahr2 is the key paralog for AHR-mediated activity following BkF exposure. It is possible that Ahr1b may somehow cooperate with Ahr2 to increase AHR activity and observed penetrance, but the exact mechanism for such an interaction is unknown.
One of our objectives was to determine whether metabolism (bioactivation) played a role in X-fin. There is a strong correlation between the metabolic competency of larvae and hepatogenesis (Ober et al., 2003), so we prevented this by ablating hepatocytes in Tg(l-fabp: CFP-NTR)s891 animals. Exposing homozygous animals from the Tg(l-fabp: CFP-NTR)s891 transgenic line to 2 mM MTZ was sufficient to completely ablate hepatocytes as determined by fluorescence microscopy. Thus, MTZ exposure starting at 6 hpf effectively prevented hepatogenesis during development and BkF coexposure. As in previous work that used this transgenic line (Chlebowski et al., 2017b), exposure to 2 mM MTZ had no detectable adverse effect on development, indicating that coexposure did not confound the teratogenic effect of BkF. Hepatic ablation had no effect on X-fin formation, indicating that hepatic metabolism of BkF was not required for the signaling that led to X-fin. Together with the window of susceptibility data, these results indicated that AHR activation by BkF specifically disrupted development prior to 36 hpf. It also demonstrated that loss of susceptibility to BkF after 36 hpf was not a consequence of hepatic metabolism of the parent compound. Although our results suggested that the parent BkF elicited the X-fin phenotype, the hepatic ablation results did not rule out the possibility that a BkF metabolite drove appendage duplication. Furthermore, despite demonstrated efficacy of this transgenic model, the possibility remains that some hepatocytes managed to survive the treatment undetected. Although hepatocytes are major sites of xenobiotic metabolism, our IHC results demonstrated increased expression of Cyp1a, a key marker of AHR activity, in the skin and neuromasts. MO knockdown of Ahr2, which prevented BkF-mediated caudal fin duplication, also prevented increased Cyp1a expression in the skin but not the neuromasts. If metabolism was required for the X-fin phenotype, then the critical metabolic activity most likely occurred in the skin rather than neuromasts or hepatic tissue. However, there is currently no method to broadly disrupt in vivo xenobiotic metabolism specifically in the skin without other confounding effects.
Previous studies on mutant zebrafish demonstrated that unattenuated Wnt (mercedes mutant) or BMP (dino mutant) signaling resulted in caudal fin duplication (Hammerschmidt et al., 1996). Although mercedes mutants have a characteristic phenotype that includes a ventral duplication of the caudal fin, the dino mutants have a lateral fin duplication that appears morphologically similar to X-fin. Injection of synthetic Xenopus BMP4 into zebrafish embryos resulted in a similar phenotype with varying degrees of caudal fin branching. In Xenopus, overexpression of BMP4 did not result in appendage duplication but rather increased expression of dorsal markers and absence of the optic stalk (Sasagawa et al., 2002). Thus, disruption of conserved molecular processes may manifest uniquely in different species. Although we would not expect appendage duplication to be a conserved phenotype of BkF exposure across vertebrate species, X-fin may represent disruption of evolutionarily conserved AHR-dependent signaling.
Transcriptomic profiling of the caudal trunk, where the X-fin phenotype was manifest, indicated changes consistent with AHR activity. This included increased expression of phase I and II metabolic enzymes, the factors ahrrb and foxq1a, and decreased expression of sox9b (Garcia et al., 2018). The tissue at the base of the duplicate fins was hyperpigmented, a phenomenon that is also associated with TCDD exposure. This may be a consequence of strongly increased expression of edn3, which drives melanogenesis. In addition, we observed increased expression of R-spondins, which positively regulate Wnt signaling. We previously found that AHR mediates induction of rspo1 during TCDD exposure, which drove inappropriate Wnt signaling and prevented fin regeneration (Mathew et al., 2008). Here, GO term enrichment indicated decreased Wnt signaling despite increased R-spondin gene expression. We note that wnt5a, with expression increased by 1.5- to 1.9-fold across all time points, had the largest expression increase in all Wnt ligands. wnt5a typically inhibits canonical signaling, except for when fzd4 is present (Mikels and Nusse, 2006) for which it functions as a canonical Wnt ligand. We detected fzd4 expression in our experiments, although it decreased expression at 72 hpf (Supplementary Table 1C). Although the TF target enrichment analysis indicated a key role for the canonical Wnt transducer Lef1 in altering the transcriptional profile during BkF exposure, it is unclear what drove its expression or what its relation to X-fin was.
Major shifts in other key signaling pathways were detected prior to emergence of the duplicate fin. Many of these changes were robustly sustained across 4 different time points during development. Because early developmental processes are implicated, we focused subsequent transcriptional analyses on the earliest time point (48 hpf). In addition, both GO term enrichment and profiling of genes strongly suggest altered paracrine signaling (eg, epithelial-mesenchymal interactions) which guides developmental processes such as limb or fin induction (Lonai, 2003). Two signaling proteins, the FGF ligand fgf7 and BMP ligand bmp8a, both had robust and sustained expression across all time points. In development, fgf7 is a stromally derived protein that drives formation of the apical ectodermal ridge, an epithelial structure which in turn directs underlying mesenchymal tissue to induce a limb bud (Giri and Ittmann, 2000). BMP8A is used in human stem cell cultures to derive PGC-like cells, and in vivo it promotes phosphorylation (activation) of SMAD2/3 (via TGF-β/Activin receptors) and SMAD1/5/8 (via BMP receptors) in murine PGCs (Wu et al., 2017). We found several SMAD target genes that were differentially expressed in our data, so we included these TF complexes in our network analysis to identify potentially important signaling mechanisms. MetaCore predicted an interaction between SMAD1/5/8 and FGF7, suggesting BMP signaling was upstream of FGF signaling. SMAD1/5/8 was also predicted to induce PRDM14, a TF marker of PGCs which had the greatest increased expression across all time points in our data (aside from AHRRB). PRDM14 promotes stemness in PGCs and prevents cells from entering an endodermal lineage (Ma et al., 2011). We consistently observed enrichment of endothelial proliferation among genes with decreased expression. Previous work established that AHR activation can prevent differentiation of human stem cells into PGCs (Kee et al., 2010). In our data, we observed an opposite effect where PGC markers were strongly upregulated. Considering that PGCs should have migrated away from the caudal trunk and to the genital region by 24 hpf during normal zebrafish development, these results suggest that BkF could either prevent normal PGC migration or cause trunk tissue to take on a PGC-like molecular profile with increased TGF-β/BMP signaling.
It is clear from the transcriptomic data that BkF exposure drastically affects crucial pathways involved in appendage development. How does AHR activation lead to these downstream changes? Parsimonious explanations would be (1) AHR-induced expression/activity of enzymes that convert BkF into an active metabolite that drives these changes, or (2) direct regulation by AHR of a factor that instructs appendage development or alters patterning. Although we established that hepatic metabolism is most likely not involved in X-fin, there is still the possibility that metabolism occurs in the nonablated tissues such as skin, which may lead to a bioactive form of BkF. To address this hypothesis, future studies would need to identify and isolate the in vivo products of BkF metabolism. A more direct explanation, however, may be found in the network analysis (Figure 13). The AHR is known to regulate ALDH1A3 expression in human stem cells and lesions such as breast cancer (Kim et al., 2009; Lo and Matthews, 2012). This enzyme biosynthesizes RA with a high affinity for all-trans retinal. RA is sufficient to instruct embryonic tissues to develop appendages in vertebrate species (Niederreither et al., 1996). If the AHR regulates aldh1a3 expression in zebrafish as it does in human cells, then this could represent the most direct route of X-fin induction from AHR activation to phenotype.
In summary, we identified a unique ectopic fin phenotype following BkF exposure, indicative of a novel SAR between some PAHs and the AHR. Dependency on the Ahr2 paralog demonstrated that this relationship may be conserved across vertebrates. Hepatic metabolism was not required for the ectopic X-fin, implying a role for the parent compound or metabolism in nonhepatic tissues. Our findings uncovered likely impacts to AHR-mediated signaling through FGF, BMP, RA, and other pathways and demonstrated that AHR crosstalk with other pathways may be more complex than currently understood.
SUPPLEMENTARY DATA
Supplementary data are available at Toxicological Sciences online.
Supplementary Material
ACKNOWLEDGMENTS
We thank Carrie Barton and the zebrafish husbandry staff at the Sinnhuber Aquatic Research Laboratory (SARL) for their invaluable technical assistance.
FUNDING
National Institute of Environmental Health Sciences (P42 ES016465 and T32 ES007060).
DECLARATION OF CONFLICTING INTERESTS
The authors declared no potential conflicts of interest with respect to the research, authorship, and/or publication of this article.
REFERENCES
- Alexa A., Rahnenfuhrer J. (2010). topGO: Enrichment analysis for gene ontology. R Package Version 2, 2010. [Google Scholar]
- Andreasen E. A., Mathew L. K., Tanguay R. L. (2006). Regenerative growth is impacted by TCDD: Gene expression analysis reveals extracellular matrix modulation. Toxicol. Sci. 92, 254–269. [DOI] [PubMed] [Google Scholar]
- Andreasen E. A., Spitsbergen J. M., Tanguay R. L., Stegeman J. J., Heideman W., Peterson R. E. (2002). Tissue-specific expression of AHR2, ARNT2, and CYP1A in zebrafish embryos and larvae: Effects of developmental stage and 2,3,7,8-tetrachlorodibenzo-p-dioxin exposure. Toxicol. Sci. 68, 403–419. [DOI] [PubMed] [Google Scholar]
- Arnold J. B. (2017). ggthemes: Extra Themes, Scales and Geoms for ‘ggplot2’. R package version 3.4.0 ed.
- Barron M. G., Heintz R., Rice S. D. (2004). Relative potency of PAHs and heterocycles as aryl hydrocarbon receptor agonists in fish. Mar. Environ. Res. 58, 95–100. [DOI] [PubMed] [Google Scholar]
- Bengtsson H. (2017). MatrixStats: Functions That Apply to Rows and Columns of Matrices (and to Vectors). R package version 053. 1.
- Bikoff E. K., Morgan M. A., Robertson E. J. (2009). An expanding job description for Blimp-1/PRDM1. Curr. Opin. Genet. Dev. 19, 379–385. [DOI] [PubMed] [Google Scholar]
- Billiard S. M., Timme-Laragy A. R., Wassenberg D. M., Cockman C., Di Giulio R. T. (2006). The role of the aryl hydrocarbon receptor pathway in mediating synergistic developmental toxicity of polycyclic aromatic hydrocarbons to zebrafish. Toxicol. Sci. 92, 526–536. [DOI] [PubMed] [Google Scholar]
- Bobick B. E., Cobb J. (2012). Shox2 regulates progression through chondrogenesis in the mouse proximal limb. J. Cell Sci. 125, 6071–6083. [DOI] [PubMed] [Google Scholar]
- Bolger A. M., Lohse M., Usadel B. (2014). Trimmomatic: A flexible trimmer for Illumina sequence data. Bioinformatics 30, 2114–2120. [DOI] [PMC free article] [PubMed] [Google Scholar]
- Bugel S. M., Tanguay R. L., Planchart A. (2014). Zebrafish: A marvel of high-throughput biology for 21(st) century toxicology. Curr. Environ. Health Rep. 1, 341–352. [DOI] [PMC free article] [PubMed] [Google Scholar]
- Carney S. A., Prasch A. L., Heideman W., Peterson R. E. (2006). Understanding dioxin developmental toxicity using the zebrafish model. Birth Defects Res. A Clin. Mol. Teratol. 76, 7–18. [DOI] [PubMed] [Google Scholar]
- Chlebowski A. C., Garcia G. R., La Du J. K., Bisson W. H., Truong L., Massey Simonich S. L., Tanguay R. L. (2017. a). Mechanistic investigations into the developmental toxicity of nitrated and heterocyclic PAHs. Toxicol. Sci. 157, 246–259. [DOI] [PMC free article] [PubMed] [Google Scholar]
- Chlebowski A. C., La Du J. K., Truong L., Massey Simonich S. L., Tanguay R. L. (2017. b). Investigating the application of a nitroreductase-expressing transgenic zebrafish line for high-throughput toxicity testing. Toxicol. Rep. 4, 202–210. [DOI] [PMC free article] [PubMed] [Google Scholar]
- Coutts S. M., Fulton N., Anderson R. A. (2007). Environmental toxicant-induced germ cell apoptosis in the human fetal testis. Hum. Reprod. 22, 2912–2918. [DOI] [PubMed] [Google Scholar]
- Crowell S. R., Amin S. G., Anderson K. A., Krishnegowda G., Sharma A. K., Soelberg J. J., Williams D. E., Corley R. A. (2011). Preliminary physiologically based pharmacokinetic models for benzo[a]pyrene and dibenzo[def,p]chrysene in rodents. Toxicol. Appl. Pharmacol. 257, 365–376. [DOI] [PMC free article] [PubMed] [Google Scholar]
- Curado S., Anderson R. M., Jungblut B., Mumm J., Schroeter E., Stainier D. Y. (2007). Conditional targeted cell ablation in zebrafish: A new tool for regeneration studies. Dev. Dyn. 236, 1025–1035. [DOI] [PubMed] [Google Scholar]
- Durinck S., Moreau Y., Kasprzyk A., Davis S., De Moor B., Brazma A., Huber W. (2005). BioMart and Bioconductor: A powerful link between biological databases and microarray data analysis. Bioinformatics 21, 3439–3440. [DOI] [PubMed] [Google Scholar]
- Durinck S., Spellman P. T., Birney E., Huber W. (2009). Mapping identifiers for the integration of genomic datasets with the R/Bioconductor package biomaRt. Nat. Protoc. 4, 1184–1191. [DOI] [PMC free article] [PubMed] [Google Scholar]
- Fabian P., Pantzartzi C. N., Kozmikova I., Kozmik Z. (2016). Vox homeobox gene: A novel regulator of midbrain-hindbrain boundary development in medaka fish? Dev. Genes Evol. 226, 99–107. [DOI] [PubMed] [Google Scholar]
- Forrest M. P., Waite A. J., Martin-Rendon E., Blake D. J. (2013). Knockdown of human TCF4 affects multiple signaling pathways involved in cell survival, epithelial to mesenchymal transition and neuronal differentiation. PLoS One 8, e73169. [DOI] [PMC free article] [PubMed] [Google Scholar]
- Galceran J., Sustmann C., Hsu S. C., Folberth S., Grosschedl R. (2004). LEF1-mediated regulation of delta-like1 links Wnt and notch signaling in somitogenesis. Genes Dev. 18, 2718–2723. [DOI] [PMC free article] [PubMed] [Google Scholar]
- Garcia G. R., Shankar P., Dunham C. L., Garcia A., La Du J. K., Truong L., Tilton S. C., Tanguay R. L. (2018). Signaling events downstream of AHR activation that contribute to toxic responses: The functional role of an AHR-dependent long noncoding RNA (slincR) using the zebrafish model. Environ. Health Perspect. 126, 117002. [DOI] [PMC free article] [PubMed] [Google Scholar]
- Geier M. C., Chlebowski A. C., Truong L., Massey Simonich S. L., Anderson K. A., Tanguay R. L. (2018). Comparative developmental toxicity of a comprehensive suite of polycyclic aromatic hydrocarbons. Arch. Toxicol. 92, 571–586. [DOI] [PMC free article] [PubMed] [Google Scholar]
- Genkinger J. M., Stigter L., Jedrychowski W., Huang T. J., Wang S., Roen E. L., Majewska R., Kieltyka A., Mroz E., Perera F. P. (2015). Prenatal polycyclic aromatic hydrocarbon (PAH) exposure, antioxidant levels and behavioral development of children ages 6–9. Environ. Res. 140, 136–144. [DOI] [PMC free article] [PubMed] [Google Scholar]
- Gibson-Brown J. J., Agulnik S. I., Silver L. M., Niswander L., Papaioannou V. E. (1998). Involvement of T-box genes Tbx2-Tbx5 in vertebrate limb specification and development. Development 125, 2499–2509. [DOI] [PubMed] [Google Scholar]
- Giesy J. P., Kannan K. (1998). Dioxin-like and non-dioxin-like toxic effects of polychlorinated biphenyls (PCBs): Implications for risk assessment. Crit. Rev. Toxicol. 28, 511–569. [DOI] [PubMed] [Google Scholar]
- Giri D., Ittmann M. (2000). Interleukin-1 alpha is a paracrine inducer of FGF7, a key epithelial growth factor in benign prostatic hyperplasia. Am. J. Pathol. 157, 249–255. [DOI] [PMC free article] [PubMed] [Google Scholar]
- Goodale B. C., Tilton S. C., Corvi M. M., Wilson G. R., Janszen D. B., Anderson K. A., Waters K. M., Tanguay R. L. (2013). Structurally distinct polycyclic aromatic hydrocarbons induce differential transcriptional responses in developing zebrafish. Toxicol. Appl. Pharmacol. 272, 656–670. [DOI] [PMC free article] [PubMed] [Google Scholar]
- Gu Z., Eils R., Schlesner M. (2016). Complex heatmaps reveal patterns and correlations in multidimensional genomic data. Bioinformatics 32, 2847–2849. [DOI] [PubMed] [Google Scholar]
- Gutkind J. S. (1998). The pathways connecting G protein-coupled receptors to the nucleus through divergent mitogen-activated protein kinase cascades. J. Biol. Chem. 273, 1839–1842. [DOI] [PubMed] [Google Scholar]
- Hahn M. E. (2002). Aryl hydrocarbon receptors: Diversity and evolution. Chem. Biol. Interact. 141, 131–160. [DOI] [PubMed] [Google Scholar]
- Hammerschmidt M., Pelegri F., Mullins M. C., Kane D. A., van Eeden F. J., Granato M., Brand M., Furutani-Seiki M., Haffter P., Heisenberg C. P., et al. (1996). Dino and mercedes, two genes regulating dorsal development in the zebrafish embryo. Development 123, 95–102. [DOI] [PubMed] [Google Scholar]
- Hikasa H., Sokol S. Y. (2013). Wnt signaling in vertebrate axis specification. Cold Spring Harb. Perspect. Biol. 5, a007955. [DOI] [PMC free article] [PubMed] [Google Scholar]
- Huber W., Carey V. J., Gentleman R., Anders S., Carlson M., Carvalho B. S., Bravo H. C., Davis S., Gatto L., Girke T., et al. (2015). Orchestrating high-throughput genomic analysis with bioconductor. Nat. Methods 12, 115–121. [DOI] [PMC free article] [PubMed] [Google Scholar]
- Hwang J., Mehrani T., Millar S. E., Morasso M. I. (2008). DLX3 is a crucial regulator of hair follicle differentiation and cycling. Development 135, 3149–3159. [DOI] [PMC free article] [PubMed] [Google Scholar]
- Incardona J. P., Carls M. G., Teraoka H., Sloan C. A., Collier T. K., Scholz N. L. (2005). Aryl hydrocarbon receptor-independent toxicity of weathered crude oil during fish development. Environ. Health Perspect. 113, 1755–1762. [DOI] [PMC free article] [PubMed] [Google Scholar]
- Incardona J. P., Linbo T. L., Scholz N. L. (2011). Cardiac toxicity of 5-ring polycyclic aromatic hydrocarbons is differentially dependent on the aryl hydrocarbon receptor 2 isoform during zebrafish development. Toxicol. Appl. Pharmacol. 257, 242–249. [DOI] [PubMed] [Google Scholar]
- Jayasundara N., Van Tiem Garner L., Meyer J. N., Erwin K. N., Di Giulio R. T. (2015). AHR2-mediated transcriptomic responses underlying the synergistic cardiac developmental toxicity of PAHs. Toxicol. Sci. 143, 469–481. [DOI] [PMC free article] [PubMed] [Google Scholar]
- Jedrychowski W. A., Perera F. P., Camann D., Spengler J., Butscher M., Mroz E., Majewska R., Flak E., Jacek R., Sowa A. (2015). Prenatal exposure to polycyclic aromatic hydrocarbons and cognitive dysfunction in children. Environ. Sci. Pollut. Res. Int. 22, 3631–3639. [DOI] [PMC free article] [PubMed] [Google Scholar]
- Jung K. H., Perzanowski M., Rundle A., Moors K., Yan B., Chillrud S. N., Whyatt R., Camann D., Perera F. P., Miller R. L. (2014). Polycyclic aromatic hydrocarbon exposure, obesity and childhood asthma in an urban cohort. Environ. Res. 128, 35–41. [DOI] [PMC free article] [PubMed] [Google Scholar]
- Karchner S., Franks D., Hahn M. (2005). AHR1B, a new functional aryl hydrocarbon receptor in zebrafish: tandem arrangement of ahr1b and ahr2 genes. Biochem. J. 392, 153–161. [DOI] [PMC free article] [PubMed] [Google Scholar]
- Kee K., Flores M., Cedars M. I., Reijo Pera R. A. (2010). Human primordial germ cell formation is diminished by exposure to environmental toxicants acting through the AHR signaling pathway. Toxicol. Sci. 117, 218–224. [DOI] [PMC free article] [PubMed] [Google Scholar]
- Kerkvliet N. I. (2009). AHR-mediated immunomodulation: The role of altered gene transcription. Biochem. Pharmacol. 77, 746–760. [DOI] [PMC free article] [PubMed] [Google Scholar]
- Kim S., Dere E., Burgoon L. D., Chang C. C., Zacharewski T. R. (2009). Comparative analysis of AHR-mediated TCDD-elicited gene expression in human liver adult stem cells. Toxicol. Sci. 112, 229–244. [DOI] [PMC free article] [PubMed] [Google Scholar]
- Kimmel C. B., Ballard W. W., Kimmel S. R., Ullmann B., Schilling T. F. (1995). Stages of embryonic development of the zebrafish. Dev. Dyn. 203, 253–310. [DOI] [PubMed] [Google Scholar]
- Knecht A. L., Goodale B. C., Truong L., Simonich M. T., Swanson A. J., Matzke M. M., Anderson K. A., Waters K. M., Tanguay R. L. (2013). Comparative developmental toxicity of environmentally relevant oxygenated PAHs. Toxicol. Appl. Pharmacol. 271, 266–275. [DOI] [PMC free article] [PubMed] [Google Scholar]
- Levin M. (2005). Left-right asymmetry in embryonic development: A comprehensive review. Mech. Dev. 122, 3–25. [DOI] [PubMed] [Google Scholar]
- Lo R., Matthews J. (2012). High-resolution genome-wide mapping of AHR and ARNT binding sites by ChIP-Seq. Toxicol. Sci. 130, 349–361. [DOI] [PubMed] [Google Scholar]
- Lonai P. (2003). Epithelial mesenchymal interactions, the ECM and limb development. J. Anat. 202, 43–50. [DOI] [PMC free article] [PubMed] [Google Scholar]
- Love M. I., Anders S., Kim V., Huber W. (2016). RNA-seq workflow: Gene-level exploratory analysis and differential expression [version 2; referees: 2 approved]. F1000Res 4, 1070. [DOI] [PMC free article] [PubMed] [Google Scholar]
- Love M. I., Huber W., Anders S. (2014). Moderated estimation of fold change and dispersion for RNA-seq data with DESeq2. Genome Biol. 15, 550. [DOI] [PMC free article] [PubMed] [Google Scholar]
- Ma Z., Swigut T., Valouev A., Rada-Iglesias A., Wysocka J. (2011). Sequence-specific regulator PRDM14 safeguards mouse ESCs from entering extraembryonic endoderm fates. Nat. Struct. Mol. Biol. 18, 120–127. [DOI] [PubMed] [Google Scholar]
- Mandrell D., Truong L., Jephson C., Sarker M. R., Moore A., Lang C., Simonich M. T., Tanguay R. L. (2012). Automated zebrafish chorion removal and single embryo placement: Optimizing throughput of zebrafish developmental toxicity screens. J. Lab. Autom. 17, 66–74. [DOI] [PMC free article] [PubMed] [Google Scholar]
- Mathew L. K., Andreasen E. A., Tanguay R. L. (2006). Aryl hydrocarbon receptor activation inhibits regenerative growth. Mol. Pharmacol. 69, 257–265. [DOI] [PubMed] [Google Scholar]
- Mathew L. K., Sengupta S. S., Ladu J., Andreasen E. A., Tanguay R. L. (2008). Crosstalk between AHR and Wnt signaling through R-Spondin1 impairs tissue regeneration in zebrafish. FASEB J. 22, 3087–3096. [DOI] [PMC free article] [PubMed] [Google Scholar]
- Mikels A. J., Nusse R. (2006). Purified Wnt5a protein activates or inhibits beta-catenin-TCF signaling depending on receptor context. PLoS Biol. 4, e115. [DOI] [PMC free article] [PubMed] [Google Scholar]
- Moreno-Layseca P., Streuli C. H. (2014). Signalling pathways linking integrins with cell cycle progression. Matrix Biol. 34, 144–153. [DOI] [PubMed] [Google Scholar]
- Mulero-Navarro S., Fernandez-Salguero P. M. (2016). New trends in aryl hydrocarbon receptor biology. Front. Cell Dev. Biol. 4, 45. [DOI] [PMC free article] [PubMed] [Google Scholar]
- Mullen L. M., Bryant S. V., Torok M. A., Blumberg B., Gardiner D. M. (1996). Nerve dependency of regeneration: The role of Distal-less and FGF signaling in amphibian limb regeneration. Development 122, 3487–3497. [DOI] [PubMed] [Google Scholar]
- Nebert D. W. (2017). Aryl hydrocarbon receptor (AHR): “Pioneer member” of the basic-helix/loop/helix per-Arnt-sim (bHLH/Pas) family of “sensors” of foreign and endogenous signals. Prog. Lipid Res. 67, 38–57. [DOI] [PMC free article] [PubMed] [Google Scholar]
- Ng C. H., Janoo-Gilani R., Sipahimalani P., Gallagher R. P., Gascoyne R. D., Connors J. M., Weber J. P., Lai A. S., Leach S., Le N. D., et al. (2010). Interaction between organochlorines and the AHR gene, and risk of non-Hodgkin lymphoma. Cancer Cause Control 21, 11–22. [DOI] [PubMed] [Google Scholar]
- Niederreither K., Ward S. J., Dolle P., Chambon P. (1996). Morphological and molecular characterization of retinoic acid-induced limb duplications in mice. Dev. Biol. 176, 185–198. [DOI] [PubMed] [Google Scholar]
- Nurieva R. I., Chung Y., Martinez G. J., Yang X. O., Tanaka S., Matskevitch T. D., Wang Y. H., Dong C. (2009). Bcl6 mediates the development of T follicular helper cells. Science 325, 1001–1005. [DOI] [PMC free article] [PubMed] [Google Scholar]
- Ober E. A., Field H. A., Stainier D. Y. (2003). From endoderm formation to liver and pancreas development in zebrafish. Mech. Dev. 120, 5–18. [DOI] [PubMed] [Google Scholar]
- Oliveros J. C. (2016). Venny. An Interactive Tool for Comparing Lists With Venn’s Diagrams. 2007–2015.
- Olson J. R., Mcgarrigle B. P. (1992). Comparative developmental toxicity of 2,3,7,8-tetrachlorodibenzo-p-dioxin (TCDD). Chemosphere 25, 71–74. [DOI] [PubMed] [Google Scholar]
- Osterwalder M., Speziale D., Shoukry M., Mohan R., Ivanek R., Kohler M., Beisel C., Wen X. H., Scales S. J., Christoffels V. M., et al. (2014). HAND2 targets define a network of transcriptional regulators that compartmentalize the early limb bud mesenchyme. Dev. Cell 31, 345–357. [DOI] [PMC free article] [PubMed] [Google Scholar]
- Park J. Y., Pillinger M. H., Abramson S. B. (2006). Prostaglandin E-2 synthesis and secretion: The role of PGE(2) synthases. Clin. Immunol. 119, 229–240. [DOI] [PubMed] [Google Scholar]
- Patro R., Duggal G., Love M. I., Irizarry R. A., Kingsford C. (2017). Salmon provides fast and bias-aware quantification of transcript expression. Nat. Methods 14, 417–419. [DOI] [PMC free article] [PubMed] [Google Scholar]
- Perera F. P., Chang H. W., Tang D., Roen E. L., Herbstman J., Margolis A., Huang T. J., Miller R. L., Wang S., Rauh V. (2014). Early-life exposure to polycyclic aromatic hydrocarbons and ADHD behavior problems. PLoS One 9, e111670. [DOI] [PMC free article] [PubMed] [Google Scholar]
- Perera F. P., Li Z., Whyatt R., Hoepner L., Wang S., Camann D., Rauh V. (2009). Prenatal airborne polycyclic aromatic hydrocarbon exposure and child IQ at age 5 years. Pediatrics 124, e195–202. [DOI] [PMC free article] [PubMed] [Google Scholar]
- Perera F. P., Rauh V., Whyatt R. M., Tang D., Tsai W. Y., Bernert J. T., Tu Y. H., Andrews H., Barr D. B., Camann D. E., et al. (2005). A summary of recent findings on birth outcomes and developmental effects of prenatal ETS, PAH, and pesticide exposures. Neurotoxicology 26, 573–587. [DOI] [PubMed] [Google Scholar]
- Perera F. P., Whyatt R. M., Jedrychowski W., Rauh V., Manchester D., Santella R. M., Ottman R. (1998). Recent developments in molecular epidemiology: A study of the effects of environmental polycyclic aromatic hydrocarbons on birth outcomes in Poland. Am. J. Epidemiol. 147, 309–314. [DOI] [PubMed] [Google Scholar]
- Prasch A. L., Teraoka H., Carney S. A., Dong W., Hiraga T., Stegeman J. J., Heideman W., Peterson R. E. (2003). Aryl hydrocarbon receptor 2 mediates 2,3,7,8-tetrachlorodibenzo-p-dioxin developmental toxicity in zebrafish. Toxicol. Sci. 76, 138–150. [DOI] [PubMed] [Google Scholar]
- Puga A., Ma C., Marlowe J. L. (2009). The aryl hydrocarbon receptor cross-talks with multiple signal transduction pathways. Biochem. Pharmacol. 77, 713–722. [DOI] [PMC free article] [PubMed] [Google Scholar]
- R Core Team. (2017). R: A Language and Environment for Statistical Computing. Version 3.4.1 ed. R Foundation for Statistical Computing, Vienna, Austria.
- RStudio Team. (2016). RStudio: Integrated Development for R. Version 1.1.453 ed. RStudio, Inc, Boston, MA. [Google Scholar]
- Rundle A., Hoepner L., Hassoun A., Oberfield S., Freyer G., Holmes D., Reyes M., Quinn J., Camann D., Perera F., et al. (2012). Association of childhood obesity with maternal exposure to ambient air polycyclic aromatic hydrocarbons during pregnancy. Am. J. Epidemiol. 175, 1163–1172. [DOI] [PMC free article] [PubMed] [Google Scholar]
- Sasagawa S., Takabatake T., Takabatake Y., Muramatsu T., Takeshima K. (2002). Axes establishment during eye morphogenesis in Xenopus by coordinate and antagonistic actions of BMP4, Shh, and RA. Genesis 33, 86–96. [DOI] [PubMed] [Google Scholar]
- Sauzeau V., Carvajal-González J. M., Riolobos A. S., Sevilla M. A., Menacho-Márquez M., Román A. C., Abad A., Montero M. J., Fernández-Salguero P., Bustelo X. R. (2011). Transcriptional factor aryl hydrocarbon receptor (AHR) controls cardiovascular and respiratory functions by regulating the expression of the Vav3 proto-oncogene. J. Biol. Chem. 286, 2896–2909. [DOI] [PMC free article] [PubMed] [Google Scholar]
- Schmidt J. V., Bradfield C. A. (1996). AH receptor signaling pathways. Annu. Rev. Cell Dev. Biol. 12, 55–89. [DOI] [PubMed] [Google Scholar]
- Scott J. A., Incardona J. P., Pelkki K., Shepardson S., Hodson P. V. (2011). AhR2-mediated, CYP1A-independent cardiovascular toxicity in zebrafish (Danio rerio) embryos exposed to retene. Aquat. Toxicol. 101, 165–174. [DOI] [PubMed] [Google Scholar]
- Seijffers R., Allchorne A. J., Woolf C. J. (2006). The transcription factor ATF-3 promotes neurite outgrowth. Mol. Cell. Neurosci. 32, 143–154. [DOI] [PubMed] [Google Scholar]
- Shannon P., Markiel A., Ozier O., Baliga N. S., Wang J. T., Ramage D., Amin N., Schwikowski B., Ideker T. (2003). Cytoscape: A software environment for integrated models of biomolecular interaction networks. Genome Res. 13, 2498–2504. [DOI] [PMC free article] [PubMed] [Google Scholar]
- Simone T. M., Higgins C. E., Czekay R. P., Law B. K., Higgins S. P., Archambeault J., Kutz S. M., Higgins P. J. (2014). SERPINE1: A molecular switch in the proliferation-migration dichotomy in wound-“activated” keratinocytes. Adv. Wound Care 3, 281–290. [DOI] [PMC free article] [PubMed] [Google Scholar]
- Slowikowski K. (2017). ggrepel: Repulsive Text and Label Geoms for ‘ggplot2’. R package version 0.6.5 ed.
- Soneson C., Love M. I., Robinson M. D. (2015). Differential analyses for RNA-seq: Transcript-level estimates improve gene-level inferences. F1000Res 4, 1521. [DOI] [PMC free article] [PubMed] [Google Scholar]
- Stelzer G., Rosen N., Plaschkes I., Zimmerman S., Twik M., Fishilevich S., Stein T. I., Nudel R., Lieder I., Mazor Y. (2016). The GeneCards suite: From gene data mining to disease genome sequence analyses. Curr. Protoc. Bioinform. 54, 1 30 31–31 30 33. [DOI] [PubMed] [Google Scholar]
- Suzuki Y., Niwa M., Yoshinaga J., Mizumoto Y., Serizawa S., Shiraishi H. (2010). Prenatal exposure to phthalate esters and PAHs and birth outcomes. Environ. Int. 36, 699–704. [DOI] [PubMed] [Google Scholar]
- Tanaka M., Komuro I., Inagaki H., Jenkins N. A., Copeland N. G., Izumo S. (2000). Nkx3.1, a murine homolog of drosophila bagpipe, regulates epithelial ductal branching and proliferation of the prostate and palatine glands. Dev. Dyn. 219, 248–260. [DOI] [PubMed] [Google Scholar]
- Ten Berge D., Kurek D., Blauwkamp T., Koole W., Maas A., Eroglu E., Siu R. K., Nusse R. (2011). Embryonic stem cells require Wnt proteins to prevent differentiation to epiblast stem cells. Nat. Cell Biol. 13, 1070–U1088. [DOI] [PMC free article] [PubMed] [Google Scholar]
- Tilton S. C., Tal T. L., Scroggins S. M., Franzosa J. A., Peterson E. S., Tanguay R. L., Waters K. M. (2012). Bioinformatics resource manager v2.3: An integrated software environment for systems biology with microRNA and cross-species analysis tools. BMC Bioinformatics 13, 311. [DOI] [PMC free article] [PubMed] [Google Scholar]
- Truong L., Simonich M. T., Tanguay R. L. (2016). Better, faster, cheaper: Getting the most out of high-throughput screening with zebrafish. Methods Mol. Biol. 1473, 89–98. [DOI] [PubMed] [Google Scholar]
- Wahl M., Lahni B., Guenther R., Kuch B., Yang L., Straehle U., Strack S., Weiss C. (2008). A technical mixture of 2,2′,4,4′-tetrabromo diphenyl ether (BDE47) and brominated furans triggers aryl hydrocarbon receptor (AHR) mediated gene expression and toxicity. Chemosphere 73, 209–215. [DOI] [PubMed] [Google Scholar]
- Weyand E. H., Geddie N., Rice J. E., Czech A., Amim S., La Voie E. J. (1988). Metabolism and mutagenic activity of benzo[k]fluoranthene and 3-flurobenzo[k]fluoranthene, 8-flurobenzo[k]fluoranthene and 9-fluorobenzo[k]fluoranthene. Carcinogenesis 9, 1277–1281. [DOI] [PubMed] [Google Scholar]
- Wickham H. (2016). ggplot2: Elegant Graphics for Data Analysis. Springer-Verlag, New York, NY. [Google Scholar]
- Wu F. J., Lin T. Y., Sung L. Y., Chang W. F., Wu P. C., Luo C. W. (2017). BMP8A sustains spermatogenesis by activating both Smad1/5/8 and Smad2/3 in spermatogonia. Sci. Signal. 10, eaal1910. [DOI] [PubMed] [Google Scholar]
- Yamaji M., Seki Y., Kurimoto K., Yabuta Y., Yuasa M., Shigeta M., Yamanaka K., Ohinata Y., Saitou M. (2008). Critical function of PRDM14 for the establishment of the germ cell lineage in mice. Nat. Genet. 40, 1016–1022. [DOI] [PubMed] [Google Scholar]
- Yamaji M., Ueda J., Hayashi K., Ohta H., Yabuta Y., Kurimoto K., Nakato R., Yamada Y., Shirahige K., Saitou M. (2013). PRDM14 ensures naive pluripotency through dual regulation of signaling and epigenetic pathways in mouse embryonic stem cells. Cell Stem Cell 12, 368–382. [DOI] [PubMed] [Google Scholar]
- Yamamoto-Shiraishi Y., Kuroiwa A. (2013). Wnt and BMP signaling cooperate with Hox in the control of Six2 expression in limb tendon precursor. Dev. Biol. 377, 363–374. [DOI] [PubMed] [Google Scholar]
- Yano T., Tamura K. (2013). The making of differences between fins and limbs. J. Anat. 222, 100–113. [DOI] [PMC free article] [PubMed] [Google Scholar]
Associated Data
This section collects any data citations, data availability statements, or supplementary materials included in this article.