

ABSTRACT
We evaluated the evolving structure of radiation oncology in Japan in terms of equipment, personnel, patient load and geographic distribution to identify and overcome any existing limitations. From March 2012 to August 2015, the Japanese Society for Radiation Oncology conducted a questionnaire based on the Japanese national structure survey of radiation oncology in 2011. Data were analyzed based on the institutional stratification by the annual number of new patients treated with radiotherapy per institution. The estimated annual numbers of new and total (new plus repeat) patients treated with radiation were 211 000 and 250 000, respectively. Additionally, the estimated cancer incidence was 851 537 cases with approximately 24.8% of all newly diagnosed patients being treated with radiation. The types and numbers of treatment devices actually used included linear accelerator (LINAC; n = 836), telecobalt (n = 3), Gamma Knife (n = 46), 60Co remote afterloading system (RALS; n = 24), and 192Ir RALS (n = 125). The LINAC system used dual-energy functions in 619 units, 3D conformal radiotherapy functions in 719 and intensity-modulated radiotherapy (IMRT) functions in 412. There were 756 JRS or JASTRO-certified radiation oncologists, 1018.5 full-time equivalent (FTE) radiation oncologists, 2026.7 FTE radiotherapy technologists, 149.1 FTE medical physicists, 141.5 FTE radiotherapy quality managers and 716.3 FTE nurses. The frequency of IMRT use significantly increased during this time. To conclude, although there was a shortage of personnel in 2011, the Japanese structure of radiation oncology has clearly improved in terms of equipment and utility.
Keywords: structure survey, radiotherapy institution, radiotherapy personnel, radiotherapy equipment
PREFACE
We highly appreciate the substantial contributions of the many radiation oncologists (ROs), radiation technologists and other staff to the national structure survey of radiation oncology. Despite some delays, the updated Japanese national structure survey data of radiation oncology in 2011 is now available.
Table 2.
Number of radiotherapy institutions by scale classification and institution category
| Scale category (annual number of new patients) | Institution category | Total | Institution ratio [%] | |||||
|---|---|---|---|---|---|---|---|---|
| U | G | N | P | O | H | |||
| A (≤99) | 5 | 1 | 11 | 41 | 32 | 21 | 111 | 16.0 |
| B (100–199) | 10 | 2 | 28 | 78 | 73 | 41 | 232 | 33.4 |
| C (200–299) | 13 | 2 | 11 | 46 | 39 | 24 | 135 | 19.5 |
| D (300–399) | 19 | 5 | 4 | 16 | 22 | 16 | 82 | 11.8 |
| E (400–499) | 17 | 1 | 3 | 12 | 7 | 12 | 52 | 7.5 |
| F (≥500) | 47 | 17 | 1 | 5 | 4 | 8 | 82 | 11.8 |
| Total | 111 | 28 | 58 | 198 | 177 | 122 | 694 | |
| Institution ratio [%] | 16.0 | 4.0 | 8.4 | 28.5 | 25.5 | 17.6 | 100.0 | |
Table 3.
Annual number of new patients by scale classification and institution category
| Scale category (number of institutions) | Institution category (number of institutions) | Total (694) | Average | |||||
|---|---|---|---|---|---|---|---|---|
| U (111) | G (28) | N (58) | P (198) | O (177) | H (122) | |||
| A (111) | 212 | 75 | 591 | 2318 | 2342 | 1491 | 7029 | 63.3 |
| B (232) | 1380 | 244 | 4100 | 10 443 | 10 820 | 5891 | 32 878 | 141.7 |
| C (135) | 3331 | 575 | 2736 | 9134 | 11 025 | 5900 | 32 701 | 242.2 |
| D (82) | 6594 | 1825 | 1401 | 7549 | 5486 | 5576 | 28 431 | 346.7 |
| E (52) | 7679 | 440 | 1249 | 3049 | 5282 | 5402 | 23 101 | 444.3 |
| F (82) | 34 532 | 15 544 | 721 | 2649 | 2931 | 4938 | 61 315 | 747.7 |
| Total (694) | 53 728 | 18 703 | 10 798 | 35 142 | 37 886 | 29,198 | 185 455 | 267.2 |
| Average | 484.0 | 668.0 | 186.2 | 177.5 | 214.0 | 239.3 | 267.2 | |
Table 4.
Annual number of total (new plus repeat) patients by scale classification and institution category
| Scale category (number of institutions) | Institution category (number of institutions) | Total (694) | Average | |||||
|---|---|---|---|---|---|---|---|---|
| U (111) | G (28) | N (58) | P (198) | O (177) | H (122) | |||
| A (111) | 227 | 135 | 745 | 2757 | 2633 | 1814 | 8311 | 74.9 |
| B (232) | 1600 | 254 | 4828 | 12 413 | 11 896 | 7113 | 38 104 | 164.2 |
| C (135) | 3861 | 726 | 3210 | 13 168 | 10 580 | 7561 | 39 106 | 289.7 |
| D (82) | 7890 | 2202 | 1602 | 6411 | 9560 | 6805 | 34 470 | 420.4 |
| E (52) | 9493 | 565 | 1444 | 6227 | 3735 | 6452 | 27 916 | 536.8 |
| F (82) | 40 135 | 18 867 | 800 | 3,355 | 2987 | 6041 | 72 185 | 880.3 |
| Total (694) | 63 206 | 22 749 | 12 629 | 44 331 | 41 391 | 35 786 | 220 092 | 317.1 |
| Average | 569.4 | 812.5 | 217.7 | 223.9 | 233.8 | 293.3 | 317.1 | |
Table 5.
Number of treatment devices and their functions by scale classification
| Treatment devices and their functions | Scale category (number of institutions) | Total (694) | |||||
|---|---|---|---|---|---|---|---|
| A (111) | B (232) | C (135) | D (82) | E (52) | F (82) | ||
| LINAC | 108 | 224 | 139 | 105 | 82 | 178 | 836 |
| with dual energy function | 56 | 163 | 108 | 85 | 62 | 145 | 619 |
| with 3DCRT function (MLC width ≤1.0 cm) | 74 | 180 | 120 | 98 | 76 | 171 | 719 |
| with IMRT function | 16 | 75 | 62 | 71 | 53 | 144 | 421 |
| with cone beam CT or CT on rail | 11 | 61 | 55 | 47 | 42 | 78 | 294 |
| with treatment position verification system (x-ray perspective image) | 22 | 57 | 56 | 47 | 39 | 76 | 297 |
| with treatment position verification system (other than those above) | 16 | 56 | 40 | 39 | 18 | 65 | 234 |
| Annual no. patients/LINAC | 77.0 | 170.1 | 281.3 | 328.3 | 340.4 | 405.5 | 263.3 |
| CyberKnife® | 2 | 4 | 2 | 4 | 2 | 3 | 17 |
| Novalis® | 1 | 3 | 4 | 9 | 6 | 8 | 31 |
| Tomotherapy® | 0 | 4 | 1 | 4 | 5 | 1 | 15 |
| Particle | 0 | 1 | 0 | 1 | 1 | 9 | 12 |
| Microtoron | 0 | 5 | 0 | 3 | 0 | 3 | 11 |
| Telecobalt (actual use) | 1 (1) | 1 (2) | 1 (0) | 0 (0) | 0 (0) | 0 (0) | 3 (3) |
| Gamma Knife® | 5 | 10 | 9 | 8 | 8 | 6 | 46 |
| Other accelerator | 0 | 1 | 3 | 0 | 0 | 1 | 5 |
| Other external irradiation device | 0 | 1 | 2 | 0 | 0 | 4 | 7 |
| New type 60Co RALS (actual use) | 0 (0) | 3 (3) | 5 (4) | 4 (4) | 4 (4) | 3 (3) | 19 (18) |
| Old type 60Co RALS (actual use) | 1 (0) | 4 (3) | 5 (2) | 0 (0) | 2 (1) | 0 (0) | 12 (6) |
| 192Ir RALS (actual use) | 1 (0) | 9 (8) | 15 (13) | 23 (22) | 21 (21) | 61 (61) | 130 (125) |
| 137Cs RALS (actual use) | 0 (0) | 0 (0) | 1 (1) | 0 (0) | 0 (0) | 1 (0) | 2 (1) |
LINAC = linear accelerator, 3DCRT = 3D conformal radiotherapy, MLC = multileaf collimator, IMRT = intensity-modulated radiotherapy, CT = computed tomography, Co = cobalt, RALS = remote-controlled after-loading system, Ir = iridium, Cs = caesium.
Table 6.
Number of treatment planning equipment and accessories by scale classification
| Treatment planning equipment and accessories | Scale category (number of institutions) | Total (694) | |||||
|---|---|---|---|---|---|---|---|
| A (111) | B (232) | C (135) | D (82) | E (52) | F (82) | ||
| X-ray simulator | 49 | 96 | 46 | 41 | 27 | 61 | 320 |
| CT simulator | 86 | 206 | 128 | 85 | 52 | 97 | 654 |
| RTP computer (≥2) | 116 (14) | 306 (51) | 221 (53) | 194 (46) | 188 (41) | 459 (77) | 1484 (282) |
| X-ray CT (≥2) | 186 (66) | 526 (188) | 380 (117) | 274 (79) | 187 (47) | 434 (80) | 1987 (577) |
| for RT only | 35 | 127 | 93 | 71 | 40 | 91 | 457 |
| MRI (≥2) | 128 (25) | 326 (93) | 244 (99) | 172 (66) | 129 (46) | 251 (74) | 1250 (403) |
| for RT only | 1 | 2 | 5 | 6 | 6 | 3 | 23 |
| Computer use for RT recording | 113 | 281 | 165 | 104 | 65 | 116 | 844 |
| Water phantom (≥2) | 109 (18) | 266 (53) | 170 (43) | 112 (29) | 88 (24) | 171 (48) | 916 (215) |
| Film densitometer (≥2) | 32 (2) | 93 (1) | 70 (0) | 60 (1) | 50 (7) | 84 (9) | 389 (20) |
| Dosemeter (≥3) | 281 (46) | 759 (141) | 497 (80) | 362 (58) | 279 (40) | 540 (70) | 2718 (435) |
CT = computed tomography, RTP = radiotherapy planning, MRI = magnetic resonance imaging, RT = radiotherapy.
Table 7.
Number of personnel and annual patients by scale classification
| Scale category (number of institutions) | Total (694) | ||||||
|---|---|---|---|---|---|---|---|
| A (111) | B (232) | C (135) | D (82) | E (52) | F (82) | ||
| Scale (annual no. of new patients) | ≤99 | 100–199 | 200–299 | 300–399 | 400–499 | ≥500 | |
| Institution ratio [%] | 16.0% | 33.4% | 19.5% | 11.8% | 7.5% | 11.8% | 100% |
| New patients | 7029 | 32 878 | 32 701 | 28 431 | 23 101 | 61 315 | 185 455 |
| New patients/institution | 63.3 | 141.7 | 242.2 | 346.7 | 444.3 | 747.7 | 267.2 |
| Total patients | 8311 | 38 104 | 39 106 | 34 470 | 27 916 | 72 185 | 220 092 |
| Total patients/institution | 74.9 | 164.2 | 289.7 | 420.4 | 536.8 | 880.3 | 317.1 |
| Beds | 37 008 | 99 656 | 65 101 | 46 505 | 33 805 | 64 075 | 346 150 |
| Institutions with RT beds (%) | 19 (17.1) | 52 (22.4) | 39 (28.9) | 28 (34.1) | 28 (53.8) | 56 (68.3) | 222 (32) |
| RT beds | 64.5 | 256.5 | 205.0 | 165.5 | 296.0 | 827.7 | 1,815.2 |
| RT beds/total beds (%) | 0.2% | 0.3% | 0.3% | 0.4% | 0.9% | 1.3% | 0.5% |
| RT beds/institution | 0.6 | 1.1 | 1.5 | 2.0 | 5.7 | 10.1 | 2.6 |
| RT beds/institution with RT beds | 3.4 | 4.9 | 5.3 | 5.9 | 10.6 | 14.8 | 8.2 |
| JRS-certified institutions (%) | 3 (2.7) | 31 (13.4) | 43 (31.9) | 48 (58.5) | 37 (71.2) | 74 (90.2) | 236 (34) |
| JRS-cooperation institutions (%) | 37 (33.3) | 111 (47.8) | 52 (38.5) | 27 (32.9) | 10 (19.2) | 16 (19.5) | 253 (36.5) |
| JASTRO-certified institutions (%) | 1 (0.9) | 47 (20.3) | 59 (43.7) | 57 (69.5) | 41 (78.8) | 78 (95.1) | 283 (40.8) |
| JRS membership (full time) | 50 | 176 | 135 | 143 | 122 | 415 | 1041 |
| JASTRO membership (full time) | 35 | 160 | 130 | 132 | 113 | 415 | 985 |
| JRS or JASTRO-certified ROs (full time) | 22 | 133 | 115 | 108 | 86 | 292 | 756 |
| Institutions with full time RO (%) | 44 (39.6) | 151 (65.1) | 109 (80.7) | 78 (95.1) | 49 (94.2) | 82 (100) | 513 (73.9) |
| ROs (full time) | 59 | 190 | 145 | 149 | 130 | 429 | 1,102 |
| ROs (full time)/institution | 0.5 | 0.8 | 1.1 | 1.8 | 2.5 | 5.2 | 1.6 |
| FTE RO (full time) | 24.4 | 145.0 | 125.3 | 121.9 | 103.1 | 359.4 | 878.9 |
| FTE RO (full time)/institution | 0.22 | 0.63 | 0.93 | 1.49 | 1.98 | 4.38 | 1.27 |
| ROs (part time) | 90 | 201 | 104 | 57 | 63 | 103 | 618 |
| ROs (part time)/institution | 0.81 | 0.87 | 0.77 | 0.70 | 1.21 | 1.26 | 0.89 |
| FTE RO (part time) | 15.2 | 34.8 | 19.3 | 9.6 | 15.0 | 45.8 | 139.6 |
| FTE RO (part time)/institution | 0.1 | 0.1 | 0.1 | 0.1 | 0.3 | 0.6 | 0.2 |
| FTE RO (full plus part time) | 39.6 | 179.8 | 144.5 | 131.5 | 118.1 | 405.2 | 1018.5 |
| FTE RO (full plus part time)/institution | 0.36 | 0.77 | 1.07 | 1.60 | 2.27 | 4.94 | 1.47 |
| Radiologists (full time) | 116.0 | 437.0 | 380.8 | 380.0 | 315.0 | 901.0 | 2,529.8 |
| Radiologists (part time) | 134.7 | 360.0 | 240.1 | 144.9 | 105.0 | 173.0 | 1157.7 |
| RTTs (full time)* | 331 | 800 | 547 | 415 | 308 | 696 | 3097 |
| FTE RTT | 156.0 | 470.1 | 334.5 | 286.4 | 228.8 | 551.0 | 2026.7 |
| Medical physicists (full-time)* | 14 | 71 | 49 | 66 | 43 | 104 | 347 |
| FTE Medical physicist | 4.4 | 25.2 | 18.5 | 25.2 | 19.0 | 56.9 | 149.1 |
| RT quality manager (full-time)* | 35 | 122 | 86 | 71 | 61 | 119 | 494 |
| FTE RT quality manager | 9.6 | 32.0 | 26.2 | 18.8 | 19.0 | 36.0 | 141.5 |
| Dosimetrists (full-time)* | 14 | 45 | 23 | 24 | 5 | 54 | 165 |
| FTE dosimetrist | 2.2 | 7.3 | 4.2 | 5.4 | 2.0 | 11.2 | 32.3 |
| Craftworkers (full-time)* | 45 | 101 | 52 | 32 | 21 | 62 | 313 |
| FTE craftworker | 7.2 | 15.9 | 8.0 | 5.7 | 1.8 | 7.5 | 46.0 |
| Nurses (full time) | 120 | 298 | 229 | 188 | 131 | 238 | 1204 |
| FTE nurse | 44.8 | 167.09 | 124.09 | 106.97 | 79.8 | 193.5 | 716.3 |
| Nursing assistants | 3.3 | 5.8 | 12.9 | 10.6 | 17 | 22.54 | 72.1 |
| Clerks | 18.9 | 62.4 | 69.25 | 66.9 | 56.4 | 116.9 | 390.8 |
*Overlap is included in the total number of each staff (radiotherapy technologist, medical physicist and radiotherapy quality manager).
RT = radiotherapy, JRS = Japan Radiological Society, RO = radiation oncologist, JASTRO = Japanese Society for Radiation Oncology, FTE = full-time equivalent, RTT = radiotherapy technologist.
Table 8.
Number of population, patients, institutions and patient load according to prefecture
| Prefecture | Population (×103) [32] | Institutions | New patients | New patients/institution | Total patients | Total patients/institution |
|---|---|---|---|---|---|---|
| Hokkaido | 5486 | 30 | 9285 | 309.5 | 11704 | 390.1 |
| Aomori | 1363 | 10 | 2107 | 210.7 | 2366 | 236.6 |
| Iwate | 1314 | 8 | 1606 | 200.8 | 2059 | 257.4 |
| Miyagi | 2327 | 12 | 3754 | 312.8 | 4621 | 385.1 |
| Akita | 1075 | 10 | 1644 | 164.4 | 2015 | 201.5 |
| Yamagata | 1161 | 6 | 1316 | 219.3 | 1490 | 248.3 |
| Fukushima | 1990 | 10 | 2726 | 272.6 | 3147 | 314.7 |
| Ibaraki | 2958 | 12 | 3331 | 277.6 | 4009 | 334.1 |
| Tochigi | 2000 | 9 | 2659 | 295.4 | 3363 | 373.7 |
| Gunma | 2001 | 14 | 3760 | 268.6 | 4225 | 301.8 |
| Saitama | 7207 | 20 | 7101 | 355.1 | 3094 | 404.7 |
| Chiba | 6214 | 23 | 7609 | 330.8 | 8877 | 386.0 |
| Tokyo | 13 196 | 65 | 23 627 | 363.5 | 28250 | 434.6 |
| Kanagawa | 9058 | 39 | 11 779 | 302.0 | 13412 | 343.9 |
| Niigata | 2,362 | 14 | 3637 | 259.8 | 4225 | 303.9 |
| Toyama | 1088 | 8 | 1608 | 201.0 | 1919 | 239.9 |
| Ishikawa | 1166 | 7 | 1789 | 255.6 | 2144 | 306.3 |
| Fukui | 803 | 6 | 1130 | 188.3 | 1375 | 229.2 |
| Yamanashi | 857 | 3 | 959 | 319.7 | 1188 | 396.0 |
| Nagano | 2142 | 15 | 3466 | 231.1 | 3880 | 258.7 |
| Gifu | 2071 | 11 | 2815 | 255.9 | 3509 | 319.0 |
| Shizuoka | 3749 | 23 | 6205 | 269.8 | 7837 | 340.7 |
| Aichi | 7416 | 38 | 10 197 | 268.3 | 12390 | 326.1 |
| Mie | 1847 | 12 | 1870 | 155.8 | 2169 | 180.8 |
| Shiga | 1414 | 10 | 1755 | 175.5 | 2158 | 215.8 |
| Kyoto | 2632 | 13 | 3900 | 300.0 | 4680 | 360.0 |
| Osaka | 8861 | 51 | 13 474 | 264.2 | 15987 | 313.5 |
| Hyogo | 5582 | 30 | 7855 | 261.8 | 8934 | 297.8 |
| Nara | 1396 | 8 | 2152 | 269.0 | 2523 | 315.4 |
| Wakayama | 995 | 9 | 1569 | 174.3 | 1812 | 201.3 |
| Tottori | 585 | 7 | 1036 | 148.0 | 1160 | 165.7 |
| Shimane | 712 | 5 | 985 | 197.0 | 1166 | 233.2 |
| Okayama | 1941 | 10 | 2680 | 268.0 | 3156 | 315.6 |
| Hiroshima | 2855 | 19 | 4562 | 240.1 | 5512 | 290.1 |
| Yamaguchi | 1442 | 14 | 1833 | 130.9 | 2069 | 147.8 |
| Tokushima | 780 | 5 | 1320 | 264.0 | 1425 | 285.0 |
| Kagawa | 992 | 5 | 961 | 192.2 | 1123 | 224.6 |
| Ehime | 1423 | 10 | 2439 | 243.9 | 2867 | 286.7 |
| Kochi | 758 | 5 | 1231 | 246.2 | 1397 | 279.4 |
| Fukuoka | 5079 | 25 | 8048 | 321.9 | 9944 | 397.8 |
| Saga | 847 | 4 | 830 | 207.5 | 969 | 242.3 |
| Nagasaki | 1417 | 9 | 2277 | 253.0 | 2695 | 299.4 |
| Kumamoto | 1813 | 13 | 3004 | 231.1 | 3446 | 265.1 |
| Oita | 1191 | 11 | 1621 | 147.4 | 1948 | 177.1 |
| Miyazaki | 1131 | 7 | 1569 | 224.1 | 1893 | 270.4 |
| Kagoshima | 1699 | 12 | 2618 | 218.2 | 2928 | 244.0 |
| Okinawa | 1401 | 7 | 1756 | 250.9 | 2002 | 286.0 |
| Total | 127 797 | 694 | 185 455 | 267.2 | 220092 | 317.1 |
Table 9.
Number of population, patients, radiation oncologists and patient load according to prefecture
| Prefecture | Population (×103) [32] | Total patients | JRS or JASTRO—certified RO | FTE RO | Total patients/FTE RO |
|---|---|---|---|---|---|
| Hokkaido | 5486 | 11 704 | 41 | 51.1 | 229.0 |
| Aomori | 1363 | 2366 | 10 | 9.7 | 243.9 |
| Iwate | 1314 | 2059 | 9 | 10.0 | 206.9 |
| Miyagi | 2327 | 4621 | 11 | 21.8 | 212.5 |
| Akita | 1075 | 2015 | 4 | 7.6 | 265.1 |
| Yamagata | 1161 | 1490 | 5 | 8.5 | 175.3 |
| Fukushima | 1990 | 3147 | 8 | 13.9 | 226.4 |
| Ibaraki | 2958 | 4009 | 11 | 16.3 | 246.0 |
| Tochigi | 2000 | 3363 | 10 | 13.1 | 256.7 |
| Gunma | 2001 | 4225 | 26 | 31.6 | 133.7 |
| Saitama | 7207 | 8094 | 19 | 27.5 | 294.8 |
| Chiba | 6214 | 8877 | 33 | 50.8 | 174.9 |
| Tokyo | 13 196 | 28 250 | 91 | 122.4 | 230.9 |
| Kanagawa | 9058 | 13 412 | 45 | 57.1 | 234.9 |
| Niigata | 2362 | 4255 | 14 | 19.0 | 223.9 |
| Toyama | 1088 | 1919 | 6 | 9.5 | 202.0 |
| Ishikawa | 1166 | 2144 | 8 | 8.6 | 249.3 |
| Fukui | 803 | 1375 | 10 | 10.1 | 136.1 |
| Yamanashi | 857 | 1188 | 5 | 7.6 | 156.3 |
| Nagano | 2142 | 3880 | 8 | 12.3 | 316.7 |
| Gifu | 2071 | 3509 | 6 | 10.1 | 347.4 |
| Shizuoka | 3749 | 7837 | 24 | 30.8 | 254.4 |
| Aichi | 716 | 12 390 | 40 | 57.8 | 214.4 |
| Mie | 1847 | 2169 | 5 | 9.0 | 241.0 |
| Shiga | 1414 | 2158 | 7 | 13.1 | 165.1 |
| Kyoto | 2632 | 4680 | 20 | 30.0 | 156.0 |
| Osaka | 8861 | 15 987 | 62 | 80.3 | 199.1 |
| Hyogo | 5582 | 8934 | 35 | 44.9 | 199.0 |
| Nara | 1396 | 2523 | 9 | 15.7 | 160.7 |
| Wakayama | 995 | 1812 | 7 | 7.7 | 235.3 |
| Tottori | 585 | 1160 | 5 | 4.5 | 257.8 |
| Shimane | 712 | 1166 | 7 | 7.3 | 159.7 |
| Okayama | 1941 | 3156 | 12 | 18.4 | 172.0 |
| Hiroshima | 2855 | 5512 | 23 | 26.6 | 207.2 |
| Yamaguchi | 1442 | 2069 | 7 | 10.8 | 191.6 |
| Tokushima | 780 | 1425 | 7 | 7.2 | 197.9 |
| Kagawa | 992 | 1123 | 3 | 4.7 | 238.9 |
| Ehime | 1423 | 2867 | 9 | 12.2 | 235.0 |
| Kochi | 758 | 1397 | 5 | 4.3 | 324.9 |
| Fukuoka | 5079 | 9944 | 32 | 44.1 | 225.5 |
| Saga | 847 | 969 | 7 | 5.6 | 173.0 |
| Nagasaki | 1417 | 2695 | 10 | 10.5 | 256.7 |
| Kumamoto | 1813 | 3446 | 12 | 18.4 | 187.3 |
| Oita | 1191 | 1948 | 5 | 7.3 | 266.8 |
| Miyazaki | 1131 | 1893 | 9 | 7.6 | 249.1 |
| Kagoshima | 1699 | 2928 | 10 | 13.7 | 213.7 |
| Okinawa | 1401 | 2002 | 4 | 7.8 | 256.7 |
| Total | 127 797 | 220 092 | 756 | 1018.5 | 216.1 |
JASTRO = Japanese Society for Radiation Oncology, RO = radiation oncologist, FTE = full-time equivalent.
Table 10.
Number of population, patients, staff and patient load according to prefecture
| Prefecture | Total patients | FTE RTT | Total patients/FTE RTT | FTE MP | FTE RTQM |
|---|---|---|---|---|---|
| Hokkaido | 11 704 | 74.0 | 158.2 | 16.8 | 5.7 |
| Aomori | 2366 | 26.1 | 90.7 | 2.8 | 2.6 |
| Iwate | 2059 | 22.5 | 91.7 | 1.3 | 0.7 |
| Miyagi | 4621 | 39.7 | 116.4 | 3.0 | 2.1 |
| Akita | 2015 | 19.0 | 106.1 | 1.1 | 1.6 |
| Yamagata | 1490 | 16.1 | 92.5 | 0.7 | 1.5 |
| Fukushima | 3147 | 35.7 | 88.3 | 2.5 | 1.5 |
| Ibaraki | 4009 | 42.0 | 95.5 | 1.6 | 2.1 |
| Tochigi | 3363 | 28.8 | 116.8 | 0.9 | 2.4 |
| Gunma | 4225 | 46.0 | 91.8 | 2.8 | 3.1 |
| Saitama | 8094 | 59.9 | 135.1 | 3.4 | 4.5 |
| Chiba | 8877 | 81.9 | 108.4 | 7.2 | 3.0 |
| Tokyo | 28 250 | 242.4 | 116.5 | 14.5 | 10.8 |
| Kanagawa | 13 412 | 139.5 | 96.1 | 6.6 | 8.1 |
| Niigata | 4255 | 41.5 | 102.5 | 2.1 | 0.8 |
| Toyama | 1919 | 20.4 | 94.3 | 0.7 | 1.9 |
| Ishikawa | 2144 | 22.7 | 94.4 | 1.7 | 1.7 |
| Fukui | 1375 | 21.8 | 63.1 | 0.0 | 0.6 |
| Yamanashi | 1188 | 6.3 | 190.1 | 0.4 | 1.1 |
| Nagano | 3880 | 31.7 | 122.4 | 2.3 | 1.7 |
| Gifu | 3509 | 29.7 | 118.2 | 1.4 | 2.9 |
| Shizuoka | 7837 | 78.0 | 100.5 | 4.3 | 6.6 |
| Aichi | 12 390 | 108.1 | 114.6 | 8.4 | 6.8 |
| Mie | 2169 | 28.1 | 77.2 | 1.2 | 2.5 |
| Shiga | 2158 | 31.3 | 69.1 | 0.7 | 2.5 |
| Kyoto | 4680 | 37.5 | 124.8 | 5.7 | 5.2 |
| Osaka | 15 987 | 156.3 | 102.3 | 20.3 | 13.2 |
| Hyogo | 8934 | 99.6 | 89.7 | 4.0 | 5.5 |
| Nara | 2523 | 23.7 | 106.5 | 1.6 | 2.5 |
| Wakayama | 1812 | 24.2 | 74.9 | 0.3 | 0.2 |
| Tottori | 1160 | 13.4 | 86.6 | 0.3 | 1.9 |
| Shimane | 1166 | 12.5 | 93.3 | 0.2 | 2.2 |
| Okayama | 3156 | 30.3 | 104.2 | 2.3 | 2.9 |
| Hiroshima | 5512 | 44.4 | 124.1 | 3.1 | 4.8 |
| Yamaguchi | 2069 | 25.6 | 80.8 | 0.1 | 1.3 |
| Tokushima | 1425 | 14.9 | 95.6 | 0.3 | 2.0 |
| Kagawa | 1123 | 7.7 | 145.8 | 0.1 | 0.0 |
| Ehime | 2867 | 25.5 | 112.4 | 2.2 | 3.3 |
| Kochi | 1397 | 9.6 | 145.5 | 1.1 | 0.8 |
| Fukuoka | 9944 | 69.5 | 143.2 | 5.6 | 7.3 |
| Saga | 969 | 9.2 | 105.3 | 0.1 | 0.1 |
| Nagasaki | 2695 | 18.5 | 145.7 | 2.1 | 2.1 |
| Kumamoto | 3446 | 31.0 | 111.2 | 6.3 | 3.1 |
| Oita | 1948 | 19.2 | 101.7 | 1.3 | 1.9 |
| Miyazaki | 1893 | 17.5 | 108.2 | 0.8 | 1.2 |
| Kagoshima | 2928 | 28.4 | 103.1 | 2.8 | 1.0 |
| Okinawa | 2002 | 15.4 | 130.4 | 0.4 | 0.6 |
| Total | 220 092 | 2026.7 | 108.6 | 149.1 | 141.5 |
FTE = full-time equivalent, RTT = radiotherapy technologist, MP = medical physicist, RTQM = radiotherapy quality manager, NS = nurse.
Table 11.
Number of institutions and patients with special radiotherapy by scale classification
| Specific therapy | 2011 | 2010 | ||||||
|---|---|---|---|---|---|---|---|---|
| A (111) | B (232) | C (135) | D (82) | E (52) | F (82) | Total (694) | Total (705) | |
| Intracavitary radiotherapy | ||||||||
| Treatment institutions | 0 | 14 | 19 | 25 | 25 | 59 | 142 | 152 |
| Patients | 0 | 117 | 265 | 442 | 404 | 1780 | 3008 | 3245 |
| Interstitial radiotherapy | ||||||||
| Treatment institutions | 0 | 13 | 10 | 18 | 14 | 50 | 105 | 115 |
| Patients | 0 | 198 | 299 | 476 | 685 | 2413 | 4071 | 4194 |
| Radioactive iodine therapy for prostate | ||||||||
| Treatment institutions | 0 | 10 | 10 | 16 | 13 | 44 | 93 | 101 |
| Patients | 0 | 160 | 298 | 443 | 472 | 1900 | 3273 | 3115 |
| Radioactive iodine therapy for hyperthyroidism | ||||||||
| Treatment institutions | 0 | 3 | 12 | 4 | 12 | 23 | 54 | 59 |
| Patients | 0 | 53 | 207 | 125 | 417 | 1077 | 1879 | 2080 |
| Total body radiotherapy | ||||||||
| Treatment institutions | 9 | 14 | 25 | 27 | 28 | 59 | 162 | 186 |
| Patients | 69 | 109 | 252 | 220 | 322 | 985 | 1957 | 1937 |
| Intraoperative radiotherapy | ||||||||
| Treatment institutions | 3 | 1 | 1 | 5 | 2 | 8 | 20 | 24 |
| Patients | 4 | 1 | 1 | 36 | 13 | 47 | 102 | 161 |
| Stereotactic brain radiotherapy | ||||||||
| Treatment institutions | 14 | 40 | 42 | 44 | 34 | 40 | 214 | 211 |
| Patients | 888 | 1921 | 2698 | 2676 | 2712 | 2873 | 13 768 | 13 800 |
| Stereotactic body radiotherapy | ||||||||
| Treatment institutions | 2 | 35 | 47 | 46 | 33 | 59 | 222 | 203 |
| Patients | 4 | 210 | 572 | 877 | 438 | 1451 | 3552 | 3536 |
| IMRT | ||||||||
| Treatment institutions | 2 | 19 | 27 | 31 | 27 | 58 | 164 | 136 |
| Patients | 8 | 880 | 1263 | 1723 | 1584 | 3429 | 8887 | 6356 |
| Thermoradiotherapy | ||||||||
| Treatment institutions | 1 | 6 | 4 | 2 | 1 | 5 | 19 | 20 |
| Patients | 22 | 47 | 41 | 61 | 74 | 82 | 327 | 359 |
| 90Sr-90 radiotherapy for pterygia | ||||||||
| Treatment institutions | 1 | 1 | 3 | 2 | 0 | 1 | 8 | 5 |
| Patients | 1 | 2 | 9 | 14 | 0 | 19 | 45 | 33 |
| Internal 89Sr radiotherapy | ||||||||
| Treatment institutions | 7 | 31 | 35 | 29 | 27 | 40 | 169 | 142 |
| Patients | 21 | 119 | 170 | 135 | 141 | 383 | 969 | 793 |
| Internal 90Y radiotherapy | ||||||||
| Treatment institutions | 2 | 4 | 4 | 0 | 6 | 15 | 31 | 33 |
| Patients | 16 | 20 | 12 | 0 | 15 | 43 | 106 | 153 |
IMRT = intensity-modulated radiotherapy, Sr = strontium, Y = yttrium.
Table 12.
Annual number of new patients by disease site*
| Primary site | n | % |
|---|---|---|
| Cerebrospinal | 7728 | 4.4 |
| Head and neck (including thyroid) | 16 168 | 9.1 |
| Esophagus | 9392 | 5.3 |
| Lung, trachea and mediastinum | 34 071 | 19.2 |
| Lung | 30 442 | 17.2 |
| Breast | 41 421 | 23.4 |
| Liver, biliary tract pancreas | 6310 | 3.6 |
| Gastric, small intestine, colorectal | 8297 | 4.7 |
| Gynecologic | 8358 | 4.7 |
| Urogenital | 27 909 | 15.7 |
| Prostate | 22 321 | 12.6 |
| Hematopoietic and lymphatic | 8388 | 4.7 |
| Skin, bonel, and soft tissue | 4132 | 2.3 |
| Other (malignant) | 2738 | 1.5 |
| Benign tumors | 2,445 | 1.4 |
| Pediatric = < 15 years (included in totals above) | 852 | 0.5 |
| Total | 177 357 | 100 |
*Total number of new patients in Table 3 differ from these data because no data on primary sites were reported by some institutions.
Table 13.
Annual number of total patients (new plus repeat) treated for any brain metastasis and bone metastasis by scale classification.
| Metastasis | Scale category (number of institutions) | Total (694) | ||||||||||||
|---|---|---|---|---|---|---|---|---|---|---|---|---|---|---|
| A (111) | B (232) | C (135) | D (82) | E (52) | F (82) | |||||||||
| n | % | n | % | n | % | n | % | n | % | n | % | n | % | |
| Brain | 1104 | 13.3 | 3680 | 9.7 | 4165 | 10.7 | 3096 | 9.0 | 2861 | 10.2 | 5974 | 8.3 | 20 934 | 9.5 |
| Bone | 1207 | 14.5 | 5658 | 14.8 | 5192 | 13.3 | 4578 | 13.3 | 3400 | 12.2 | 8521 | 11.8 | 28556 | 13.0 |
Table 14.
Classification of institutions by number of FTE radiation oncologists in all radiotherapy institutions and designated cancer care hospitals
| Institution category | Description | Institutions |
|---|---|---|
| RH-A | All radiotherapy hospitals (FTE RO ≥1.0) | 394 |
| RH-B | All radiotherapy hospitals (FTE RO <1.0) | 300 |
| Total | 694 | |
| DCCH-A | Designated cancer care hospitals (FTE RO ≥1.0) | 272 |
| DCCH-B | Designated cancer care hospitals (FTE RO <1.0) | 108 |
| Total | 380 |
FTE = full-time equivalent, RO = radiation oncologist.
Table 15.
Annual numbers of patients receiving radiotherapy, numbers of LINACs, numbers of staff, patient load per LINAC and patient load per personnel according to institution categories shown Table 14; all radiotherapy hospitals
| RH-A (394) | RH-B (300) | Total (694) | ||||
|---|---|---|---|---|---|---|
| Average per hospital | Total number | Average per hospital | Total number | Average per hospital | Total number | |
| Total patients | 431.8 | 170 117 | 166.6 | 49 975 | 317.1 | 220 092 |
| New patients | 361.7 | 142 505 | 143.2 | 42 950 | 267.2 | 185 455 |
| LINAC | 1.4 | 546 | 1.0 | 290 | 1.2 | 836 |
| Annual no. of total patients/LINAC | 311.6 | 172.3 | 263.3 | |||
| Annual no. of new patients/LINAC | 261.0 | 148.1 | 221.8 | |||
| FTE RO | 2.3 | 900.0 | 0.4 | 118.5 | 1.5 | 1018.5 |
| JRS or JASTRO-certified RO (full time) | 1.7 | 672 | 0.3 | 84 | 1.1 | 756 |
| Annual no. of total patients/FTE RO | 189.0 | 421.7 | 216.1 | |||
| Annual no. of new patients/FTE RO | 158.3 | 362.4 | 182.1 | |||
| FTE RT technologist | 3.8 | 1485.0 | 1.8 | 541.7 | 2.9 | 2026.7 |
| Annual no. of total patients/FTE RTT | 114.6 | 92.3 | 108.6 | |||
| Annual no. of new patients/FTE RTT | 96.0 | 79.3 | 91.5 | |||
| FTE RT technologist/LINAC | 2.7 | 1.9 | 2.4 | |||
| FTE medical physicist | 0.33 | 128.7 | 0.07 | 20.4 | 0.21 | 149.1 |
| Annual no. of total patients/FTE MP | 1322.0 | 2449.8 | 1476.3 | |||
| Annual no. of new patients/FTE MP | 1107.4 | 2105.4 | 1244.0 | |||
| FTE RT quality manager | 0.28 | 110.2 | 0.10 | 31.3 | 0.20 | 141.5 |
| Annual no. of total patients/FTE RTQM | 1543.7 | 1596.6 | 1555.4 | |||
| Annual No. of new patients/FTE RTQM | 1293.1 | 1372.2 | 1310.6 | |||
| FTE RT quality manager/LINAC | 0.20 | 0.11 | 0.17 | |||
LINAC = linear accelerator, FTE = full-time equivalent, RO = radiation oncologist, RTT = radiotherapy technologist, MP = medical physicist, RTQM = radiotherapy quality manager.
Table 16.
Annual numbers of patients receiving radiotherapy, numbers of LINACs, numbers of staff, patient load per LINAC and patient load per personnel according to institution categories shown Table 14; designated cancer care hospitals (DCCH)
| DCCH-A (272) | DCCH-B (108) | Total (380) | ||||
|---|---|---|---|---|---|---|
| Average per hospital | Total number | Average per hospital | Total number | Average per hospital | Total number | |
| Total patients | 498.7 | 135 633 | 200.0 | 21 595 | 413.8 | 157 228 |
| New patients | 416.7 | 113 329 | 175.6 | 18 968 | 348.2 | 132 297 |
| LINAC | 1.5 | 418 | 1.1 | 114 | 1.4 | 532 |
| Annual no. of total patients/LINAC | 324.5 | 189.4 | 295.5 | |||
| Annual no. of new patients/LINAC | 271.1 | 166.4 | 248.7 | |||
| FTE RO | 2.5 | 677.8 | 0.5 | 54.6 | 1.9 | 732.4 |
| JRS or JASTRO-certified RO (full time) | 1.9 | 515 | 0.4 | 44 | 1.5 | 559 |
| Annual no. of total patients/FTE RO | 200.1 | 395.9 | 214.7 | |||
| Annual no. of new patients/FTE RO | 167.2 | 347.7 | 180.6 | |||
| FTE RT technologist | 4.1 | 1112.9 | 2.1 | 229.4 | 3.5 | 1342.3 |
| Annual no. of total patients/FTE RTT | 121.9 | 94.2 | 117.1 | |||
| Annual no. of new patients/FTE RTT | 101.8 | 82.7 | 98.6 | |||
| FTE RT technologist/LINAC | 2.7 | 2.0 | 2.5 | |||
| FTE medical physicist | 0.36 | 98.7 | 0.09 | 10.0 | 0.29 | 108.7 |
| Annual no. of total patients/FTE MP | 1374.1 | 2159.5 | 1446.3 | |||
| Annual no. of new patients/FTE MP | 1148.1 | 1896.8 | 1217.0 | |||
| FTE RT quality manager | 0.30 | 81.7 | 0.14 | 15.3 | 0.26 | 97.0 |
| Annual no. of total patients/FTE RTQM | 1660.1 | 1416.1 | 1621.7 | |||
| Annual no. of new patients/FTE RTQM | 1387.1 | 1243.8 | 1364.6 | |||
| FTE RT quality manager/LINAC | 0.20 | 0.13 | 0.18 | |||
LINAC = linear accelerator, FTE = full-time equivalent, RO = radiation oncologist, RTT = radiotherapy technologist, MP = medical physicist, RTQM = radiotherapy quality manager.
Table 17.
Number of items of equipment and their functions according to institution categories shown Table 14
| RH-A (n = 394) | RH-B (n = 300) | Total (n = 694) | ||||
|---|---|---|---|---|---|---|
| n | % | n | % | n | % | |
| LINAC | 546 | 96.4 | 290 | 94.7 | 836 | 95.7 |
| with dual energy function | 430 | 84.0 | 189 | 62.7 | 619 | 74.8 |
| with 3DCRT function (MLC width = < 1.0 cm) | 505 | 90.6 | 214 | 70.3 | 719 | 81.8 |
| with IMRT function | 352 | 62.9 | 69 | 22.7 | 421 | 45.5 |
| with cone beam CT or CT on rail | 241 | 50.3 | 53 | 17.7 | 294 | 36.2 |
| with treatment position verification system (x-ray perspective image) | 230 | 45.9 | 67 | 21.7 | 297 | 35.4 |
| with treatment position verification system (other than those above) | 171 | 35.5 | 63 | 20.3 | 234 | 29.0 |
| CT simulator | 402 | 92.4 | 252 | 79.7 | 654 | 86.9 |
| DCCH-A (n = 272) | DCCH-B (n = 108) | Total (n = 380) | ||||
| n | % | n | % | n | % | |
| LINAC | 418 | 99.6 | 114 | 100.0 | 532 | 99.7 |
| with dual energy function | 340 | 91.5 | 84 | 76.9 | 424 | 87.4 |
| with 3DCRT function (MLC width = < 1.0 cm) | 397 | 95.6 | 90 | 80.6 | 487 | 91.3 |
| with IMRT function | 280 | 69.9 | 35 | 31.5 | 315 | 58.9 |
| with cone beam CT or CT on rail | 192 | 56.6 | 24 | 22.2 | 216 | 46.8 |
| with treatment position verification system (x-ray perspective image) | 181 | 51.5 | 30 | 26.9 | 211 | 44.5 |
| with treatment position verification system (other than those above) | 130 | 37.5 | 30 | 25.9 | 160 | 34.2 |
| CT simulator | 280 | 95.2 | 98 | 84.3 | 378 | 92.1 |
LINAC = linear accelerator, 3DCRT = 3D conformal radiotherapy, MLC = multileaf collimator, IMRT = intensity-modulated radiotherapy, CT = computed tomography.
Fig. 2.

Distribution of annual total (new plus repeat) patient load per LINAC in radiotherapy institutions. Horizontal axis represents institutions arranged in order of increasing value of annual number of total patients per LINAC within the institution. Q1: 0–25%, Q2: 26–50%, Q3: 51–75%, Q4: 76–100%.
Fig. 3.

Distribution of annual total (new plus repeat) patient load per FTE radiation oncologist in all radiotherapy institutions. Horizontal axis represents institutions arranged in order of increasing value of annual number of total patients per FTE radiation oncologist within the institution. Q1: 0–25%, Q2: 26–50%, Q3: 51–75%, Q4: 76–100%.
Fig. 4.

Distribution of annual total (new plus repeat) patient load per FTE radiotherapy technologist (RTT) in all radiotherapy institutions. Horizontal axis represents institutions arranged in order of increasing value of annual number of total patients per FTE RTT within the institution. Q1: 0–25%, Q2: 26–50%, Q3: 51–75%, Q4: 76–100%.
Fig. 5.

Distribution of annual total (new plus repeat) patient load per FTE radiation oncologist in designated cancer care hospitals. Horizontal axis represents institutions arranged in order of increasing value of annual number of total patients per FTE radiation oncologist within the institution. Q1: 0–25%, Q2: 26–50%, Q3: 51–75%, Q4: 76–100%.
Since 1991, the Japanese Society for Radiation Oncology (JASTRO) has conducted national structure surveys every 2 years [1–25]. From March 2012 to August 2015, a questionnaire regarding the 2011 national structure survey of radiation oncology was conducted that included the number of treatment systems by type, number of personnel by category and number of patients by type, site and treatment modality. To measure variables over a longer time period, data for the year 2011 were also considered. In total, 694 of 787 active institutions attempted the survey; the response rate was 88.2%.
The current report analyzes these institutional structure data (equipment, personnel, patient load and geographic distribution) based on institutional stratification by the annual number of new patients treated with radiotherapy at each institution. Clinical working hours of each staff member performing radiotherapy were derived from full-time equivalent (FTE; 40 h per week for radiation oncology work only) data. The Japanese Blue Book Guidelines (JBBG) [26, 27] were used for comparison with the results of this study. These guidelines pertain to the structure of radiation oncology in Japan based on Patterns of Care Study (PCS) [28, 29] data. The standard guidelines were set at 250–300 (warning level, 400) for annual patient load per external beam machine, at 200 (warning level, 300) for annual patient load per FTE RO and at 120 (warning level, 200) for annual patient load per FTE radiotherapy technologist. Furthermore, we analyzed data from the designated cancer care hospitals accredited by the Ministry of Health, Labor and Welfare. As on 1 October 2016, Japan had 427 designated cancer care hospitals [30]. Forty-seven institutions did not return the survey; therefore, the structure data for these 380 designated cancer care hospitals were analyzed and compared with the data for all radiotherapy hospitals. The analysis was conducted in two groups: institutions with <1.0 FTE RO and those with ≥1.0 FTE RO.
Here, preliminary results have been presented as tables and figures (Tables 1–18 and Figs 1–6). We have briefly summarized the Japanese national structure survey of radiation oncology for 2011. In total, 787
Table 1.
Category of radiotherapy institution
| Institution category | |
|---|---|
| U | University hospital |
| G | Cancer center (including national centers) |
| N | National hospital organization (excluding cancer centers) |
| P | Public hospital (excluding cancer centers) |
| O | Red cross hospital, saiseikai hospital, company hospital, public corporation hospital, national health insurance hospital, social insurance hospital, mutual insurance hospital, industrial accident hospital, association hospital and Japan agricultural co-operative hospital |
| H | Medical corporation hospital, medical association hospital, private hospital and other hospital |
Table 18.
Number of radiotherapy institutions, treatment devices, patient load and personnel: trend 1990–2011
| Survey year | ||||||||||||
|---|---|---|---|---|---|---|---|---|---|---|---|---|
| 1990 | 1993 | 1995 | 1997 | 1999 | 2001 | 2003 | 2005 | 2007 | 2009 | 2010 | 2011 | |
| Institution | 378 | 629 | 504 | 568 | 636 | 603 | 726 | 712 | 721 | 700 | 705 | 694 |
| Response rate | 48.5% | 88.3% | 73.9% | 78.6% | 86.3% | 85.3% | 100% | 96.9% | 94.2% | 90.9% | 90.4% | 88.2% |
| New patients | 62 829 | — | 71 696 | 84 379 | 107 150 | 118 016 | 149 793 | 156 318 | 170 229 | 182 390 | 190 322 | 185 455 |
| Total patients | — | — | — | — | — | — | — | 191 173 | 205 087 | 217 829 | 226 851 | 220 092 |
| Average of new patients | 166 | — | 142 | 149 | 168 | 196 | 206 | 220 | 236 | 261 | 270 | 267 |
| Treatment device (actual use) | ||||||||||||
| LINAC | 311 | 508 | 407 | 475 | 626 | 626 | 744 | 765 | 807 | 816 | 829 | 836 |
| Telecobalt | 170 | 213 | 127 | 98 | 83 | 45 | 42 | 11 | 15 | 11 | 9 | 3 |
| 192Ir RALS | — | — | 29 | 50 | 73 | 93 | 117 | 119 | 123 | 130 | 131 | 125 |
| Full time RO | 547 | 748 | 821 | 889 | 925 | 878 | 921 | 1003 | 1007 | 1085 | 1123 | 1102 |
| FTE RO | — | — | — | — | — | — | — | 774 | 826 | 939 | 959 | 1019 |
| Full time JASTRO-certified RO | — | — | — | — | — | 308 | 369 | 426 | 477 | 529 | 564 | 756 |
| FTE RT technologist | 592 | 877 | 665 | 733 | 771 | 918 | 1555 | 1635 | 1634 | 1836 | 1841 | 2027 |
| Treatment planning equipment | ||||||||||||
| X-ray simulators | 295 | 430 | 394 | 452 | 512 | 464 | 532 | 502 | 445 | 361 | 348 | 320 |
| CT simulators | 30 | 75 | 55 | 96 | 164 | 247 | 329 | 407 | 497 | 575 | 633 | 654 |
| RTP computers | 238 | 468 | 374 | 453 | 682 | 680 | 874 | 940 | 1070 | 1271 | 1381 | 1484 |
LINAC = linear accelerator, Ir = iridium, RO = radiation oncologist, FTE = full-time equivalent, JASTRO = Japanese Society for Radiation Oncology, RT = radiotherapy, JRS = Japan Radiological Society, JASTRO = Japanese Society for Radiation Oncology, CT = computed tomography, RTP = radiotherapy planning.
Fig. 1.
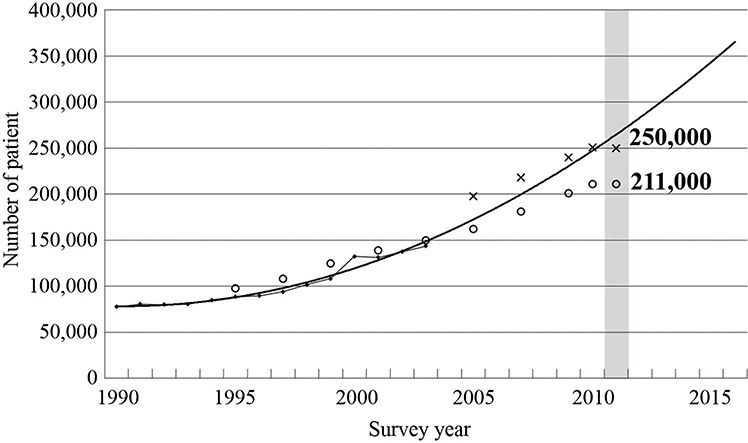
Estimate of increase in demand for radiotherapy in Japan, based on statistical correction of annual change in the number of new patients per year at Patterns of Care Study survey facilities [26]. x and o denote the estimated number of total (new plus repeat) and new patients by the results in structure surveys by the JASTRO.
Fig. 6.

Distribution of annual total (new plus repeat) patient load per FTE radiotherapy technologist (RTT) in designated cancer care hospitals. Horizontal axis represents institutions arranged in order of increasing value of annual number of total patients per FTE RTT within the institution. Q1: 0–25%, Q2: 26–50%, Q3: 51–75%, Q4: 76–100%.
radiotherapy institutions were surveyed, and the estimated number of new patients was approximately 211 000, whereas that of total patients (new plus repeat) was 250 000. The estimated annual numbers of patients treated with radiation had not increased since 2010. It is assumed that there are two reasons for the above. First, because the response rate of this survey was lower than usual, the calculation of the estimated value had even more errors than usual. Secondly, the treatment time for each patient has increased because of an increase in the number of patients with high-precision radiotherapy such as SBRT and IMRT. In 2011, based on Japanese cancer registries, the cancer incidence was estimated at 851 537 cases [31] with approximately 24.8% (211 000 of 851 537) of all newly diagnosed patients being treated with radiation. Overall, 836 linear accelerators (LINACs), 3 telecobalt units, 46 Gamma Knife, 24 60Co remote afterloading systems (RALS) and 125 192Ir RALS were actually used. The LINAC system used dual-energy functions in 619 units, 3D conformal radiotherapy functions in 719 and intensity-modulated radiotherapy (IMRT) functions in 412. Regarding personnel, there were a total 756 board-certified ROs [JASTRO or JRS (Japan Radiological Society)], 1018.5 FTE ROs, 2026.7 FTE radiotherapy technologists, 149.1 FTE medical physicists, 141.5 FTE radiotherapy quality managers and 716.3 FTE nurses. Approximately 50.6% of all radiotherapy institutions had >200 new radiotherapy patients per year, whereas 31.1% of the institutions had >300. Additionally, 43.2% of all radiotherapy institutions had <1.0 FTE ROs. We expect that this updated national structure survey of radiation oncology for 2011 will aid the continuous improvement of all aspects of radiation oncology in Japan.
FUNDING
This study was supported by the JASTRO and Grants-in-Aid for Scientific Research from the Japan Society for the Promotion of Science [JSPS KAKENHI Grant No. JP17K10475].
CONFLICT OF INTEREST
None declared.
REFERENCES
- 1). Tsunemoto H. Present status of Japanese radiation oncology: National survey of structure in 1990 (in Japanese). J Jpn Soc Ther Radiol Oncol (Special Report) 1992;1–30. [Google Scholar]
- 2). Sato S, Nakamura Y, Kawashima K et al. Present status of radiotherapy in Japan -a census in 1990- finding on radiotherapy facilities (in Japanese with an English abstract). J Jpn Soc Ther Radiol Oncol 1994;6:83–9. [Google Scholar]
- 3). Morita K, Uchiyama Y. Present status of radiotherapy in Japan -the second census in 1993- (in Japanese with an English abstract). J Jpn Soc Ther Radiol Oncol 1995;7:251–61. [Google Scholar]
- 4). JASTRO Database Committee Present status of radiotherapy in Japan -the regular census in 1995- (in Japanese with an English abstract). J Jpn Soc Ther Radiol Oncol 1997;9:231–53. [Google Scholar]
- 5). JASTRO Database Committee Present status of radiotherapy in Japan -the regular census in 1997- (in Japanese with an English abstract). J Jpn Soc Ther Radiol Oncol 2001;13:175–82. [Google Scholar]
- 6). JASTRO Database Committee Present status of radiotherapy in Japan -the regular structure survey in 1999- (in Japanese with an English abstract). J Jpn Soc Ther Radiol Oncol 2001;13:227–35. [Google Scholar]
- 7). JASTRO Database Committee Present status of radiotherapy in Japan -the regular structure survey in 2001- (in Japanese with an English abstract). J Jpn Soc Ther Radiol Oncol 2003;15:51–9. [Google Scholar]
- 8). JASTRO Database Committee Present status of radiotherapy in Japan -the regular structure survey in 2003- (in Japanese with an English abstract). J Jpn Soc Ther Radiol Oncol 2005;17:115–21. [Google Scholar]
- 9). Shibuya H, Tsujii H. The structural characteristics of radiation oncology in Japan in 2003. Int J Radiat Oncol Biol Phys 2005;62:1472–6. [DOI] [PubMed] [Google Scholar]
- 10). Teshima T, Numasaki H, Shibuya H et al. Japanese structure survey of radiation oncology in 2005 (first report) (in Japanese with an English abstract). J Jpn Soc Ther Radiol Oncol 2007;19:181–92. [Google Scholar]
- 11). Teshima T, Numasaki H, Shibuya H et al. Japanese structure survey of radiation oncology in 2005 (second report) (in Japanese with an English abstract). J Jpn Soc Ther Radiol Oncol 2007;19:193–205. [Google Scholar]
- 12). Teshima T, Numasaki H, Shibuya H et al. Japanese structure survey of radiation oncology in 2005 based on institutional stratification of patterns of care study. Int J Radiat Oncol Biol Phys 2008;72:144–52. [DOI] [PubMed] [Google Scholar]
- 13). Numasaki H, Teshima T, Shibuya H et al. National structure of radiation oncology in Japan with special reference to designated cancer care hospital. Int J Clin Oncol 2009;14:237–44. [DOI] [PubMed] [Google Scholar]
- 14). Teshima T, Numasaki H, Shibuya H et al. Japanese structure survey of radiation oncology in 2007 (first report) (in Japanese with an English abstract). J Jpn Soc Ther Radiol Oncol 2009;21:113–25. [Google Scholar]
- 15). Teshima T, Numasaki H, Shibuya H et al. Japanese structure survey of radiation oncology in 2007 (second report) (in Japanese with an English abstract). J Jpn Soc Ther Radiol Oncol 2009;21:126–38. [Google Scholar]
- 16). Teshima T, Numasaki H, Shibuya H et al. Japanese structure survey of radiation oncology in 2007 based on institutional stratification of patterns of care study. Int J Radiat Oncol Biol Phys 2010;72:144–52. [DOI] [PubMed] [Google Scholar]
- 17). Numasaki H, Teshima T, Shibuya H et al. Japanese structure survey of radiation oncology in 2007 with special reference to designated cancer care hospitals. Strahlenther Onkol 2011;187:167–74. [DOI] [PubMed] [Google Scholar]
- 18). Numasaki H, Shibuya H, Nishio M et al. National medical care system may impede fostering of true specialization of radiation oncologists: Study based on structure survey in Japan. Int J Radiat Oncol Biol Phys 2012;82:e111–7. [DOI] [PubMed] [Google Scholar]
- 19). Teshima T, Numasaki H, Nishimura T et al. Japanese structure survey of radiation oncology in 2009 (first report) (in Japanese). http://www.jastro.or.jp/aboutus/datacenter.php (1 November 2013, date last accessed).
- 20). Teshima T, Numasaki H, Nishimura T et al. Japanese structure survey of radiation oncology in 2009 (second report) (in Japanese). http://www.jastro.or.jp/aboutus/datacenter.php (1 November 2013, date last accessed).
- 21). Teshima T, Numasaki H, Nishio M et al. Japanese structure survey of radiation oncology in 2009 based on institutional stratification of patterns of care study. J Radiat Res 2012;53:710–2. [DOI] [PMC free article] [PubMed] [Google Scholar]
- 22). Numasaki H, Nishio M, Ikeda H et al. Japanese structure survey of radiation oncology in 2009 with special reference to designated cancer care hospitals. Int J Clin Oncol 2013;18:775–83. [DOI] [PubMed] [Google Scholar]
- 23). Teshima T, Numasaki H, Nishimura T et al. Japanese structure survey of radiation oncology in 2010 (first report) (in Japanese). http://www.jastro.or.jp/aboutus/datacenter.php (1 June 2017, date last accessed). [DOI] [PMC free article] [PubMed]
- 24). Teshima T, Numasaki H, Nishimura T et al. Japanese structure survey of radiation oncology in 2010 (second report) (in Japanese). http://www.jastro.or.jp/aboutus/datacenter.php (1 June 2017, date last accessed). [DOI] [PMC free article] [PubMed]
- 25). Numasaki H, Teshima T, Nishimura T et al. Japanese structure survey of radiation oncology in 2010. J Radiat Res 2019;60:80–97. [DOI] [PMC free article] [PubMed] [Google Scholar]
- 26). Japanese PCS Working Group Radiation oncology in multidisciplinary cancer therapy -Basic structure requirement for quality assurance of radiotherapy based on Patterns of Care Study in Japan. Ministry of Health. Labor, and Welfare Cancer Research Grant Planned Research Study 2005;14–6. [Google Scholar]
- 27). Japanese PCS Working Group Radiation oncology in multidisciplinary cancer therapy -Basic structure requirement for quality assurance of radiotherapy based on Patterns of Care Study in Japan. Ministry of Health. Labor, and Welfare Cancer Research Grant Planned Research Study 2010;18–4. [Google Scholar]
- 28). Tanisada K, Teshima T, Ohno Y et al. Patterns of care study quantitative evaluation of the quality of radiotherapy in Japan. Cancer 2002;95:164–71. [DOI] [PubMed] [Google Scholar]
- 29). Teshima T. Japanese PCS working group. Patterns of care study in Japan. Jpn J Clin Oncol 2005;35:497–506. [DOI] [PubMed] [Google Scholar]
- 30). Ministry of Health , Labor and Welfare. A list of designated cancer hospitals http://www.mhlw.go.jp/ (1 November 2016, date last accessed).
- 31). Cancer Information Service, National Cancer Center, Japan Cancer Registry and Statistics http://ganjoho.jp/reg_stat/statistics/dl/index.html (1 August 2015, date last accessed).
- 32). Statistics Bureau , Ministry of Internal Affairs and Communications. 2011 population census http://www.stat.go.jp/data/jinsui/2011np/index.htm (1 August 2015, date last accessed).